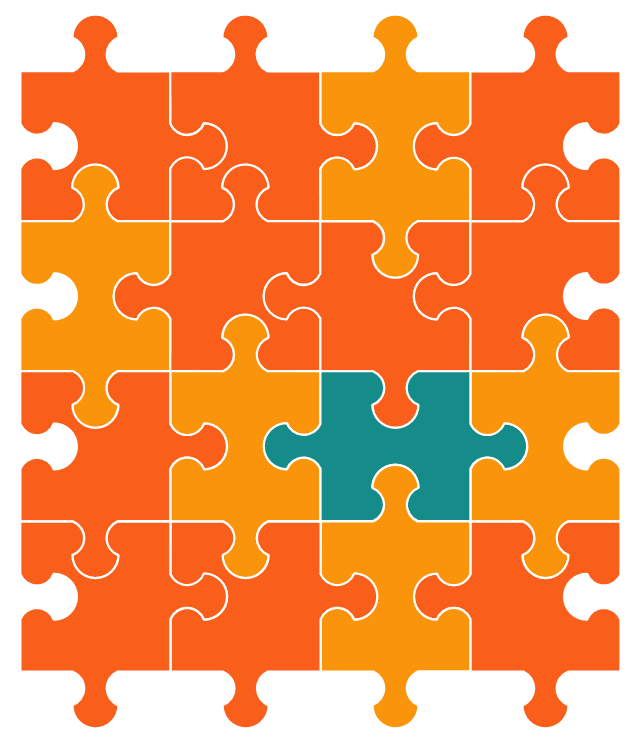
This puzzle piece diagram sample shows alternating sign matrix. It was designed on the base of the Wikimedia Commons file: Matrice signes alternants 4x4.svg. "An alternating sign matrix, seen as a puzzle." [commons.wikimedia.org/ wiki/ File:Matrice_ signes_ alternants_ 4x4.svg]
"In mathematics, an alternating sign matrix is a square matrix of 0s, 1s, and −1s such that the sum of each row and column is 1 and the nonzero entries in each row and column alternate in sign. These matrices generalize permutation matrices and arise naturally when using Dodgson condensation to compute a determinant. They are also closely related to the six-vertex model with domain wall boundary conditions from statistical mechanics. They were first defined by William Mills, David Robbins, and Howard Rumsey in the former context." [Alternating sign matrix. Wikipedia]
This file is licensed under the Creative Commons Attribution-Share Alike 3.0 Unported license. [creativecommons.org/ licenses/ by-sa/ 3.0/ deed.en]
The marketing chart example "Puzzle piece diagram - Alternating sign matrix" was created using the ConceptDraw PRO diagramming and vector drawing software extended with the Marketing Diagrams solution from the Marketing area of ConceptDraw Solution Park.
Marketing chart
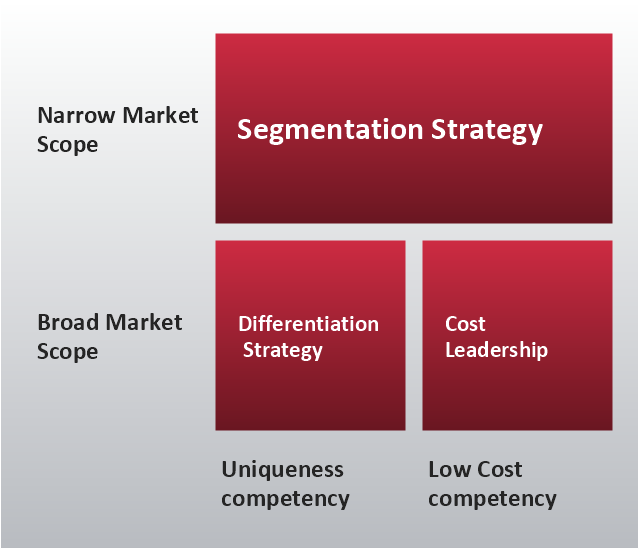
"Michael Porter has described a category scheme consisting of three general types of strategies that are commonly used by businesses to achieve and maintain competitive advantage. These three generic strategies are defined along two dimensions: strategic scope and strategic strength. Strategic scope is a demand-side dimension and looks at the size and composition of the market you intend to target. Strategic strength is a supply-side dimension and looks at the strength or core competency of the firm. In particular he identified two competencies that he felt were most important: product differentiation and product cost (efficiency)." [Porter's generic strategies. Wikipedia]
This Porter's generic strategies matrix diagram was redesigned from Wikipedia file PorterGenericStrategies.png. [en.wikipedia.org/ wiki/ File:PorterGenericStrategies.png]
This file is licensed under the Creative Commons Attribution-Share Alike 3.0 Unported license. [creativecommons.org/ licenses/ by-sa/ 3.0/ deed.en]
This Porter's generic strategies matrix diagram example was created by the ConceptDraw PRO diagramming and vector drawing software extended with the Matrices solution from the Marketing area of ConceptDraw Solution Park.
Porter's generic strategies matrix
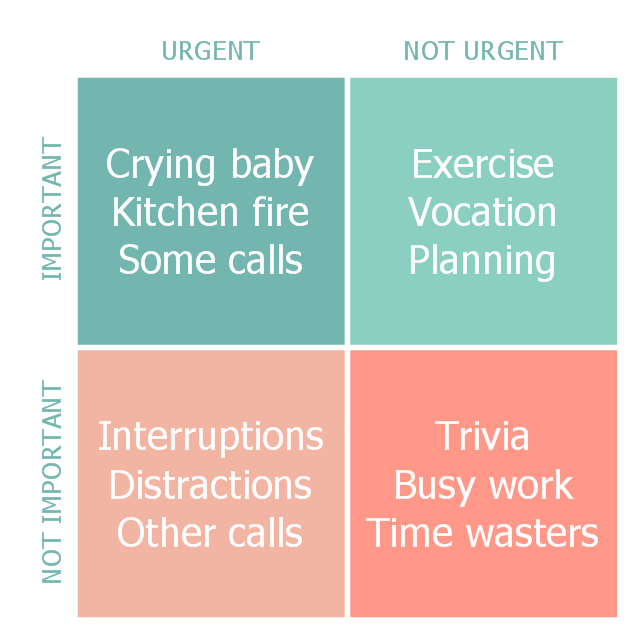
This Eisenhower decision matrix example was designed on the base of Wikimedia Commons file: MerrillCoveyMatrix.png. [commons.wikimedia.org/ wiki/ File:MerrillCoveyMatrix.png]
"Using the Eisenhower Decision Principle, tasks are evaluated using the criteria important / unimportant and urgent/ not urgent, and then placed in according quadrants in an Eisenhower Matrix (also known as an "Eisenhower Box" or "Eisenhower Decision Matrix"). Tasks are then handled as follows:
Tasks in
1. Important / Urgent quadrant are done immediately and personally e.g. crises, deadlines, problems.
2. Important / Not Urgent quadrant get an end date and are done personally e.g. relationships, planning, recreation.
3. Unimportant / Urgent quadrant are delegated e.g. interruptions, meetings, activities.
4. Unimportant / Not Urgent quadrant are dropped e.g. time wasters, pleasant activities, trivia." [The Eisenhower Method. Time management. Wikipedia]
The matrix diagram sample "Eisenhower box" was created using the ConceptDraw PRO software extended with the Scrum solution from the Project Management area of ConceptDraw Solution Park.
Matrix diagram
Pyramid Chart Examples

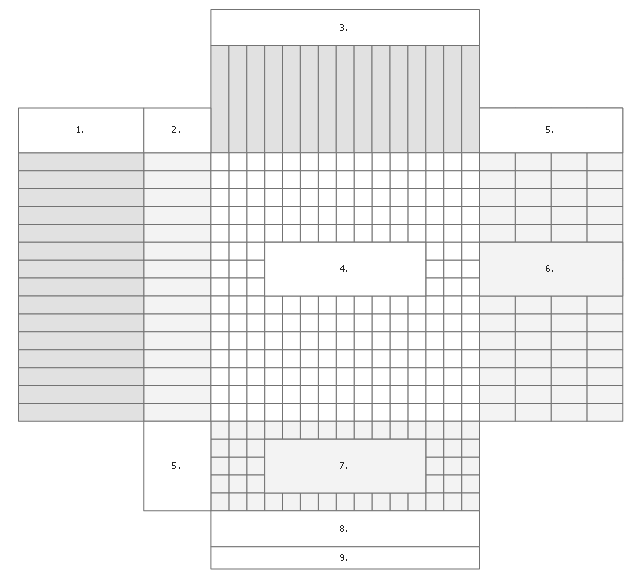
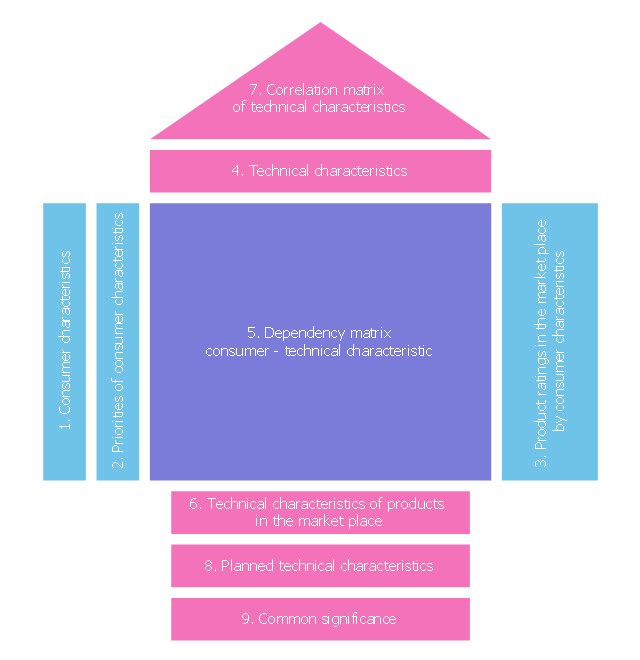
This house of quality matrix template was designed on the base of the Wikimedia Commons file: House of quality 9 step.png.
"An example of House of Quality including numbers (1-9) for easier relation between text and image."
[commons.wikimedia.org/ wiki/ File:House_ of_ quality_ 9_ step.png]
"Product Design. Initially, information about customer requirements must be collected. Once done, these should be converted into qualitative properties in the form of design. A tool used to facilitate this is the House of Quality, which is based on a number of processes that generally follow the list below.
1. Customer characteristics
2. Priorities of customer characteristics (scale 1-5)
3. Technical characteristics
4. Relationships between customer and technical characteristics (1.3.9)
5. Competing products
6. Rating of products on the market by customer characteristics (scale 1-5)
7. Rating of products on the market by technical characteristics (scale 1-5)
8. Rating and comparison of measurable values for product properties
9. The tool converts the information into measurable results
Then a more precise requirement specification can be made. Where product requirements and technical characteristics are developed in detail." [sv.wikipedia.org/ wiki/ Quality_ function_ deployment]
The HOQ template "House of quality 9 step" was designed using ConceptDraw PRO software extended with House of Quality solution from Quality area of ConceptDraw PRO Solution Park.
HOQ matrix
This house of quality matrix sample was designed on the base of the Wikimedia Commons file: Схема дома качества.jpg.
[ru.wikipedia.org/ wiki/ Файл:Схема_ дома_ качества.jpg ]
"The output of the house of quality is generally a matrix with customer desires on one dimension and correlated nonfunctional requirements on the other dimension. The cells of matrix table are filled with the weights assigned to the stakeholder characteristics where those characteristics are affected by the system parameters across the top of the matrix. At the bottom of the matrix, the column is summed, which allows for the system characteristics to be weighted according to the stakeholder characteristics. System parameters not correlated to stakeholder characteristics may be unnecessary to the system design and are identified by empty matrix columns, while stakeholder characteristics (identified by empty rows) not correlated to system parameters indicate "characteristics not address by the design parameters". System parameters and stakeholder characteristics with weak correlations potentially indicate missing information, while matrices with "too many correlations" indicate that the stakeholder needs may need to be refined." [Quality function deployment. Wikipedia]
The HOQ example "House of quality scheme" was designed using ConceptDraw PRO software extended with House of Quality solution from Quality area of ConceptDraw PRO Solution Park.
HOQ matrix
Pyramid Diagram

 People
This solution extends ConceptDraw DIAGRAM software with samples, templates and libraries of vector clipart for drawing the People illustrations. Use it to make professional-looking documents, presentations and websites illustrated with color scalable vector c
Cross-Functional Flowchart


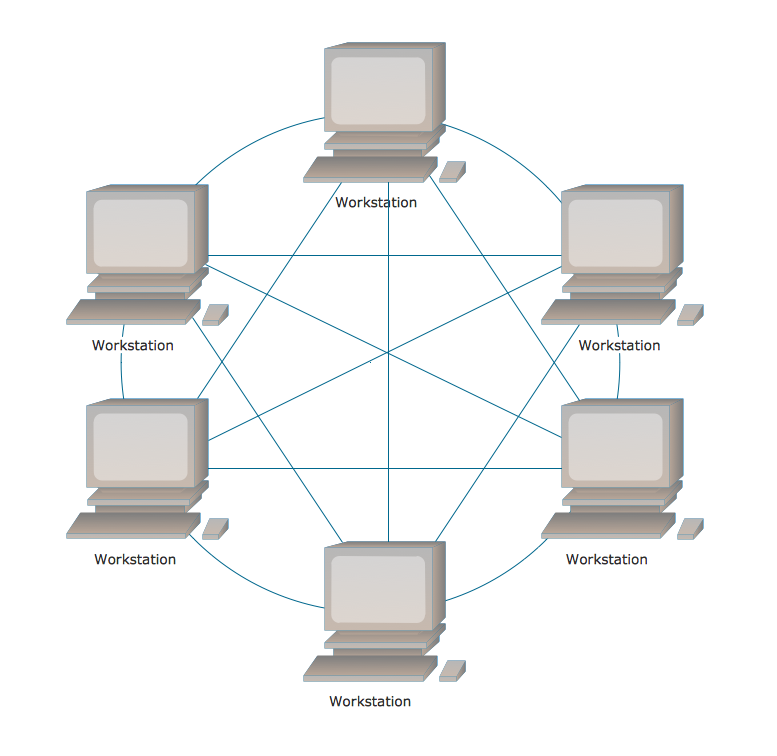
Fully Connected Network Topology Diagram
- What Is Tows Matrix Wikipedia
- Bcg Matrix Wiki
- Project management triangle diagram | Project Management Wiki
- Responsibility assignment matrix - Central statistical office | Person ...
- Selling Process Wikipedia
- Puzzle piece diagram - Alternating sign matrix | Marketing Diagrams ...
- Puzzle piece diagram - Alternating sign matrix | Artwork | Marketing ...
- PROBLEM ANALYSIS. Prioritization Matrix | Prioritization Matrix ...
- Pert Diagram Wiki