The vector stencils library "Shopping pictograms" contains 20 icons of shop, store and trade symbols. Use it to draw your pictorial infograms. The example "Shopping pictograms - Vector stencils library" was created using the ConceptDraw PRO diagramming and vector drawing software extended with the Pictorial infographics solution from the area "What is infographics" in ConceptDraw Solution Park.
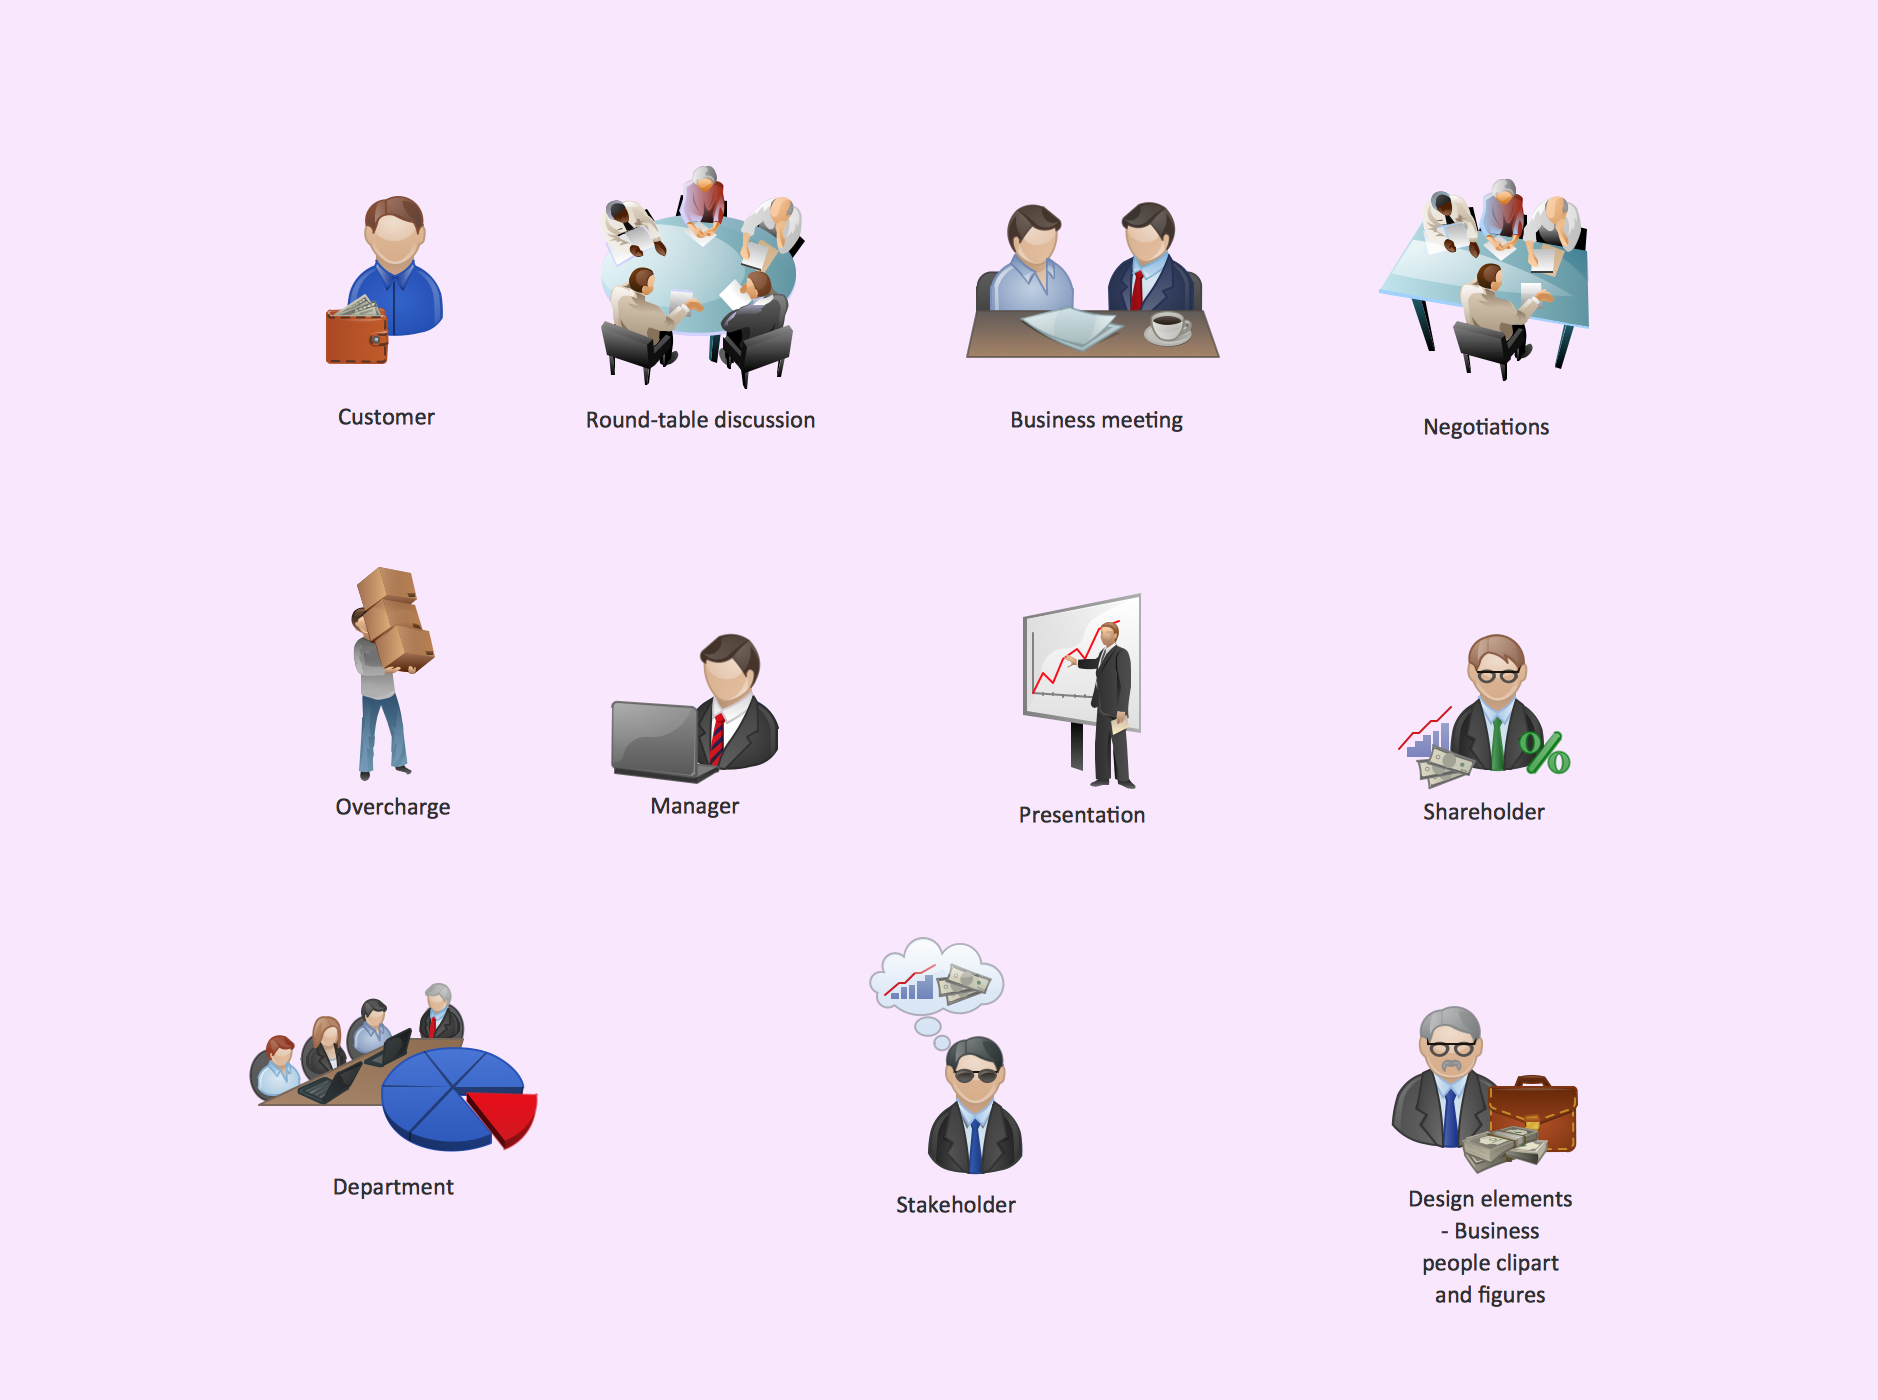
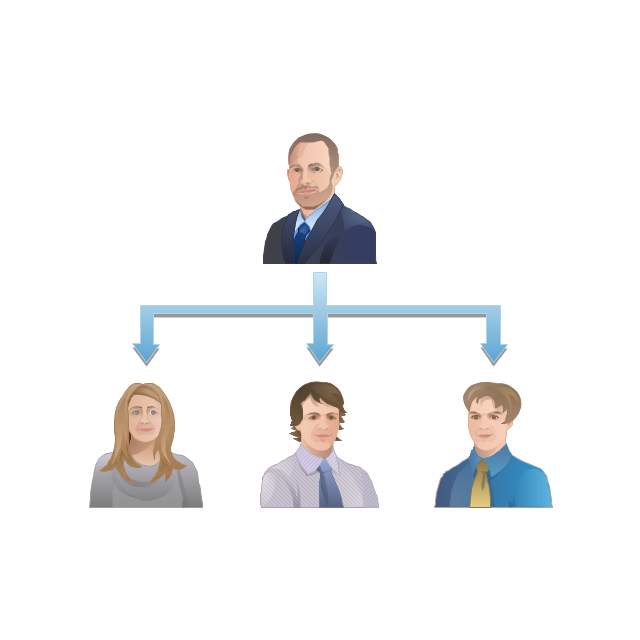
Business People Clipart
Business People Clipart - Business and Finance solution from Illustration area of ConceptDraw Solution Park. Use it to quick draw illustrations, diagrams and infographics for your business documents, presentations and websites. The vector stencils library Business People Clipart includes 12 images."An invoice, bill or tab is a commercial document issued by a seller to a buyer, relating to a sale transaction and indicating the products, quantities, and agreed prices for products or services the seller has provided the buyer.
Payment terms are usually stated on the invoice. These may specify that the buyer has a maximum number of days in which to pay, and is sometimes offered a discount if paid before the due date. The buyer could have already paid for the products or services listed on the invoice.
In the rental industry, an invoice must include a specific reference to the duration of the time being billed, so in addition to quantity, price and discount the invoicing amount is also based on duration. Generally each line of a rental invoice will refer to the actual hours, days, weeks, months, etc., being billed.
From the point of view of a seller, an invoice is a sales invoice. From the point of view of a buyer, an invoice is a purchase invoice. The document indicates the buyer and seller, but the term invoice indicates money is owed or owing. ...
Payment of invoices.
Organizations purchasing goods and services usually have a process in place for approving payment of invoices based on an employee's confirmation that the goods or services have been received.
Typically, when paying an invoice, a remittance advice will be sent to the supplier to inform them their invoice has been paid." [Invoice. Wikipedia]
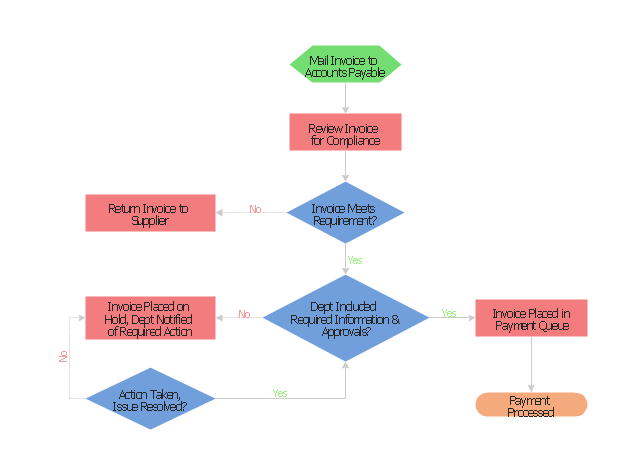
The flow chart example "Invoice payment process" was created using the ConceptDraw PRO diagramming and vector drawing software extended with the Flowcharts solution from the area "What is a Diagram" of ConceptDraw Solution Park.
"A credit card is a payment card issued to users as a system of payment. It allows the cardholder to pay for goods and services based on the holder's promise to pay for them. The issuer of the card creates a revolving account and grants a line of credit to the consumer (or the user) from which the user can borrow money for payment to a merchant or as a cash advance to the user." [Credit card. Wikipedia]
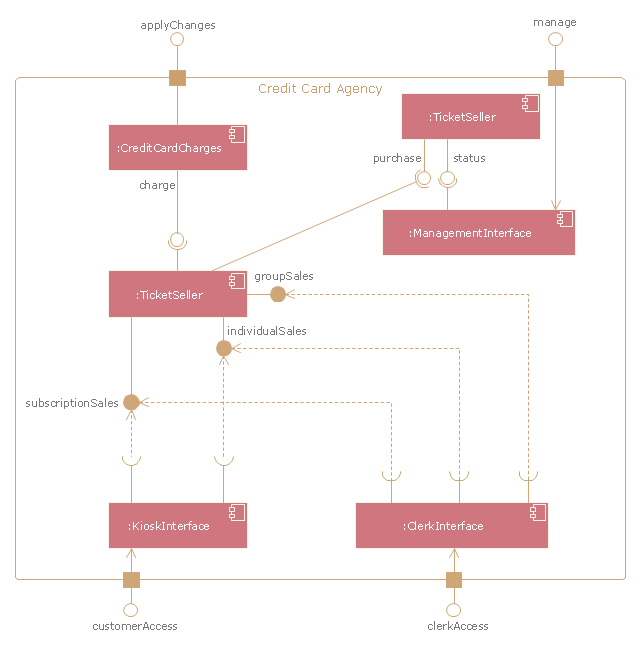
The UML component diagram example "Credit card agency" was created using the ConceptDraw PRO diagramming and vector drawing software extended with the Rapid UML solution from the Software Development area of ConceptDraw Solution Park.
The UML component diagram example "Credit card agency" was created using the ConceptDraw PRO diagramming and vector drawing software extended with the Rapid UML solution from the Software Development area of ConceptDraw Solution Park.
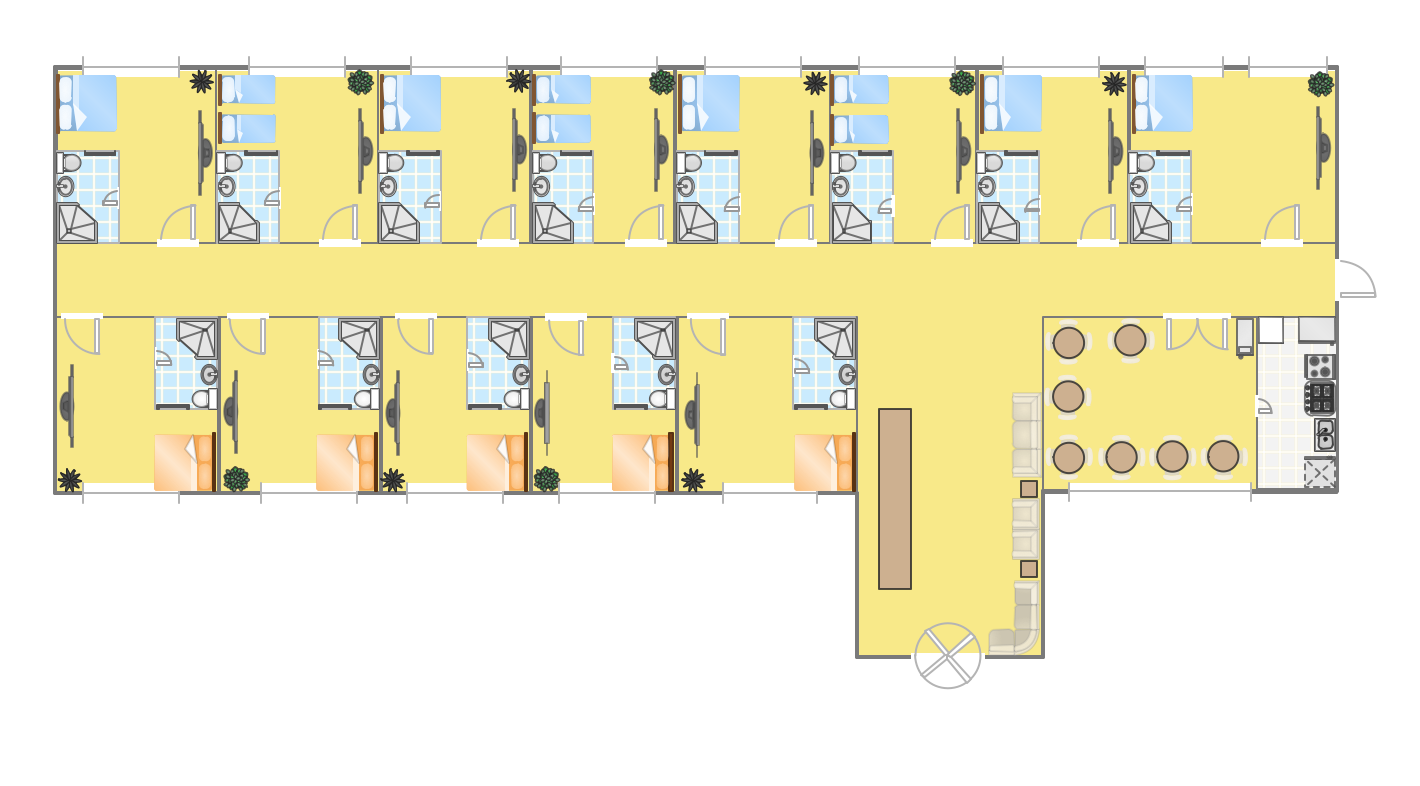
Hotel Plan. Hotel Plan Examples
The hotels vary hard enough by the rating, service level, cost, size, location, style, and many other parameters. Before beginning the construction of new hotel, inn or a hotel complex, you first need to create a detailed overall hotel plan, the location plans of rooms, lobby, restaurant and other common premises and service rooms. The projects of mini-hotels must use the space particularly rational, at the same time the large hotels can afford spacious halls, banquet halls and even terraces. ConceptDraw PRO diagramming and vector drawing software enhanced with Basic Floor Plans and Floor Plans solutions from the Building Plans area of ConceptDraw Solution Park offer the set of predesigned vector stencils libraries with large selection of symbols of interior design elements, furniture and equipment for easy drawing the Hotel plans, Hotel floor plans, Hotel design plans, Space layouts, Layouts of furniture and equipment, etc. The offered templates and Floor plan samples will be also useful for you.Project management - Design Elements
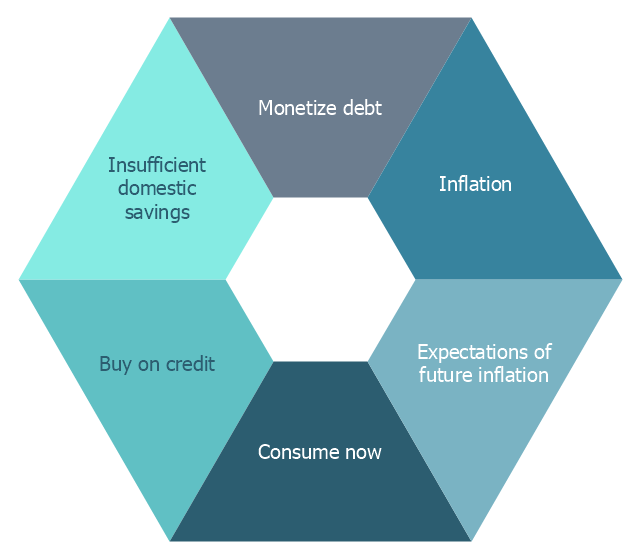
These vector illustrations and cliparts are created using ConceptDraw PRO for drawing the Project management Illustrations and contain plenty of project management design elements. The clipart library Project management includes 35 icons. This symbols used by the best marketing project management software, typically by project management reporting software for presentation on project status and results.This hexagon diagram sample was redesigned from the Wikipedia file: Vicious circle in macroeconomics.svg. "An example of the use of a vicious circle in macroeconomics." [en.wikipedia.org/ wiki/ File:Vicious_ circle_ in_ macroeconomics.svg]
"A virtuous circle and a vicious circle (also referred to as virtuous cycle and vicious cycle) are economic terms. They refer to a complex chain of events that reinforces itself through a feedback loop. A virtuous circle has favorable results, while a vicious circle has detrimental results.
Both circles are complexes of events with no tendency towards equilibrium (at least in the short run). Both systems of events have feedback loops in which each iteration of the cycle reinforces the previous one (positive feedback). These cycles will continue in the direction of their momentum until an external factor intervenes and breaks the cycle. The prefix "hyper-" is sometimes used to describe these cycles if they are extreme. The best-known example of a vicious circle is hyperinflation. ...
Example in macroeconomics.
Vicious circle.
Hyperinflation is a spiral of inflation which causes even higher inflation. The initial exogenous event might be a sudden large increase in international interest rates or a massive increase in government debt due to excessive spendings. Whatever the cause, the government could pay down some of its debt by printing more money (called monetizing the debt). This increase in the money supply could increase the level of inflation. In an inflationary environment, people tend to spend their money quickly because they expect its value to decrease further in the future. They convert their financial assets into physical assets while their money still has some purchasing power. Often they will purchase on credit. Eventually, the currency loses all of its value. Because of this, the level of savings in the country is very low and the government could have problems refinancing its debt. Its solution could be to print still more money starting another iteration of the vicious cycle." [Virtuous circle and vicious circle. Wikipedia]
The crystal diagram example "Vicious circle" was created using the ConceptDraw PRO diagramming and vector drawing software extended with the Target and Circular Diagrams solution from the Marketing area of ConceptDraw Solution Park.
www.conceptdraw.com/ solution-park/ marketing-target-and-circular-diagrams
Basic Flowchart Symbols and Meaning
Flowcharts are the best for visually representation the business processes and the flow of a custom-order process through various departments within an organization. ConceptDraw PRO diagramming and vector drawing software extended with Flowcharts solution offers the full set of predesigned basic flowchart symbols which are gathered at two libraries: Flowchart and Flowcharts Rapid Draw. Among them are: process, terminator, decision, data, document, display, manual loop, and many other specific symbols. The meaning for each symbol offered by ConceptDraw gives the presentation about their proposed use in professional Flowcharts for business and technical processes, software algorithms, well-developed structures of web sites, Workflow diagrams, Process flow diagram and correlation in developing on-line instructional projects or business process system. Use of ready flow chart symbols in diagrams is incredibly useful - you need simply drag desired from the libraries to your document and arrange them in required order. There are a few serious alternatives to Visio for Mac, one of them is ConceptDraw PRO. It is one of the main contender with the most similar features and capabilities.
The vector stencils library "Workflow diagrams" contains 54 symbol icons of workflow diagrams.
The workflow diagrams represent information flow, automation of business processes, business process re-engineering, accounting, management, and human resources tasks in industry, business, and manufacturing.
Use this library to draw workflow diagrams in the ConceptDraw PRO diagramming and vector drawing software extended with the Workflow Diagrams solution from the Business Processes area of ConceptDraw Solution Park.
www.conceptdraw.com/ solution-park/ business-process-workflow-diagrams
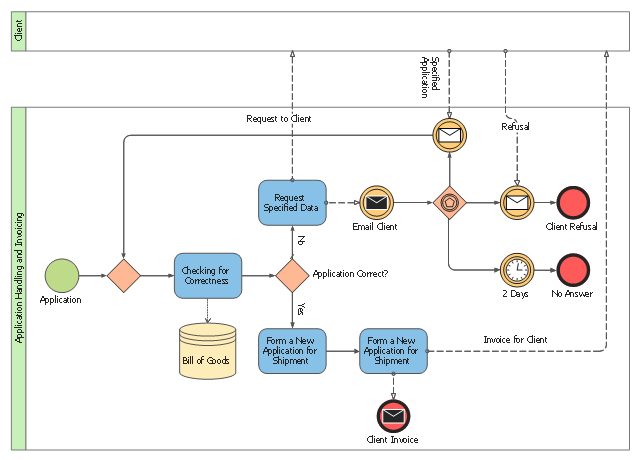
This BPMN (Business Process Model and Notation) collaboration diagram sample contains the collection of participants and their interaction throughout an application handling and invoicing process.
"An invoice, bill or tab is a commercial document issued by a seller to a buyer, relating to a sale transaction and indicating the products, quantities, and agreed prices for products or services the seller has provided the buyer.
Payment terms are usually stated on the invoice. These may specify that the buyer has a maximum number of days in which to pay, and is sometimes offered a discount if paid before the due date. The buyer could have already paid for the products or services listed on the invoice.
In the rental industry, an invoice must include a specific reference to the duration of the time being billed, so in addition to quantity, price and discount the invoicing amount is also based on duration. Generally each line of a rental invoice will refer to the actual hours, days, weeks, months, etc., being billed.
From the point of view of a seller, an invoice is a sales invoice. From the point of view of a buyer, an invoice is a purchase invoice. The document indicates the buyer and seller, but the term invoice indicates money is owed or owing." [Invoice. Wikipedia]
The business process modeling diagram example "Application handling and invoicing - Collaboration BPMN 2.0 diagram" was designed using the ConceptDraw PRO diagramming and vector drawing software extended with the Business Process Diagram solution from the Business Processes area of ConceptDraw Solution Park.
Easy Recipes
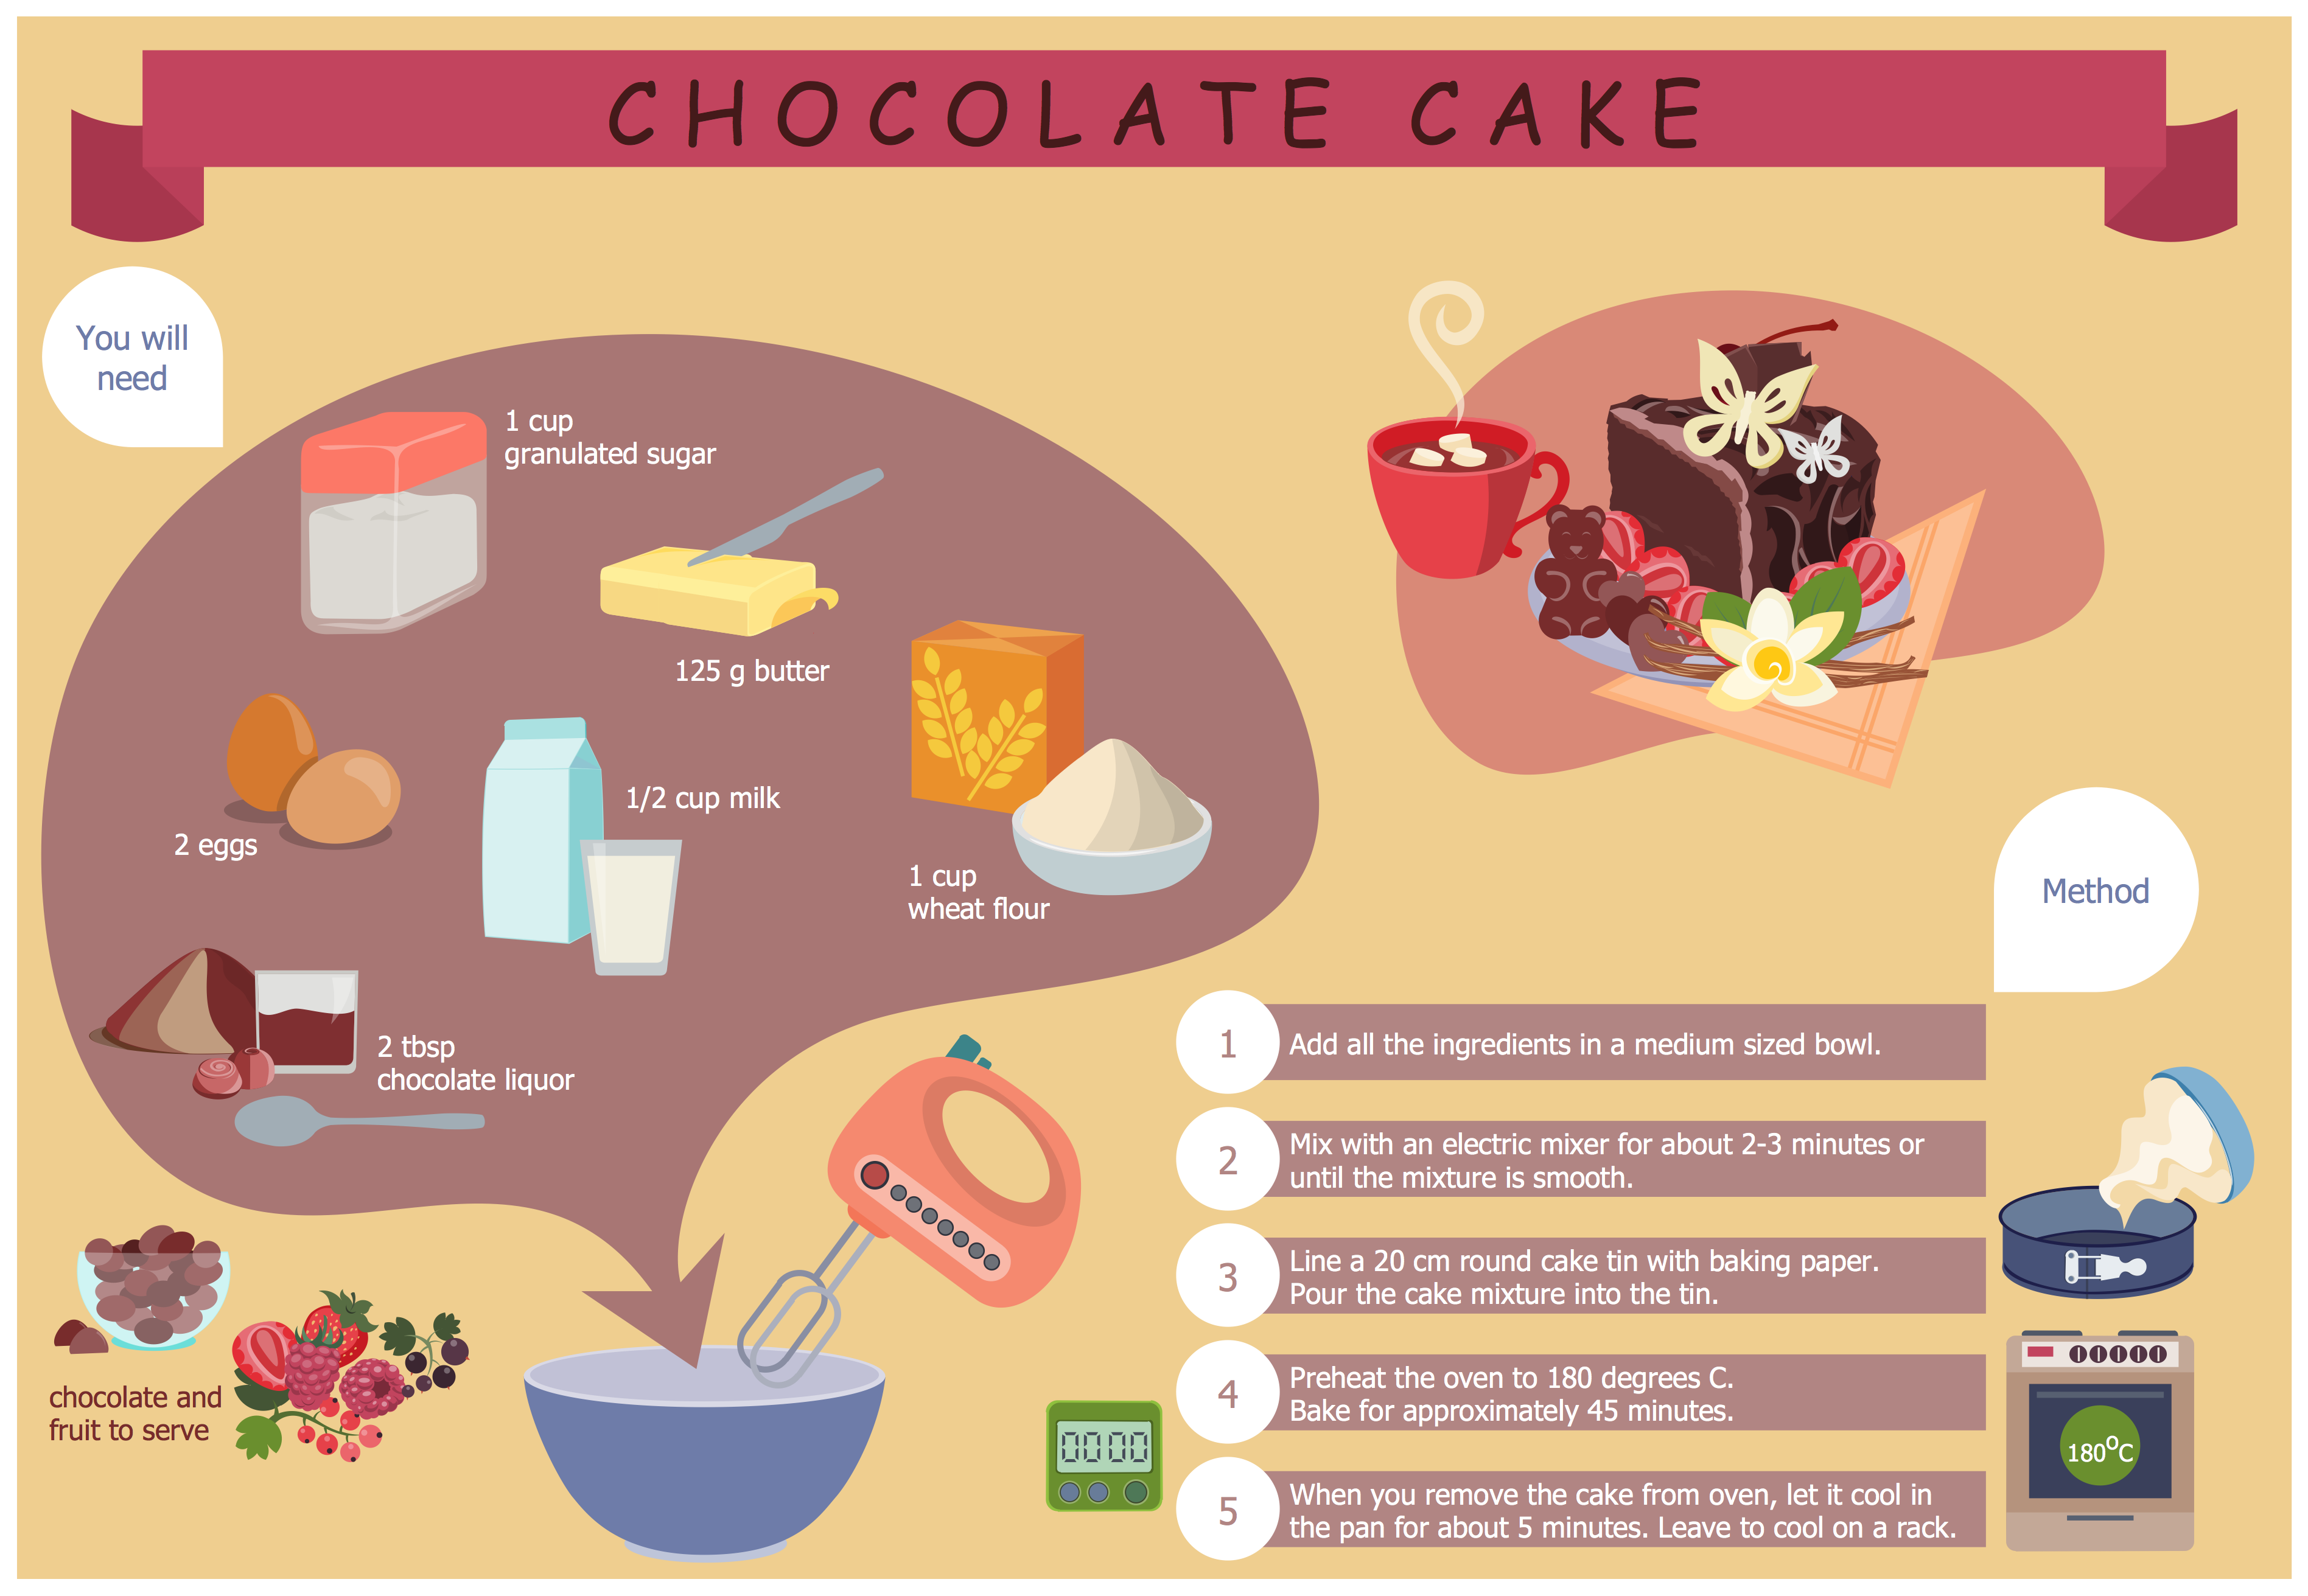
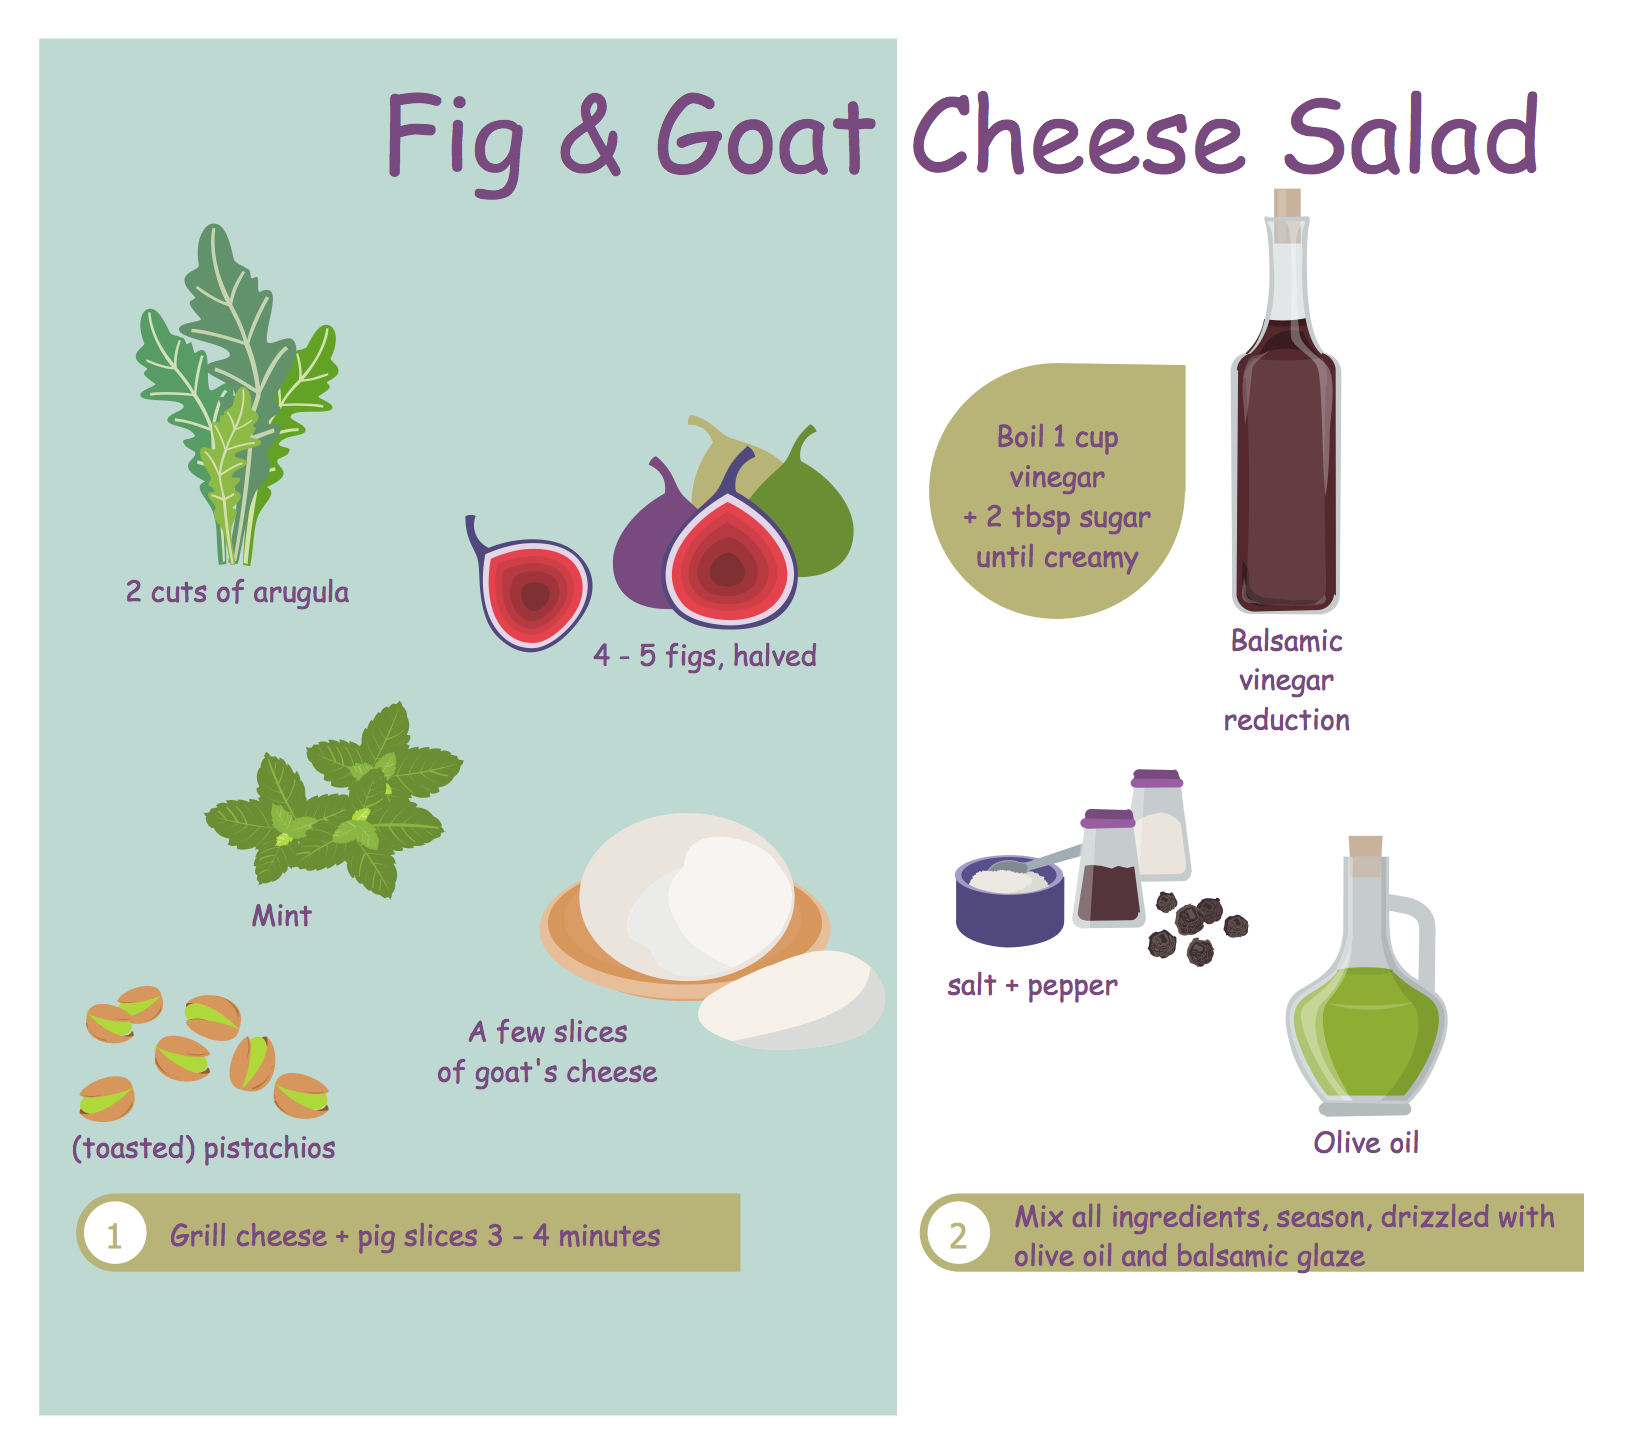
You want to decorate menu, design pictorial illustration for the cooking article in the fashionable magazine, create attractive posters for your cafe or restaurant, or develop beautiful advertising materials? In order to ideally cope with all these tasks, use the easy recipes design software - ConceptDraw PRO extended with Cooking Recipes solution from the Food and Beverage area of ConceptDraw Solution Park.Diagram of a Pyramid
Pyramid diagram is a convenient way of representing data hierarchical structure and visualization relationships between hierarchy levels. You need create the diagram of a pyramid? ConceptDraw diagramming and vector drawing software supplied with Pyramid Diagrams Solution from the Marketing Area of ConceptDraw Solution Park is the best tool for drawing attractive and successful diagram of a pyramid.Food Recipes
The food has great importance in human life, but it is very important that the food was tasty and salubrious. Preparing the food with help of different recipes from the fashion magazines, popular cookbooks, Internet cooking sites, we firstly pay attention to the recipe's design, how delicious and aesthetically the dish is presented on the picture. Use the ConceptDraw PRO diagramming and vector drawing software extended with Cooking Recipes solution from the Food and Beverage area of ConceptDraw Solution Park for easy design colorful and eye-catching food recipes illustrations.Example of DFD for Online Store (Data Flow Diagram) DFD Example
Data Flow Diagram (DFD) is a methodology of graphical structural analysis and information systems design, which describes the sources external in respect to the system, recipients of data, logical functions, data flows and data stores that are accessed. DFDs allow to identify relationships between various system's components and are effectively used in business analysis and information systems analysis. They are useful for system’s high-level details modeling, to show how the input data are transformed to output results via the sequence of functional transformations. For description of DFD diagrams are uses two notations — Yourdon and Gane-Sarson, which differ in syntax. Online Store DFD example illustrates the Data Flow Diagram for online store, the interactions between Customers, Visitors, Sellers, depicts User databases and the flows of Website Information. ConceptDraw PRO enhanced with Data Flow Diagrams solution lets you to draw clear and simple example of DFD for Online Store using special libraries of predesigned DFD symbols.
This interactive voice response (IVR) diagram sample illustrates the IVR services.
"IVR systems are typically intended to service high call volumes, reduce cost and improve the customer experience. Examples of typical IVR applications are telephone banking, televoting, and credit card services. ...
Voice-Activated Dialing
... (VAD) IVR systems are used to automate routine enquiries to switchboard or PABX (Private Automatic Branch eXchange) operators, and are used in many hospitals and large businesses to reduce the caller waiting time. ...
Entertainment and information.
Some of the largest installed IVR platforms are used for televoting on television game shows, ... which can generate enormous call spikes. Often, the network provider will have to deploy call gapping in the PSTN to prevent network overload. ...
Anonymous access.
IVR systems allow callers to obtain data relatively anonymously. Hospitals and clinics have used IVR systems to allow callers to receive anonymous access to test results. ...
Clinical trials.
IVR systems are used by pharmaceutical companies and contract research organizations to conduct clinical trials and manage the large volumes of data generated. ... Applications include patient randomization and drug supply management. ...
Outbound calling.
IVR systems can be used for outbound calls, as IVR systems are more intelligent than many predictive dialer systems, and can use Call Progress Detection to recognize different line conditions...
Other common IVR services include:
Mobile - Pay-As-You-Go account funding; registration; mobile purchases, such as ring tones and logos;
Banking - balance, payments, transfers, transaction history;
Retail & Entertainment - orders, bookings, credit & debit card payments;
Utilities - meter readings; account look-up, history and balance, payment, consumption history;
Travel — ticket booking, flight information, check-in;
Weather forecasts, water, road and ice conditions" [Interactive voice response. Wikipedia]
The IVR diagram example "IVR services" was created using the ConceptDraw PRO diagramming and vector drawing software extended with the Interactive Voice Response Diagrams solution from the Computer and Networks area of ConceptDraw Solution Park.
- Payment Vector Png
- Shopping pictograms - Vector stencils library | Shopping pictograms ...
- Pay Money Icon
- Pay Money Logo Vector
- Payment Card Vector
- Pay Vector Png
- Vector Pay Online
- Shopping pictograms - Vector stencils library | Picto Pay
- Money Vector Png
- Currency - Vector stencils library | Money - Design Elements ...
- Credit Card Pay Vector
- Finance - Vector stencils library | Currency - Vector stencils library ...
- Shopping pictograms - Vector stencils library | Money - Design ...
- Shopping pictograms - Vector stencils library | Fishbone Diagrams ...
- Currency - Vector stencils library | Currency - Design Elements ...
- Credit Card Order Process Flowchart. Flowchart Examples | Money ...
- Currency - Vector stencils library | Money - Design Elements | Sales ...
- Money - Design Elements | Advertising - Design Elements ...
- Money - Design Elements | UML component diagram - Credit card ...
- Shopping pictograms - Vector stencils library | Shopping pictograms ...
