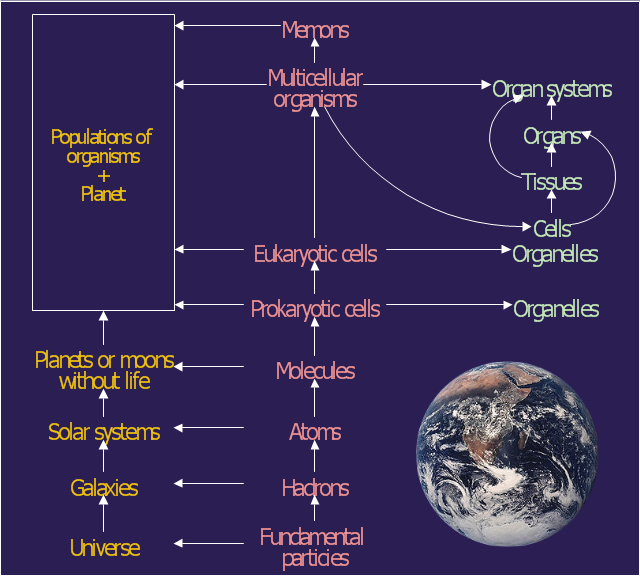
This diagram example was redesigned from the Wikimedia Commons file: Operator hierarchy - natural hierarchy rearranged.gif.
The diagram shows rearrangement of the classical ecological/ system hierarchy. From left to right the columns represent interaction systems, operators and internal differentiations (Gerard Jagers op Akkerhuis).
The diagram was published at page 249 of Jagers op Akkerhuis, G.A.J.M. (2010). The operator hierarchy: a chain of closures linking matter, life and artificial intelligence. PhD thesis Radboud university Nijmegen, the Netherlands: 286 pp.
[commons.wikimedia.org/ wiki/ File:Operator_ hierarchy_ -_ natural_ hierarchy_ rearranged.gif]
The astronomic diagram example "Operator hierarchy - Natural hierarchy rearranged" was created using the ConceptDraw PRO diagramming and vector drawing software extended with the Astronomy solution from the Science and Education area of ConceptDraw Solution Park.
Astronomy Pictures
Every day astronomers of the whole world and astronomy-related people draw wide variety of astronomy pictures, make the photos of various astronomic events, solar and planets activities. ConceptDraw DIAGRAM diagramming and vector drawing software extended with Astronomy solution from the Science and Education area is the best choice for astronomy specialists. It gives the possibility to design professional looking astronomy pictures in a few minutes.
 Astronomy
Astronomy solution extends ConceptDraw DIAGRAM software with illustration and sketching software with templates, samples and libraries of a variety of astronomy symbols, including constellations, galaxies, stars, and planet vector shapes; a whole host of cele
Illustration Software
No science can't exist without illustrations, and especially astronomy! Illustrations help to visualize knowledge, natural phenomenons which are studied by astronomy, they equally effective help in work, during the learning process and on the conferences. Now we have professional astronomy illustration software - ConceptDraw DIAGRAM illustration and sketching software with templates, samples and libraries of a variety of astronomy symbols, including constellations, galaxies, stars, and planet vector shapes; a whole host of celestial bodies. When drawing scientific and educational astronomy illustrations, astronomy pictures and diagrams, can help you reach for the stars!Organizational Charts with ConceptDraw DIAGRAM
Organizational chart or Orgchart is a diagram that depicts the structure of an organization using the terms of work responsibility and rank position. It is a useful and convenient format to visually illustrate the relationships within an organization, which is moreover applicable for organization of any size. Typically, an Organizational chart is constructed from the rectangular object blocks, which represent a job title, a person's name and relationships associated with them. You looks for the powerful Orgchart software? ConceptDraw DIAGRAM software is exactly what you've been searching long. Extended with Organizational Charts Solution, ConceptDraw DIAGRAM offers great-looking examples and samples of Orgcharts, built-in templates and various types of predesigned vector block objects and connectors for creation all kinds of Organizational Charts - from simple to complex multi-page. When designing the chart for large organization with complex branched structure, may be convenient to divide it into few smaller charts.Pyramid Chart Examples
Pyramid Charts and Triangle Diagrams are used to visually structure the topics and progressively order the quantitative data. They allow to illustrate hierarchical structure of the topics, proportional, interconnected and containment relations among the topics. The multilevel Pyramids and Triangle diagrams are constructed oriented up or down and divided into several horizontal slices. They are effectively used to represent marketing strategies, social strategies, information systems, market value, etc., to illustrate presentations, websites, documents, reports in business, finances, sales, management, marketing, media, training, consulting, and many other fields. To maximize the efficiency in drawing the Pyramid Charts, use the ConceptDraw DIAGRAM diagramming and vector drawing software extended with Pyramid Diagrams solution from Marketing area, which contains the set of Pyramid Chart examples, samples, templates and vector design elements of triangular diagrams and pyramids with different quantity of levels for various needs.- Operator hierarchy - Natural hierarchy rearranged | Astronomy ...
- Operator hierarchy - Natural hierarchy rearranged
- Operator hierarchy - Natural hierarchy rearranged | IVR systems ...
- Hierarchical Network Topology | Venn Diagram Examples for ...
- Basic Diagramming | Venn Diagram Examples for Problem Solving ...
- COM and OLE Diagram | How to Create a Concept Map in ...
- Classification Of Natural Resources With Examples Flow Chart
- Venn Diagram Examples for Problem Solving. Computer Science ...
- Security and Access Plans | Process Flow Diagram | Activity ...
- Pyramid Chart Examples | Energy Pyramid Diagram | Diagram of a ...
- And Operator
- Venn Diagram Examples for Problem Solving. Computer Science ...
- Languages of South America - Thematic map | The most spoken ...
- Natural Resource And Development Flow Chart
- Venn Diagram Examples for Problem Solving. Computer Science ...
- Interactive Voice Response Diagrams | Telephone Operator Flow ...
- Languages of South America - Thematic map | SDL — Systems ...
- Energy resources diagram | Resources and energy - Vector stencils ...
- Resources and energy - Vector stencils library | Energy resources ...
- Venn Diagram Examples for Problem Solving. Computer Science ...


