 ConceptDraw Solution Park
ConceptDraw Solution Park collects graphic extensions, examples and learning materials
 Event-driven Process Chain Diagrams
Event-Driven Process Chain Diagrams solution extends ConceptDraw DIAGRAM functionality with event driven process chain templates, samples of EPC engineering and modeling the business processes, and a vector shape library for drawing the EPC diagrams and EPC flowcharts of any complexity. It is one of EPC IT solutions that assist the marketing experts, business specialists, engineers, educators and researchers in resources planning and improving the business processes using the EPC flowchart or EPC diagram. Use the EPC solutions tools to construct the chain of events and functions, to illustrate the structure of a business process control flow, to describe people and tasks for execution the business processes, to identify the inefficient businesses processes and measures required to make them efficient.
 Business Process Diagrams
Business Process Diagrams solution extends the ConceptDraw DIAGRAM BPM software with RapidDraw interface, templates, samples and numerous libraries based on the BPMN 1.2 and BPMN 2.0 standards, which give you the possibility to visualize equally easy simple and complex processes, to design business models, to quickly develop and document in details any business processes on the stages of project’s planning and implementation.
 Cross-Functional Flowcharts
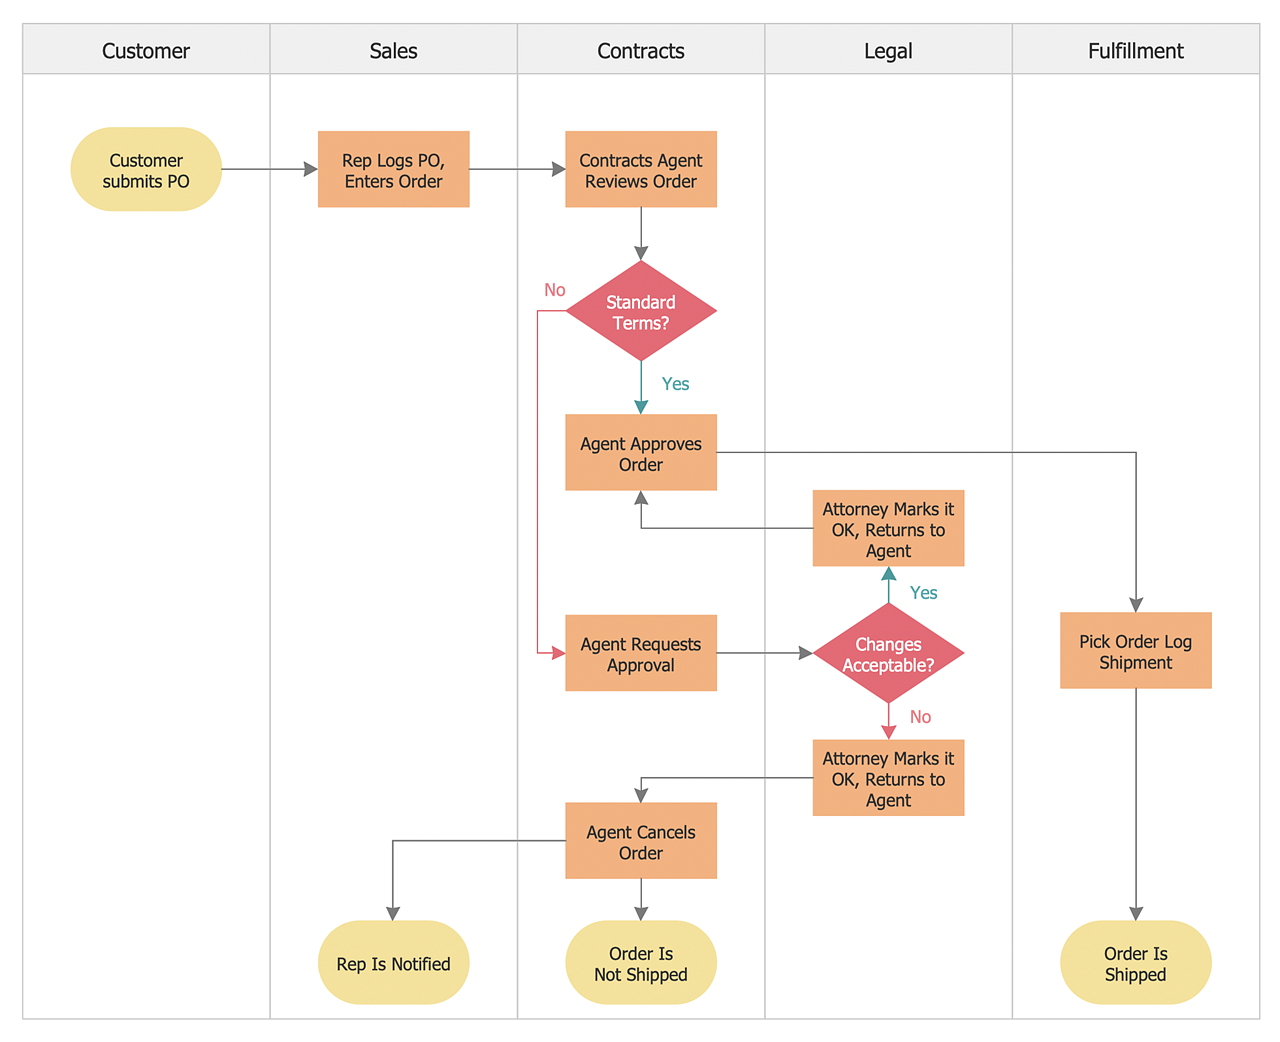
Cross-functional flowcharts are powerful and useful tool for visualizing and analyzing complex business processes which requires involvement of multiple people, teams or even departments. They let clearly represent a sequence of the process steps, the order of operations, relationships between processes and responsible functional units (such as departments or positions).
Software development with ConceptDraw DIAGRAM
Modern software development requires creation of large amount of graphic documentation, these are the diagrams describing the work of applications in various notations and cuts, also GUI design and documentation on project management. ConceptDraw DIAGRAM technical and business graphics application possesses powerful tools for software development and designing technical documentation for object-oriented projects. Solutions included to the Software Development area of ConceptDraw Solution Park provide the specialists with possibility easily and quickly create graphic documentation. They deliver effective help in drawing thanks to the included package of templates, samples, examples, and libraries with numerous ready-to-use vector objects that allow easily design class hierarchies, object hierarchies, visual object-oriented designs, flowcharts, GUI designs, database designs, visualize the data with use of the most popular notations, including the UML and Booch notations, easy manage the development projects, automate projection and development.HelpDesk
How to Simplify Flow Charting on Mac
A flowchart is a great way to present any complex process in a simple to understand manner. A flowchart is perhaps the most common form of diagrams used in both technical and social fields. Since a flowchart is a method that allows describing visually any consequent process, it can be used to show the flow of logic of any process. In ConceptDraw DIAGRAM it really is simple to draw even the most complex flowcharts. Use RapidDraw technology for the best results.HelpDesk
How to Create a Cross-Functional Flowchart
Cross-functional flowcharts are used to visualize cross-functional processes. A cross-functional process is a process that involves multiple divisions, each of which makes its part of the entire company workflow. For example product development, lead management, client orders processing – and other critical processes. All of them are important both for business and customers, but the workflow and responsibilities distribution within these processes are divided between multiple departments and services. Cross-functional processes cannot be depicted with simple workflow diagrams, because of the specific interactions between company departments. ConceptDraw DIAGRAM has released a specialized solution to create cross-functional diagrams. Cross-Functional Flowcharts solution includes a special set of templates and libraries to depict the cross-functional processes.
 Accounting Flowcharts
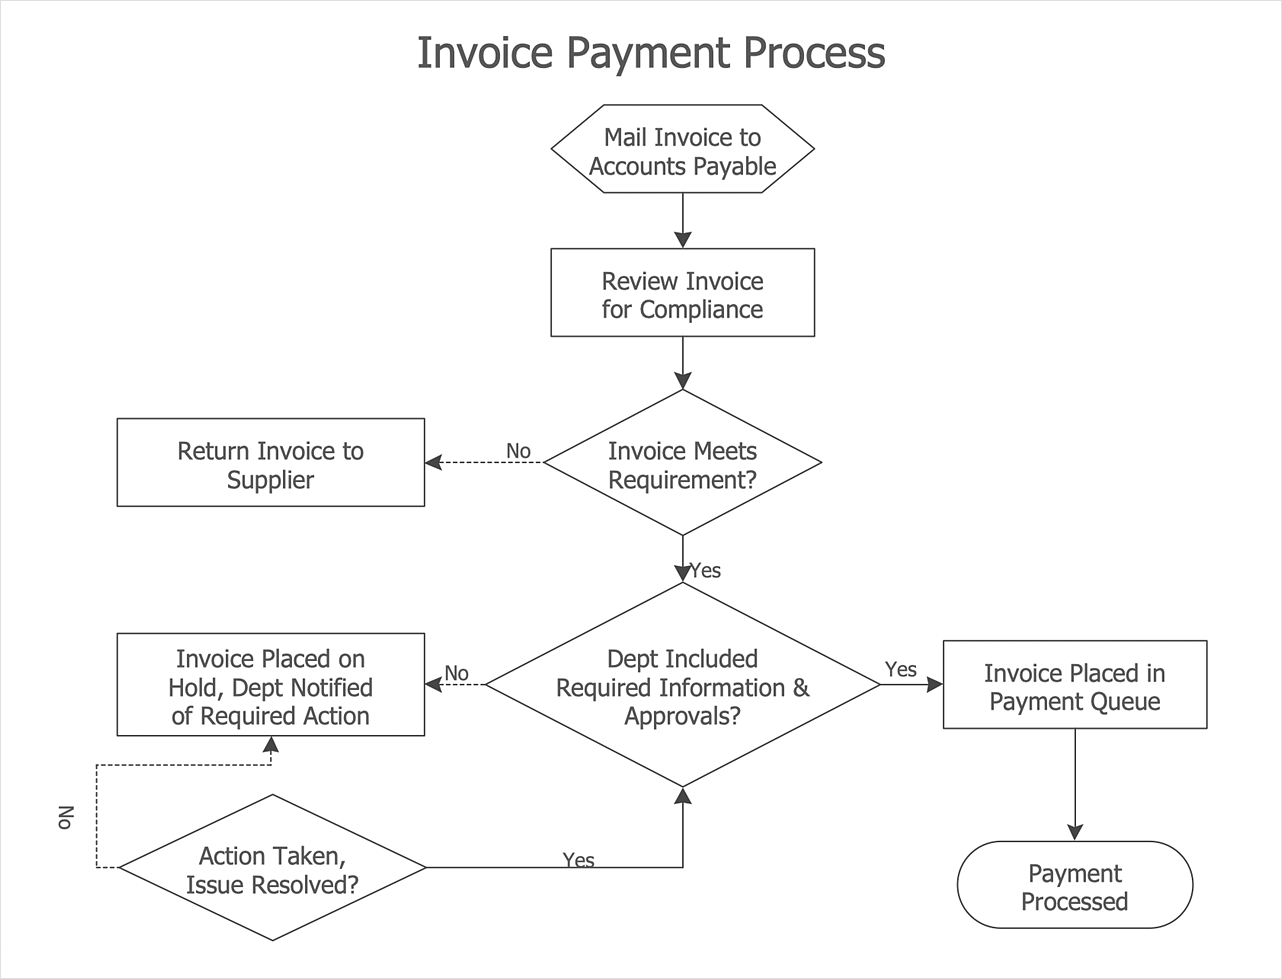
Accounting Flowcharts solution extends ConceptDraw DIAGRAM software with templates, samples and library of vector stencils for drawing the accounting flow charts.
- Business process Flow Chart
- Business Development Process Flowchart
- New Product Development Process Flowchart Sample
- An Example Of A Business Development Flowchart
- New Product Development Process Flowchart
- Cross-Functional Flowcharts | Process Flowchart | Accounting ...
- New Product Development Flow Chart
- Flow Chart For Development And Release Of New Product
- Product Development Process Flowchart
- Swot Analysis For Business Development Department
- Process Flowchart | Data Flow Diagram Software | Data Flow ...
- Swim Lane Diagrams | Cross-Functional Flowchart (Swim Lanes ...
- Product Development Flow Chart
- Basic Flowchart Symbols and Meaning | Process Flowchart ...
- Software Development Process Flow Diagram
- Business To Business Process Flow Chart Pdf
- Project timeline diagram - New business project plan | Timeline ...
- Business Process Reengineering Examples | BPR Diagram ...
- Organizational Structure | Process Flowchart


