Basic Flowchart Symbols and Meaning
Flowcharts are the best for visually representation the business processes and the flow of a custom-order process through various departments within an organization. ConceptDraw PRO diagramming and vector drawing software extended with Flowcharts solution offers the full set of predesigned basic flowchart symbols which are gathered at two libraries: Flowchart and Flowcharts Rapid Draw. Among them are: process, terminator, decision, data, document, display, manual loop, and many other specific symbols. The meaning for each symbol offered by ConceptDraw gives the presentation about their proposed use in professional Flowcharts for business and technical processes, software algorithms, well-developed structures of web sites, Workflow diagrams, Process flow diagram and correlation in developing on-line instructional projects or business process system. Use of ready flow chart symbols in diagrams is incredibly useful - you need simply drag desired from the libraries to your document and arrange them in required order. There are a few serious alternatives to Visio for Mac, one of them is ConceptDraw PRO. It is one of the main contender with the most similar features and capabilities.
Electrical Diagram Software
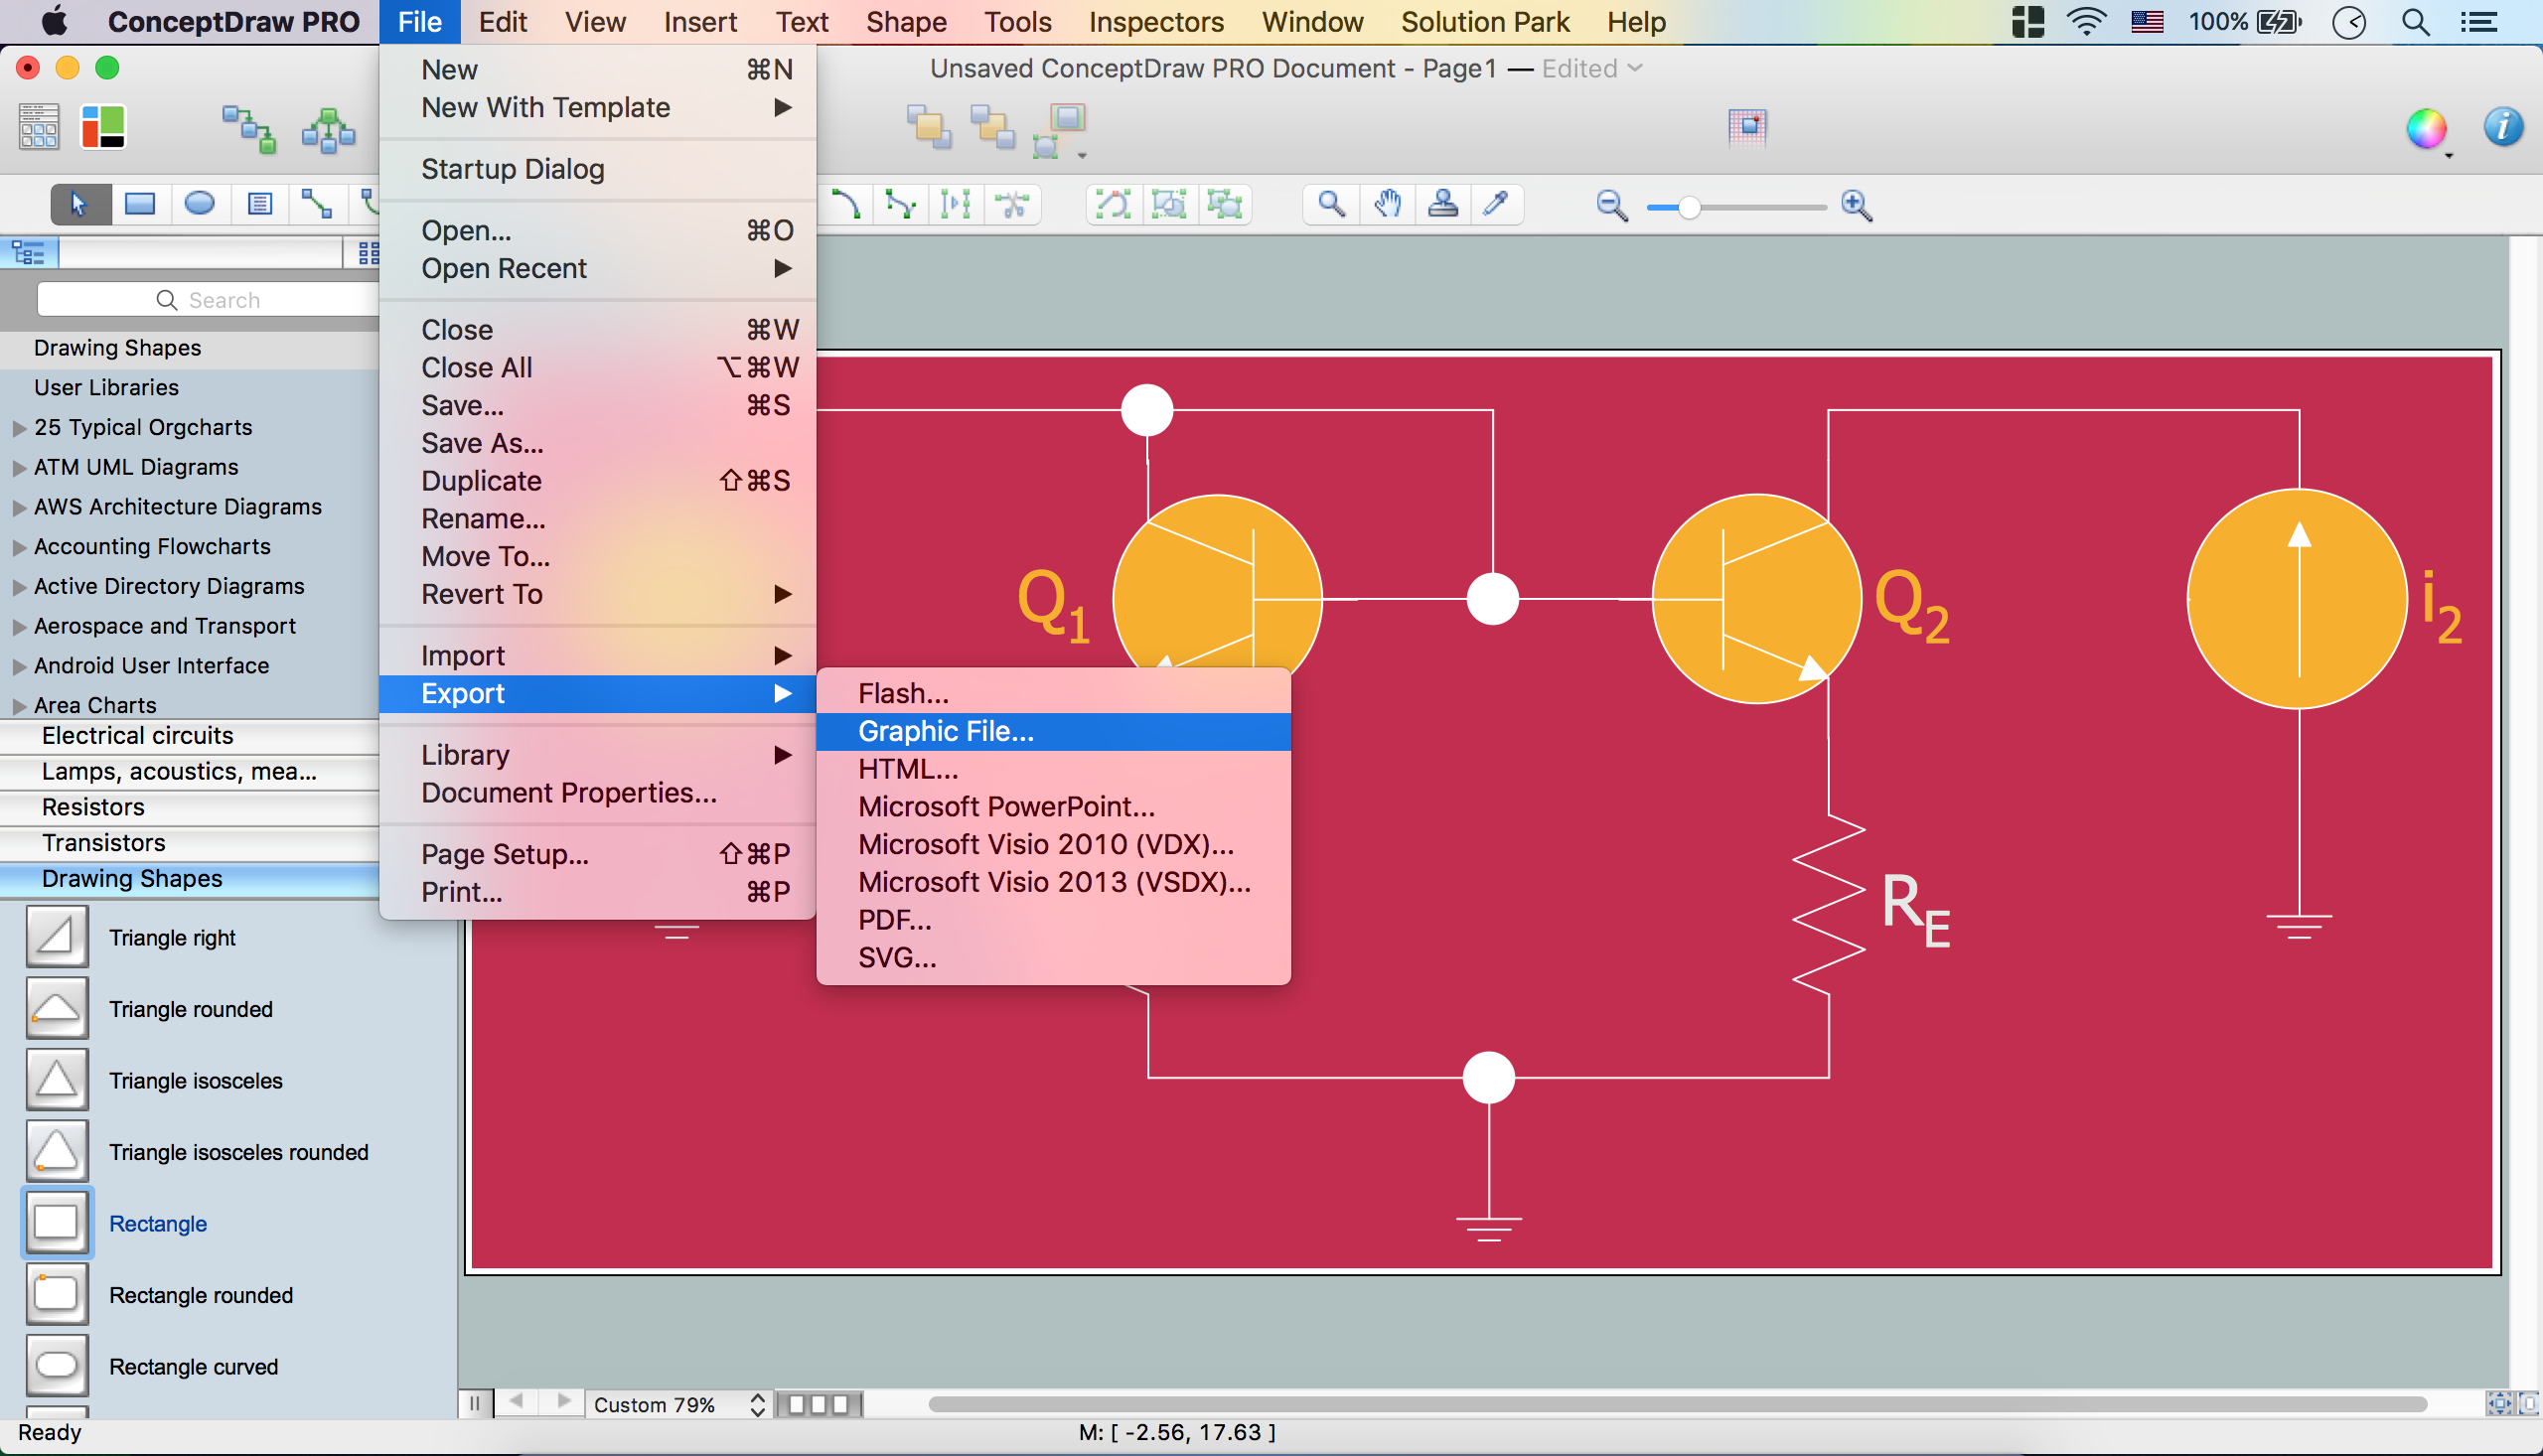
Electrical engineering and electronic engineering are extensive fields dedicated to research, design, development, manufacturing, test, and montage of systems and devices of electricity, electronics, microelectronics, telecommunications, power engineering, etc. These fields use various types of schemes, diagrams, technical drawings and require a special precision, accuracy and attention at their construction and using. The availability of modern specialized software has great importance for electrical engineers and electronic specialists, it assists them in drawing Electrical schematics and diagrams, Electrical drawings and Wiring schemes, Electronic Circuit schematics, etc. One of such software is ConceptDraw PRO extended with Electrical Engineering Solution that offers powerful drawing tools, wide variety of samples and libraries with numerous quantity of predesigned electrical symbols and vector objects of electrical devices. All they help design with minimal efforts Electrical diagrams and blueprints of any complexity, now drawing process is easy even for beginners.
IDEF0 Flowchart Symbols
The modeling of business and business processes is not quite a simple process for both small-size businesses and large businesses. The IDEF0 method is one of the popular and easy methods of modeling the business as a complex system. It is based on the functional modeling language Structured Analysis and Design Technique (abbr. SADT) and is concentrated on the activity modeling. According to this method are constructed the IDEF0 Diagrams and IDEF0 Flowcharts, which are succesfully used not only for documenting the business, but also for analysis, development, integration of information and software systems, reengineering, etc. This method suggests the use of special IDEF0 Flowchart Symbols from the IDEF0 notation for construction the IDEF0 Flowcharts. ConceptDraw PRO diagramming and vector graphic software extended with IDEF0 Diagrams solution from the Software Development area of ConceptDraw Solution Park is rich for the powerful drawing tools, built-in templates and samples, and predesigned IDEF0 flowchart symbols.Security Plans
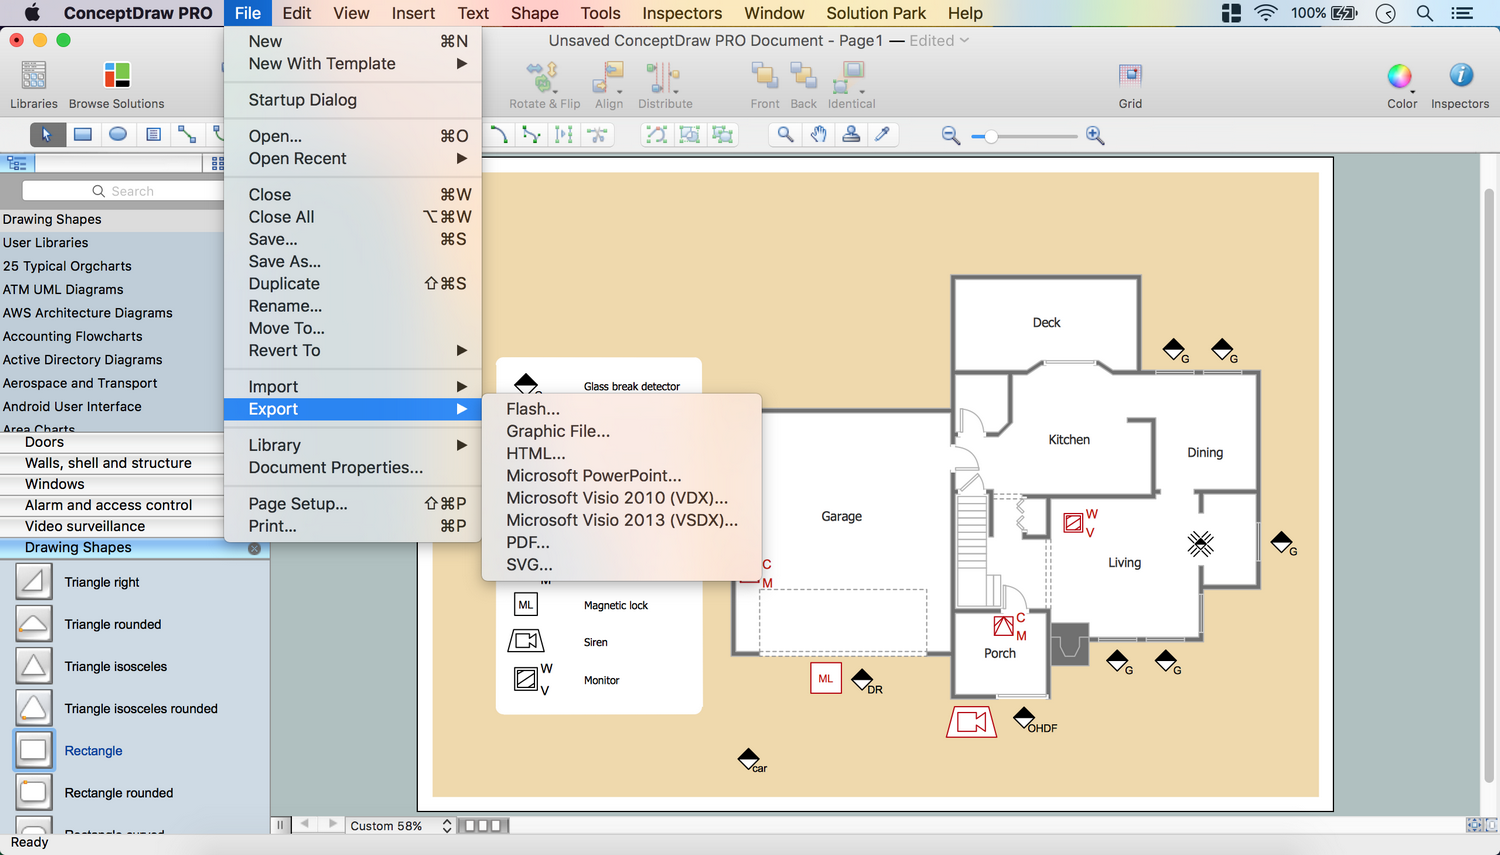
No security system cannot be constructed without detailed security plan, or even a set of plans in some cases. ConceptDraw PRO software offers the Security and Access Plans Solution from the Building Plans Area to help you design the Security Plans for any premises and of any complexity.How to Create a Pyramid Diagram
ConceptDraw Pyramid Diagram software allows drawing column charts using predesigned objects or drawing tools. In ConceptDraw Pyramid Diagram software you can find a complete set of column chart tools and objects.Process Flowchart
The main reason of using Process Flowchart or PFD is to show relations between major parts of the system. Process Flowcharts are used in process engineering and chemical industry where there is a requirement of depicting relationships between major components only and not include minor parts. Process Flowcharts for single unit or multiple units differ in their structure and implementation. ConceptDraw PRO is Professional business process mapping software for making Process flowcharts, Process flow diagram, Workflow diagram, flowcharts and technical illustrations for business documents and also comprehensive visio for mac application. Easier define and document basic work and data flows, financial, production and quality management processes to increase efficiency of your business with ConcepDraw PRO. Business process mapping software with Flowchart Maker ConceptDraw PRO includes extensive drawing tools, rich examples and templates, process flowchart symbols and shape libraries, smart connectors that allow you create the flowcharts of complex processes, process flow diagrams, procedures and information exchange. Process Flowchart Solution is project management workflow tools which is part ConceptDraw Project marketing project management software. Drawing charts, diagrams, and network layouts has long been the monopoly of Microsoft Visio, making Mac users to struggle when needing such visio alternative like visio for mac, it requires only to view features, make a minor edit to, or print a diagram or chart. Thankfully to MS Visio alternative like ConceptDraw PRO software, this is cross-platform charting and business process management tool, now visio alternative for making sort of visio diagram is not a problem anymore however many people still name it business process visio tools.
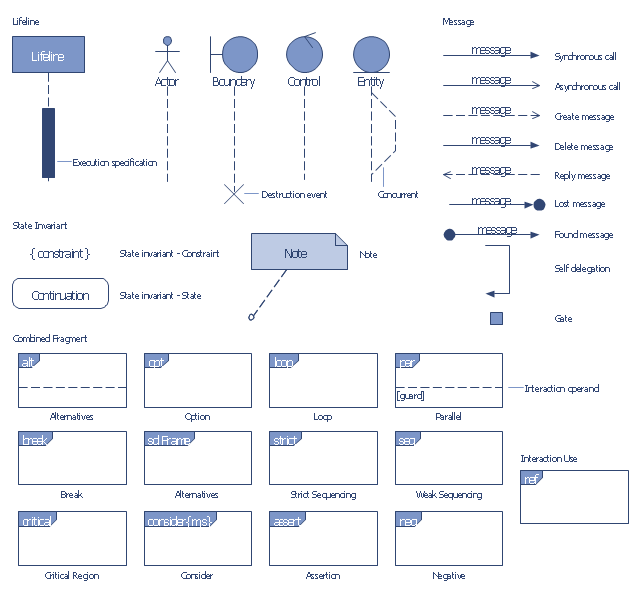
The vector stencils library "Bank UML sequence diagram" contains 34 shapes for drawing UML sequence diagrams.
Use it for object-oriented modeling of your bank information system.
"A sequence diagram shows, as parallel vertical lines (lifelines), different processes or objects that live simultaneously, and, as horizontal arrows, the messages exchanged between them, in the order in which they occur. This allows the specification of simple runtime scenarios in a graphical manner.
Diagram building blocks.
If the lifeline is that of an object, it demonstrates a role. Leaving the instance name blank can represent anonymous and unnamed instances.
Messages, written with horizontal arrows with the message name written above them, display interaction. Solid arrow heads represent synchronous calls, open arrow heads represent asynchronous messages, and dashed lines represent reply messages. ...
Activation boxes, or method-call boxes, are opaque rectangles drawn on top of lifelines to represent that processes are being performed in response to the message (ExecutionSpecifications in UML).
Objects calling methods on themselves use messages and add new activation boxes on top of any others to indicate a further level of processing.
When an object is destroyed (removed from memory), an X is drawn on top of the lifeline, and the dashed line ceases to be drawn below it ...
A message sent from outside the diagram can be represented by a message originating from a filled-in circle (found message in UML) or from a border of the sequence diagram (gate in UML)." [Sequence diagram. Wikipedia]
This example of UML sequence diagram symbols for the ConceptDraw PRO diagramming and vector drawing software is included in the ATM UML Diagrams solution from the Software Development area of ConceptDraw Solution Park.
Sales Steps
Helps to create professionally looking and detailed Sales Flowcharts with all sales steps visually represented on them. Use the Sales Flowcharts Solution for ConceptDraw PRO software to create your own Sales Flowcharts of any complexity quickly, easily and effectively to use them successfully in your work activity. ConceptDraw PRO diagramming and vector drawing software supplied with unique Sales Flowcharts solution from the Marketing area of ConceptDraw Solution Park allows fast and easy visualize all sales steps of the sales process on a sales process Map or sales process flowchart, and then realize them easily.The vector stencils library "Cabinets and bookcases" contains 41 vector shapes for drawing floor plans.
"A cabinet is a box-shaped piece of furniture with doors or drawers for storing miscellaneous items. Some cabinets stand alone while others are built into a wall or are attached to it... Cabinets are typically made of wood or, now increasingly, of synthetic materials. Commercial grade cabinets, which differ in the materials used, are called casework.
Cabinets usually have one or more doors on the front, which are mounted with door hardware, and occasionally a lock. Many cabinets have doors and drawers or only drawers. Short cabinets often have a finished surface on top that can be used for display, or as a working surface" [Cabinetry. Wikipedia]
Use the design elements library "Cabinets and bookcases" to draw the office furniture and equipment layout plans using the ConceptDraw PRO diagramming and vector drawing software. The shapes library "Cabinets and bookcases" is included in the Office Layout Plans solution from Building Plans area of ConceptDraw Solution Park.
How to Draw EPC Diagram Quickly
An event-driven process chain diagram is a flowchart used in business process analysis. It evolved from Architecture of Integrated Information Systems (ARIS) and utilised in the business process improvement and analysis. It is also used to facilitate enterprise resource planning. An EPC diagram is a complex flowchart that shows different business processes through various workflows. The workflows are seen as functions and events that are connected by different teams or people, as well as tasks that allow business processes to be executed. ConceptDraw PRO is a software for making EPC diagrams that allows managers visually present business process models for making decisions for business.
Swim Lane Flowchart Symbols
Use the set of special professionally developed swim lane flowchart symbols - single, multiple, vertical and horizontal lanes from the Swimlanes and Swimlanes BPMN 1.2 libraries from the Business Process Diagram solution, the Swim Lanes library from the Business Process Mapping solution as the perfect basis for your Swim Lane Flowcharts of processes, algorithms and procedures.Business Process Workflow Diagram
Business Process Workflow Diagram is a professional visual tool that is widely applied for business development, business analysis, business process optimization and documenting business processes. Business Process Workflow Diagram lets depict in details the steps of business processes and flow of tasks between them, the execution of business processes, transfer of data and documents. The workflows on the Business Process Workflow Diagram are represented using the set of common symbols which let easy illustrate business processes and process flows, depict the start, all major steps and end of the process, what data are used by the process, how the data flow through the business areas within scope of our project, how the tasks are executed and by who, and how workers interact with each other.
- Cisco Multimedia, Voice, Phone. Cisco icons, shapes , stencils and ...
- Cisco Multimedia, Voice, Phone. Cisco icons, shapes , stencils and ...
- VoIP call with SIM box and gateway | Flowchart design. Flowchart ...
- Cisco Multimedia, Voice, Phone. Cisco icons, shapes , stencils and ...
- Cisco Multimedia, Voice, Phone. Cisco icons, shapes , stencils and ...
- Cisco Media. Cisco icons, shapes , stencils and symbols | Design ...
- Design elements - Video surveillance | Cisco Multimedia, Voice ...
- Interactive Voice Response Diagrams | Cisco Multimedia, Voice ...
- Cisco Multimedia, Voice, Phone. Cisco icons, shapes , stencils and ...
- Cisco Media. Cisco icons, shapes , stencils and symbols | Media ...
- Electrical Symbols — Stations | Cisco Products Additional. Cisco ...
- Design elements - Video surveillance | Cisco Network Design. Cisco ...
- Cisco Products Additional. Cisco icons, shapes , stencils and symbols
- Fully Connected Network Topology Diagram | Cisco Routers. Cisco ...
- Basic Flowchart Symbols and Meaning | UML Diagram | Cisco LAN ...
- Cisco Multimedia, Voice, Phone. Cisco icons, shapes , stencils and ...
- A Flowchart Connecting Boxes With Arrows
- Motorola - Vector stencils library | Winter Sports | Cisco Network ...
- Flowchart design. Flowchart symbols, shapes , stencils and icons ...
- Television networks. Computer and Network Examples | Design ...


