Organic Chemistry Symbols
ConceptDraw PRO diagramming and vector drawing software extended with Chemistry solution from the Science and Education area of ConceptDraw Solution Park is effective for drawing various organic chemistry schemes, diagrams, illustrations thanks to the included collection of predesigned organic chemistry symbols.Chemistry Drawing Software
ConceptDraw PRO extended with Chemistry solution from the Science and Education area is a powerful chemistry drawing software that provides the useful tools to help you design all kinds of chemistry drawings and illustrations, chemical schemes and diagrams of formulas, reaction schemes and lab set-ups of any complexity.Chemistry Symbols and Meanings
Chemistry solution offers 5 libraries with large collection of vector chemistry symbols and meanings, chemistry equation symbols, organic chemistry symbols, and chemical clipart: Chemical Elements Library, Chemical Drawings Library, Conformations Library, Laboratory Equipment Library, Periodic Table of Chemical Elements Library.Chemistry Equation Symbols
If you are related with chemistry in you work or education activity, you need often draw various illustrations with chemistry equations. ConceptDraw PRO diagramming and vector drawing software offers you the Chemistry solution from the Science and Education area. Chemistry solution provides the Chemical Drawings Library with large quantity of vector chemistry equation symbols to help you create professional looking chemistry diagrams quick and easy.Chemistry Drawings
ConceptDraw PRO diagramming and vector drawing software extended with Chemistry solution from the Science and Education area is a powerful chemistry drawing software that is ideal for quick and easy designing of various: chemistry drawings, scientific and educational chemistry illustrations, schemes and diagrams of chemical and biological lab set-ups, images with chemical formulas, molecular structures, chemical reaction schemes, schemes of labware, that can be then successfully used in the field of science and education, on various conferences, and so on.Astronomy Symbols
Are you an astronomer, astronomy teacher or student? And you need to draw astronomy pictures quick and easy? ConceptDraw PRO diagramming and vector drawing software extended with Astronomy solution from the Science and Education area will help you! Astronomy solution provides 7 libraries with wide variety of predesigned vector objects of astronomy symbols, celestial bodies, solar system symbols, constellations, etc.Scientific Symbols Chart
ConceptDraw PRO is the beautiful design software that provides many vector stencils, examples and templates for drawing different types of illustrations and diagrams.Mathematics Solution from the Science and Education area of ConceptDraw Solution Park includes a few shape libraries of plane, solid geometric figures, trigonometrical functions and greek letters to help you create different professional looking mathematic illustrations for science and education.
 Chemistry
This solution extends ConceptDraw PRO software with samples, template and libraries of vector stencils for drawing the Chemistry Illustrations for science and education.
Process Engineering
ConceptDraw PRO diagramming and vector drawing software supplied with Chemical and Process Engineering Solution from the Engineering Area of ConceptDraw Solution Park is powerful and effective process engineering software.Design Element: Basic Network for Network Diagrams
ConceptDraw PRO is perfect for software designers and software developers who need to draw Basic Network Diagrams.
Mac Compatible Remote Presentation
Mac compatible remote presentation, A simple way to share your presentation remotely via Skype. All participants receive presentation file.
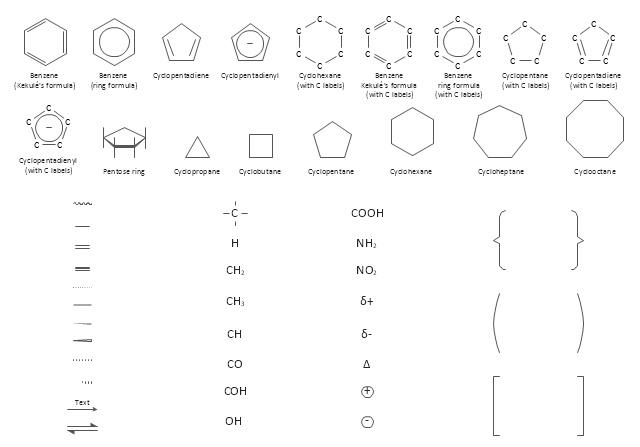
The vector stencils library "Chemical drawings" contains 81 symbols of organic compounds and functional groups for chemical drawing.
Use it to draw structural formulas of organic molecules, schemes of chemical reactions and organic chemistry diagrams.
"Structural drawings.
Organic molecules are described more commonly by drawings or structural formulas, combinations of drawings and chemical symbols. The line-angle formula is simple and unambiguous. In this system, the endpoints and intersections of each line represent one carbon, and hydrogen atoms can either be notated explicitly or assumed to be present as implied by tetravalent carbon. The depiction of organic compounds with drawings is greatly simplified by the fact that carbon in almost all organic compounds has four bonds, nitrogen three, oxygen two, and hydrogen one. ...
Organic reactions.
Organic reactions are chemical reactions involving organic compounds. While pure hydrocarbons undergo certain limited classes of reactions, many more reactions which organic compounds undergo are largely determined by functional groups. The general theory of these reactions involves careful analysis of such properties as the electron affinity of key atoms, bond strengths and steric hindrance. These issues can determine the relative stability of short-lived reactive intermediates, which usually directly determine the path of the reaction.
The basic reaction types are: addition reactions, elimination reactions, substitution reactions, pericyclic reactions, rearrangement reactions and redox reactions. ...
Each reaction has a stepwise reaction mechanism that explains how it happens in sequence - although the detailed description of steps is not always clear from a list of reactants alone.
The stepwise course of any given reaction mechanism can be represented using arrow pushing techniques in which curved arrows are used to track the movement of electrons as starting materials transition through intermediates to final products." [Organic chemistry. Wikipedia]
The chemical symbols example "Design elements - Chemical drawings" was created using the ConceptDraw PRO software extended with the Chemistry solution from the Science and Education area of ConceptDraw Solution Park.
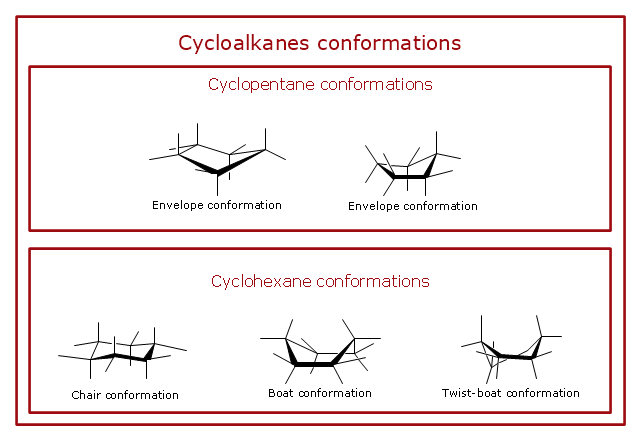
"A cyclohexane conformation is any of several three-dimensional shapes that a cyclohexane molecule can assume while maintaining the integrity of its chemical bonds.
The internal angles of a flat regular hexagon are 120°, while the preferred angle between successive bonds in a carbon chain is about 109.5°, the tetrahedral angle. Therefore the cyclohexane ring tends to assume certain non-planar (warped) conformations, which have all angles closer to 109.5° and therefore a lower strain energy than the flat hexagonal shape. The most important shapes are called chair, half-chair, boat, and twist-boat. The molecule can easily switch between these conformations, and only two of them - chair and twist-boat - can be isolated in pure form.
Cyclohexane conformations have been extensively studied in organic chemistry because they are the classical example of conformational isomerism and have noticeable influence on the physical and chemical properties of cyclohexane." [Cyclohexane conformation. Wikipedia]
The chemical drawing example "Cycloalkanes conformations" was created using the ConceptDraw PRO diagramming and vector drawing software extended with the Chemistry solution from the Science and Education area of ConceptDraw Solution Park.
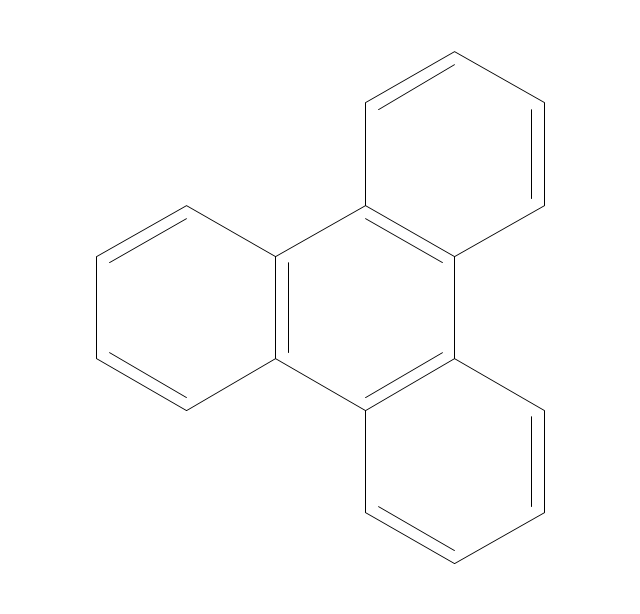
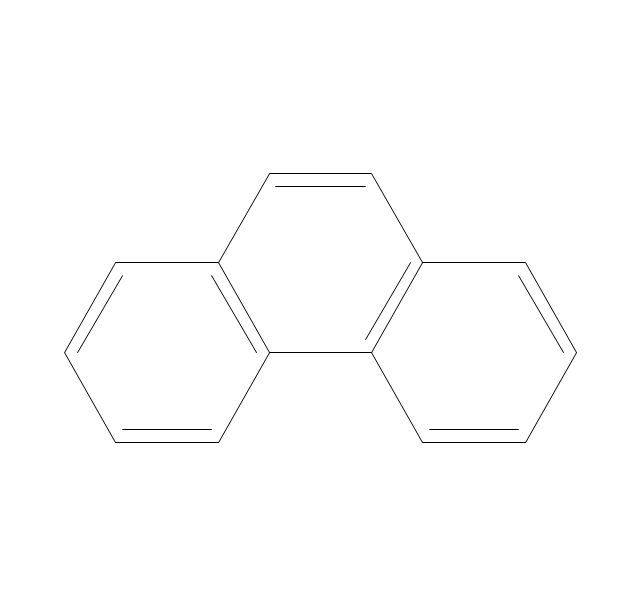
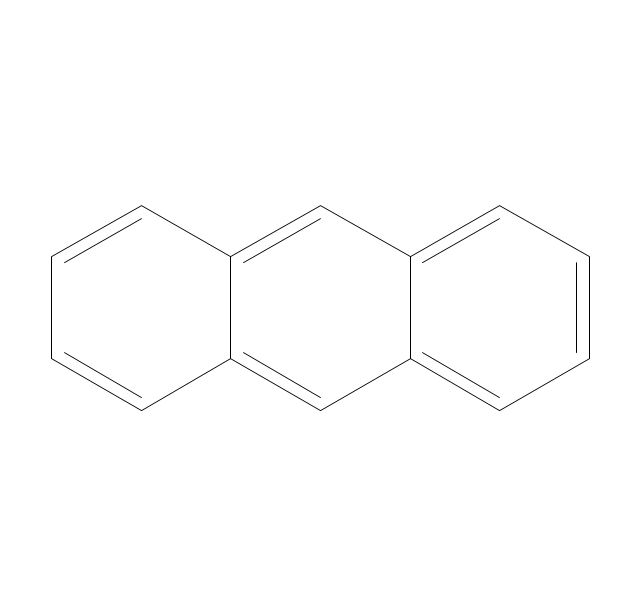
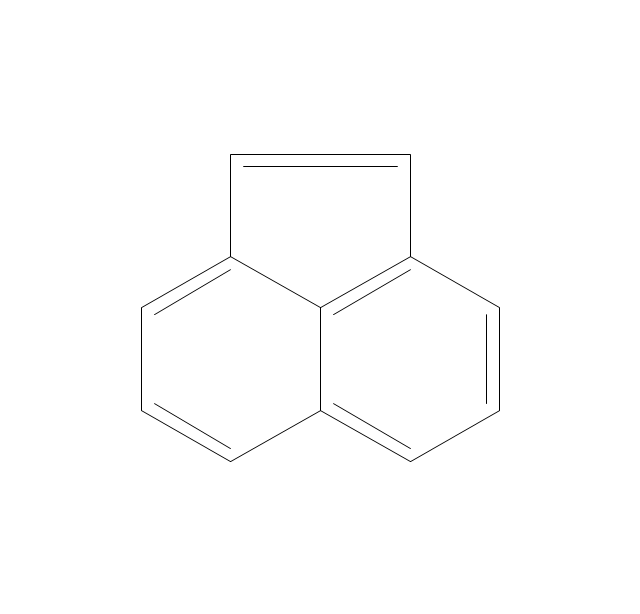
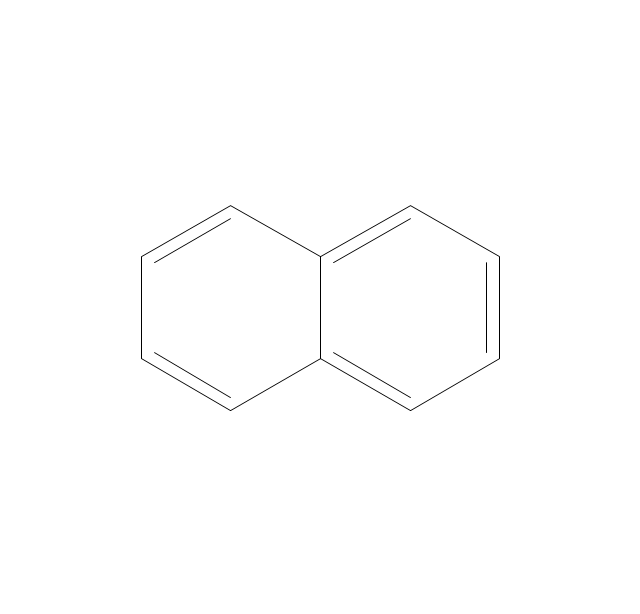
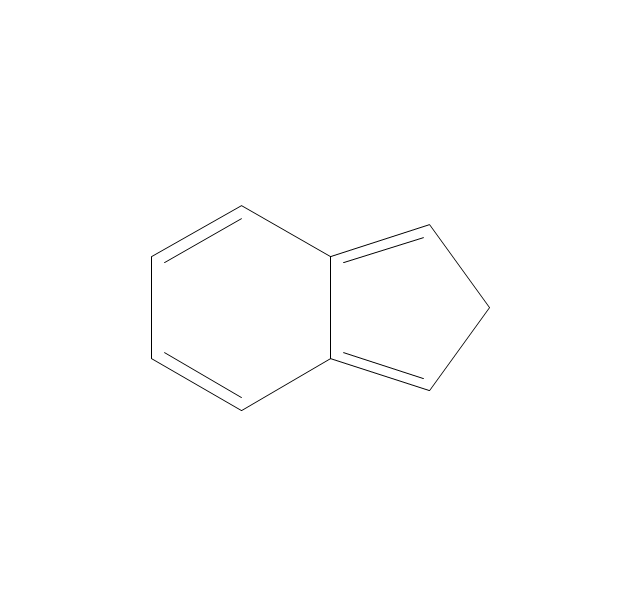
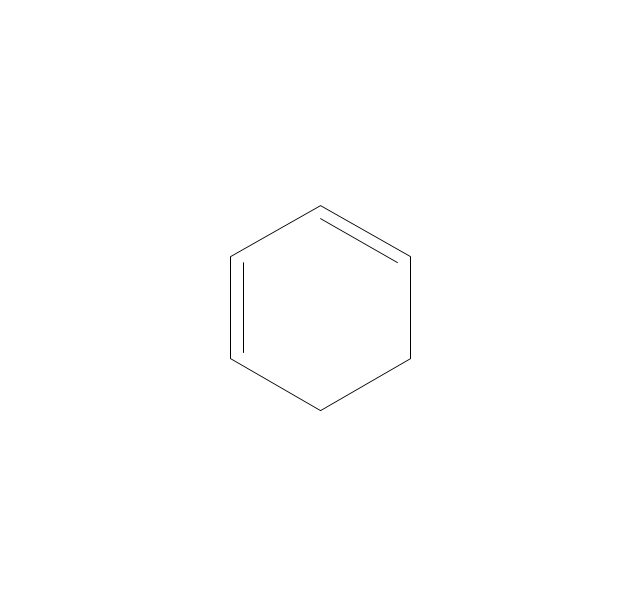
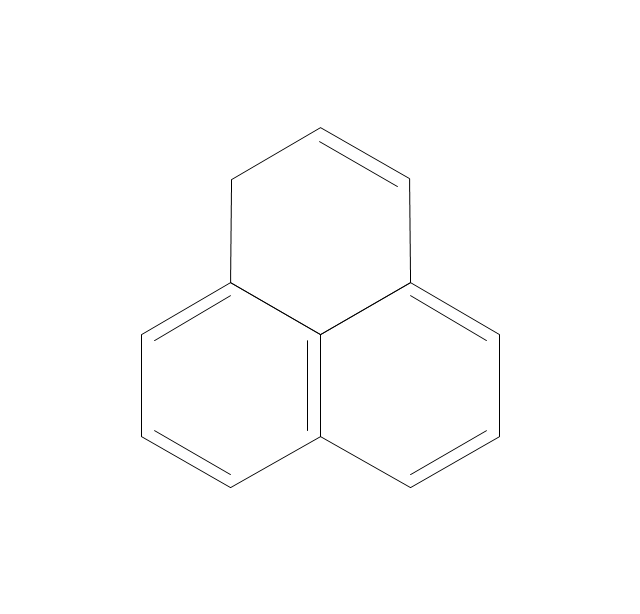
The vector stencils library "Aromatics" contains 23 symbols of aromatic rings for chemical drawing of molecular structural formulas and reaction mechanism schemes in organic chemistry.
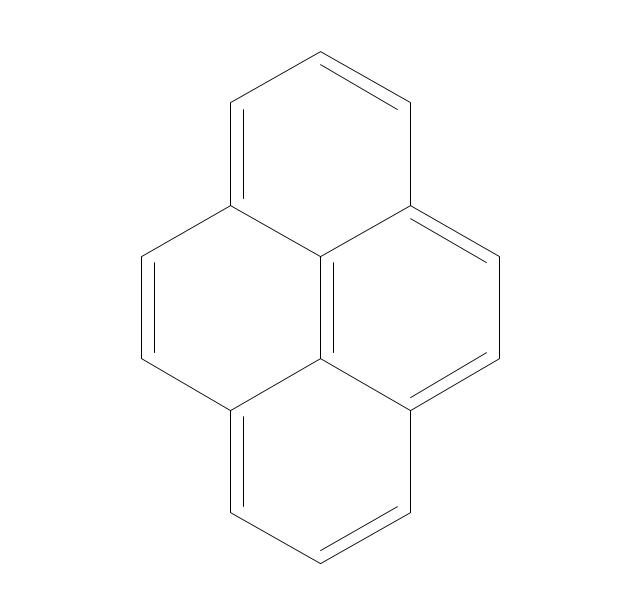
"In organic chemistry, aromaticity is a chemical property describing the way in which a conjugated ring of unsaturated bonds, lone pairs, or empty orbitals exhibits a stabilization stronger than would be expected by the stabilization of conjugation alone. ... Aromaticity can also be considered a manifestation of cyclic delocalization and of resonance. This is usually considered to be because electrons are free to cycle around circular arrangements of atoms that are alternately single- and double-bonded to one another. These bonds may be seen as a hybrid of a single bond and a double bond, each bond in the ring identical to every other. This commonly seen model of aromatic rings, namely the idea that benzene was formed from a six-membered carbon ring with alternating single and double bonds (cyclohexatriene), was developed by Kekulé (see History section below). The model for benzene consists of two resonance forms, which corresponds to the double and single bonds superimposing to give rise to six one-and-a-half bonds. Benzene is a more stable molecule than would be expected without accounting for charge delocalization. ... Types of aromatic compounds. The overwhelming majority of aromatic compounds are compounds of carbon, but they need not be hydrocarbons. 1. Neutral homocyclics. Benzene, as well as most other annulenes (cyclodecapentaene excepted) with the formula CnHn where n is an even number, such as cyclotetradecaheptaene. 2. Heterocyclics. In heterocyclic aromatics (heteroaromats), one or more of the atoms in the aromatic ring is of an element other than carbon. This can lessen the ring's aromaticity, and thus (as in the case of furan) increase its reactivity. Other examples include pyridine, pyrazine, imidazole, pyrazole, oxazole, thiophene, and their benzannulated analogs (benzimidazole, for example). 3. Polycyclics. Polycyclic aromatic hydrocarbons are molecules containing two or more simple aromatic rings fused together by sharing two neighboring carbon atoms (see also simple aromatic rings). Examples are naphthalene, anthracene, and phenanthrene. 4. Substituted aromatics. Many chemical compounds are aromatic rings with other functional groups attached. Examples include trinitrotoluene (TNT), acetylsalicylic acid (aspirin), paracetamol, and the nucleotides of DNA. 5. Atypical aromatic compounds. Aromaticity is found in ions as well: the cyclopropenyl cation (2e system), the cyclopentadienyl anion (6e system), the tropylium ion (6e), and the cyclooctatetraene dianion (10e). Aromatic properties have been attributed to non-benzenoid compounds such as tropone. Aromatic properties are tested to the limit in a class of compounds called cyclophanes. A special case of aromaticity is found in homoaromaticity where conjugation is interrupted by a single sp³ hybridized carbon atom. When carbon in benzene is replaced by other elements in borabenzene, silabenzene, germanabenzene, stannabenzene, phosphorine or pyrylium salts the aromaticity is still retained. Aromaticity also occurs in compounds that are not carbon-based at all. Inorganic 6-membered-ring compounds analogous to benzene have been synthesized. Hexasilabenzene (Si6H6) and borazine (B3N3H6) are structurally analogous to benzene, with the carbon atoms replaced by another element or elements. In borazine, the boron and nitrogen atoms alternate around the ring." [Aromaticity. Wikipedia]
The organic compound structural formulas example "Aromatics - Vector stencils library" was created using the ConceptDraw PRO software extended with the Chemistry solution from the Science and Education area of ConceptDraw Solution Park.
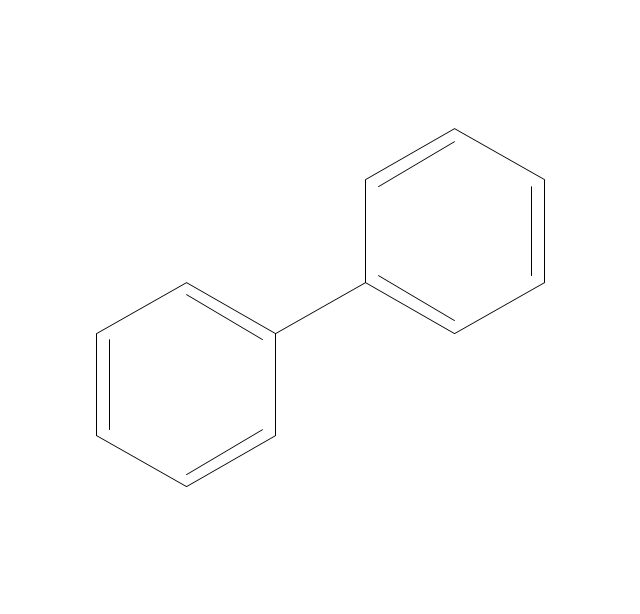
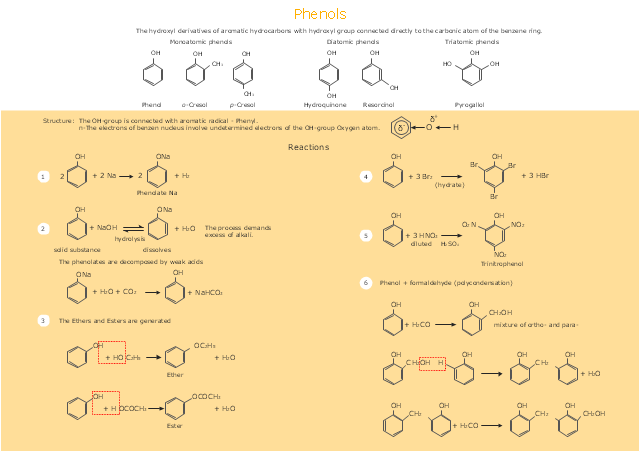
This drawing illustrates examples o f phenolic compounds molecular structures, and chemical reactions of phenols.
"In organic chemistry, phenols, sometimes called phenolics, are a class of chemical compounds consisting of a hydroxyl group (-OH) bonded directly to an aromatic hydrocarbon group. The simplest of the class is phenol, which is also called carbolic acid C6H5OH. Phenolic compounds are classified as simple phenols or polyphenols based on the number of phenol units in the molecule. ...
Although similar to alcohols, phenols have unique properties and are not classified as alcohols (since the hydroxyl group is not bonded to a saturated carbon atom). They have higher acidities due to the aromatic ring's tight coupling with the oxygen and a relatively loose bond between the oxygen and hydrogen. The acidity of the hydroxyl group in phenols is commonly intermediate between that of aliphatic alcohols and carboxylic acids (their pKa is usually between 10 and 12).
Loss of a positive hydrogen ion (H+) from the hydroxyl group of a phenol forms a corresponding negative phenolate ion or phenoxide ion, and the corresponding salts are called phenolates or phenoxides, although the term aryloxides is preferred according to the IUPAC Gold Book. Phenols can have two or more hydroxy groups bonded to the aromatic ring(s) in the same molecule. The simplest examples are the three benzenediols, each having two hydroxy groups on a benzene ring." [Phenols. Wikipedia]
The chemical drawing example "Phenols" was created using the ConceptDraw PRO software extended with the Chemistry solution from the Science and Education area of ConceptDraw Solution Park.
- Chemistry Drawing Software | Chemistry Symbols and Meanings ...
- Science Education Chemistry
- How to Draw Chemistry Structures | Chemistry Drawing Software ...
- Chemistry | Chemistry Drawing Software | Chemistry Equation ...
- Chemistry Equation Symbols | Organic Chemistry Symbols ...
- Chemistry Drawing Software | Chemistry Symbols and Meanings ...
- Organic Chemistry Symbols | Chemistry Drawings | Chemistry ...
- Chemistry Equation Symbols | Chemistry Drawing Software ...
- Organic Chemistry Symbols | Chemistry Symbols and Meanings ...
- How to Draw Chemistry Structures | Chemistry Drawing Software ...
- Chemistry Drawings | Chemistry Drawing Software | Chemistry ...
- Chemistry Equation Symbols | Chemistry Drawing Software ...
- Chemistry Drawing Software | Chemistry Drawings | Organic ...
- Organic Chemistry Symbols | Process Engineering | Chemistry ...
- Chemistry Symbols and Meanings | Organic Chemistry Symbols ...
- Network Layout Floor Plans | Organic Chemistry Symbols ...
- Chemistry Drawing Software | Organic Chemistry Symbols | How to ...
- Chemistry Drawing Software | Organic Chemistry Symbols ...
- Chemistry Drawings | Chemistry Drawing Software | Organic ...


.png)

