 ConceptDraw Solution Park
ConceptDraw Solution Park collects graphic extensions, examples and learning materials
HelpDesk
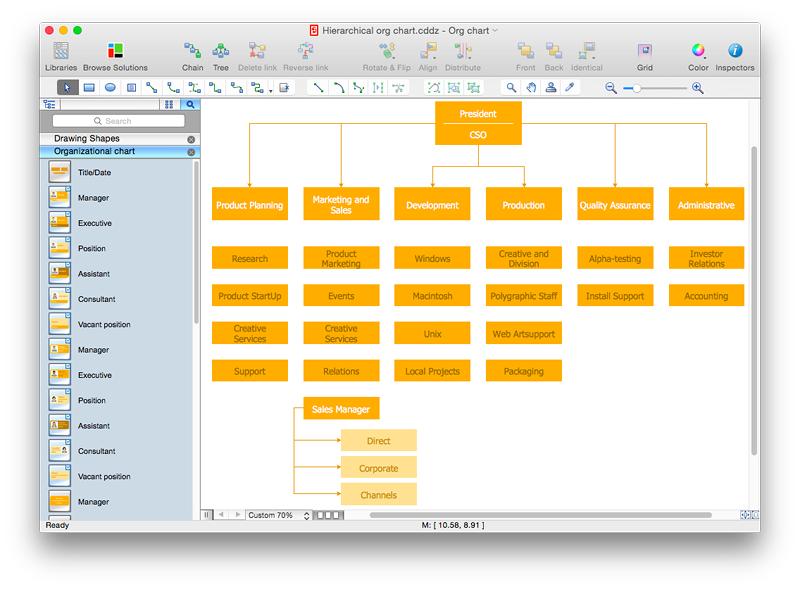
How to Draw a Hierarchical Organizational Chart with ConceptDraw PRO
There are a number of different organisational structures. The most appropriate structure will depend on the size of the business and the type of business. A hierarchical organizational structure is one of the most typical organizational structure. This structure can be represented as a pyramid, with a single entity in authority at the top, with subsequent levels of power beneath them. Each member of the pyramid reports only to their direct subordinates or superiors, limiting the amount of communication overhead, which can be seen both as an asset or a limitation. It is easy to see where a hierarchical structure would be an effective solution; companies that have offices based in disparate locations, a business that focuses on diversified markets, any organization with need for multiple levels of middle management. You can easily create a clear hierarchical organizational chart using ConceptDraw solution that contains templates of the 25 Typical Orgcharts.HelpDesk
How to Connect Text Data to a Time Series Chart on Your Live Dashboard
Time Series Dashboard means an integration of some type of diagrams: Line Charts, Bar Charts, Column Charts, and Dot Plots on a single space. The ConceptDraw Time Series Dashboard solution can be used to create the interactive Time Series dashboard. The libraries of Time Series Charts solution contain the Live Objects, that can change their appearance depending on the external data. Each chart from the Time Series dashboard displays particular source data. You can include Time Series Charts in your business or technical dashboards to show and compare the items changing over time.
HelpDesk
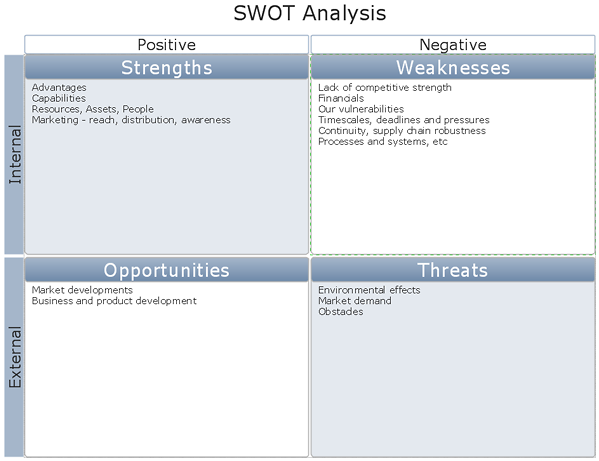
How to Create a SWOT Matrix Quickly
ConceptDraw PRO allow create SWOT Matrix in just one click for presenting analysis results preformed in mimd map structure using ConceptDraw MINDMAP.
 25 Typical Orgcharts
The 25 Typical Orgcharts solution contains powerful organizational structure and organizational management drawing tools, a variety of professionally designed organization chart and matrix organization structure samples, 25 templates based on various orga
"Telecommunication is communication at a distance by technological means, particularly through electrical signals or electromagnetic waves. ...
Electrical and electromagnetic telecommunication technologies include telegraph, telephone, and teleprinter, networks, radio, microwave transmission, fiber optics, communications satellites and the Internet." [Telecommunication. Wikipedia]
"A telecommunications service provider or TSP is a type of communications service provider that has traditionally provided telephone and similar services. This category includes incumbent local exchange carriers, competitive local exchange carriers, and mobile wireless communication companies. ...
While some people use the terms "telecom service provider" and "communications service provider" interchangeably, the term TSP generally excludes Internet service providers (ISPs), cable companies, satellite TV, and managed service providers. ...
TSPs provide access to telephone and related communications services." [Telecommunications service provider. Wikipedia]
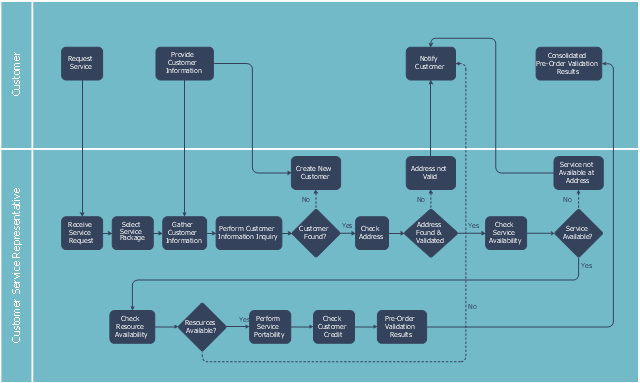
The cross-functional flowchart example "Providing telecom services" was created using the ConceptDraw PRO diagramming and vector drawing software extended with the Cross-Functional Flowcharts solution from the Business Processes area of ConceptDraw Solution Park.
HelpDesk
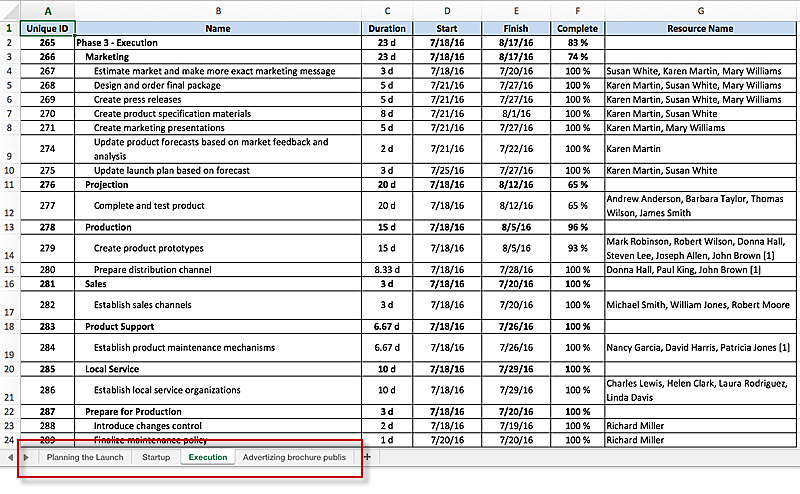
How to Report on Multiple Projects Status
Reporting on project status is an important part of project management. Project manager have to generate systematic reports on project progress concerning schedule, scope and budget. Project progress reports, made orderly, form a notation of a current project status. Once a project manager has been assigned to a number of projects running simultaneously, a variety of business issues come up, such as: what kind of projects have already been launched, and what is their status? The reporting facilities of ConceptDraw PROJECT are actually dramatic. The following article is created to let you find out how to generate reports on multiple project using ConceptDraw PROJECT standard reporting pack.- Process Flowchart | Cross-Functional Flowchart | Network ...
- How to Draw an Organization Chart | Organizational Structure ...
- How to Draw an Organization Chart | PM Teams | Donut Chart ...
- Network organization chart
- Network Visualization with ConceptDraw PRO | ConceptDraw ...
- Process Flowchart | How to Create Organizational Chart Quickly ...
- Network Visualization with ConceptDraw PRO | Product Overview ...
- Examples of Flowcharts , Org Charts and More | Marketing and Sales ...
- Process Flowchart | Exercise your brain | Activity Network (PERT ...
- How to Draw an Organization Chart | How to Draw a Bubble Chart ...
- Process Flowchart | Activity on Node Network Diagramming Tool ...
- How to Draw an Organization Chart | Network organization chart ...
- Network Diagram And Design Of A Company
- Telecommunication Network Diagrams | Process Flowchart ...
- How to Draw an Organization Chart | ConceptDraw PRO ...
- Examples of Flowcharts , Org Charts and More | Program Evaluation ...
- Process Flowchart | Cross-functional flowchart - Providing telecom ...
- Network Diagram Examples | Physical LAN and WAN diagram ...
- Organizational Structure | Process Flowchart | Network Diagram ...
- Organizational Structure | Process Flowchart | How to Draw an ...


