Basic Flowchart Symbols and Meaning
Flowcharts are the best for visually representation the business processes and the flow of a custom-order process through various departments within an organization. ConceptDraw PRO diagramming and vector drawing software extended with Flowcharts solution offers the full set of predesigned basic flowchart symbols which are gathered at two libraries: Flowchart and Flowcharts Rapid Draw. Among them are: process, terminator, decision, data, document, display, manual loop, and many other specific symbols. The meaning for each symbol offered by ConceptDraw gives the presentation about their proposed use in professional Flowcharts for business and technical processes, software algorithms, well-developed structures of web sites, Workflow diagrams, Process flow diagram and correlation in developing on-line instructional projects or business process system. Use of ready flow chart symbols in diagrams is incredibly useful - you need simply drag desired from the libraries to your document and arrange them in required order. There are a few serious alternatives to Visio for Mac, one of them is ConceptDraw PRO. It is one of the main contender with the most similar features and capabilities.
Flowchart design. Flowchart symbols, shapes, stencils and icons
A flowchart is a type of diagram which represents an algorithm, process or workflow, displays the steps as boxes of various kinds and depicts their order by connecting them with arrows. Any business graphic document will be more colorful and understandable if will use professional-looking and visual diagrams and flowcharts. Flowchart design gives versatile presenting and explaining of the process. ConceptDraw PRO flowchart software enhanced with Flowcharts solution helps effectively make Flowchart Design. Use of predesigned flowchart symbols and bright color palette offers a fresh view and favorably distinguishes the flowcharts designed in ConceptDraw PRO from the black and white flowcharts on a paper. Preferably to use no more than three or four colors and apply identical for the same shape types. The best flowchart design can be achieved by starting with Flowchart template, or any of suitable ready examples or samples offered in ConceptDraw STORE, open one of them and enter the proper text into each Flowchart shape. Each symbol of the flowchart has a definition that can't be changed. This means that all flowcharts shapes can be grouped in according to their meaning. Users with ConceptDraw PRO flowchart software can style groups of symbols with close definitions by color sets chosen from complementary palette. Almost all workflows can be depicted as a flowchart. Colored diagrams are more light for perception of the certain information, this is part of flowchart design. Bright colors need to be used in the key points of Decision symbols, to focus attention on their importance for whole process flow.
Flow Chart Symbols
The Flowcharts are incredibly useful and popular tool used in science, business, software development, analytics, engineering, marketing, manufacturing, administration, architecture, government, politics, and many other fields thanks to a variety of existing types of flowcharts. A Flowchart is a visual graphical representation of the process, algorithm, or the set of steps taken for problem's solution. Widely used for designing, visualizing and documenting simple and complex processes and programs, they effectively help to understand the process and to find easier the flaws if they are. Each flowchart type supposes the use of its own set of notations for drawing corresponding diagram, which includes the symbols of process, decision, data, document, data base, termination, initiation processes, processing loops, conditions, etc. It is easily design a Flowchart using the special professional flowchart maker - ConceptDraw PRO diagram software with numerous predesigned flow chart symbols grouped in libraries of Flowcharts solution from ConceptDraw Solution Park.The vector stencils library "HR flowchart" contains 62 flowchart symbols.
Use it to draw your HR flowcharts, workflow diagrams and process charts with the ConceptDraw PRO diagramming and vector drawing software.
The flow chart symbols library "HR flowchart" is included in the HR Flowcharts solution from the Management area of ConceptDraw Solution Park.
Use it to draw your HR flowcharts, workflow diagrams and process charts with the ConceptDraw PRO diagramming and vector drawing software.
The flow chart symbols library "HR flowchart" is included in the HR Flowcharts solution from the Management area of ConceptDraw Solution Park.
Purchase Process Flow Chart, Receiving Process Flow Chart, Accounting Flowchart Example.
The purchasing process follows very specific guidelines and includes a purchasing cycle flowchart and receiving process flow chart. Common key elements of purchasing process. It is important to know how purchasing processes work and how each operation is done.The vector stencils library "Sales flowchart" contains 62 sales process flow chart symbols.
Use these flow chart icon set to draw your sales flowcharts, workflow diagrams and process charts with the ConceptDraw PRO diagramming and vector drawing software.
The sales process flowchart symbols library "Sales flowchart" is included in the Sales Flowcharts solution from the Marketing area of ConceptDraw Solution Park.
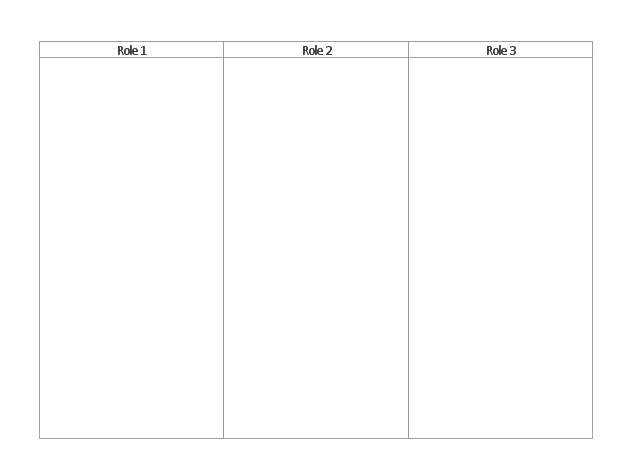
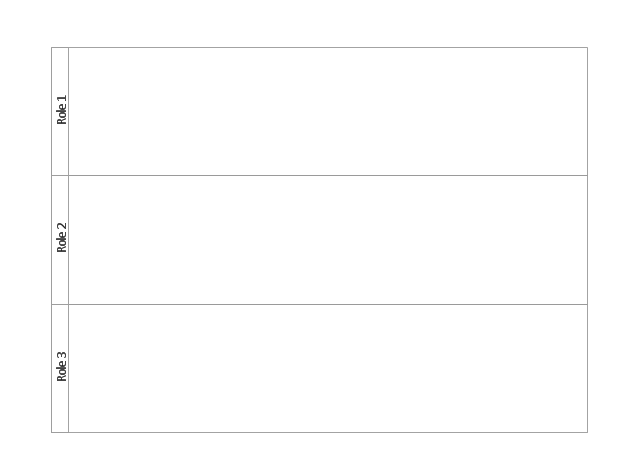
The vector stencils library "Cross-functional flowcharts" contains 31 flow chart symbols. Use it for drawing cross-functional and deployment flowcharts the ConceptDraw PRO diagramming and vector drawing software extended with the Cross-Functional Flowcharts solution from the Business Processes area of ConceptDraw Solution Park.
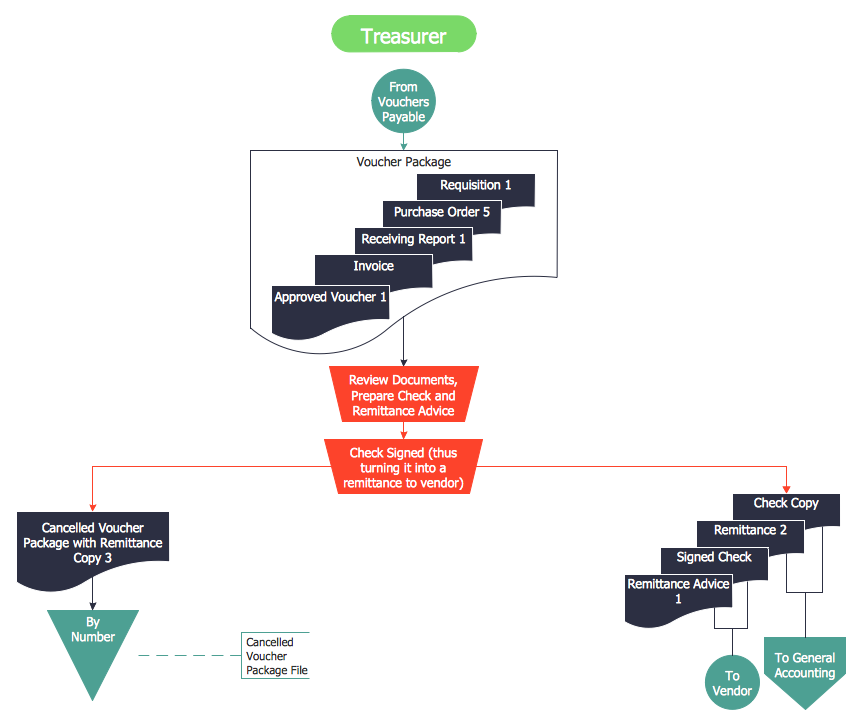
Accounts Payable Process Flow Chart
Accounts Payable Process Flow Chart - ConceptDraw PRO diagramming and vector drawing software extended with Accounting Flowcharts Solution provides the useful tools that will help you create easily and quickly. The Accounts Payable Process Flow Chart is very popular and widely used type of accounting flowcharts. Now their designing is simple thanks to the Accounting Flowcharts Solution that provides the Accounting Flowcharts library of predesigned commonly-used shapes and a set of templates and samples.AWS icons 2.0
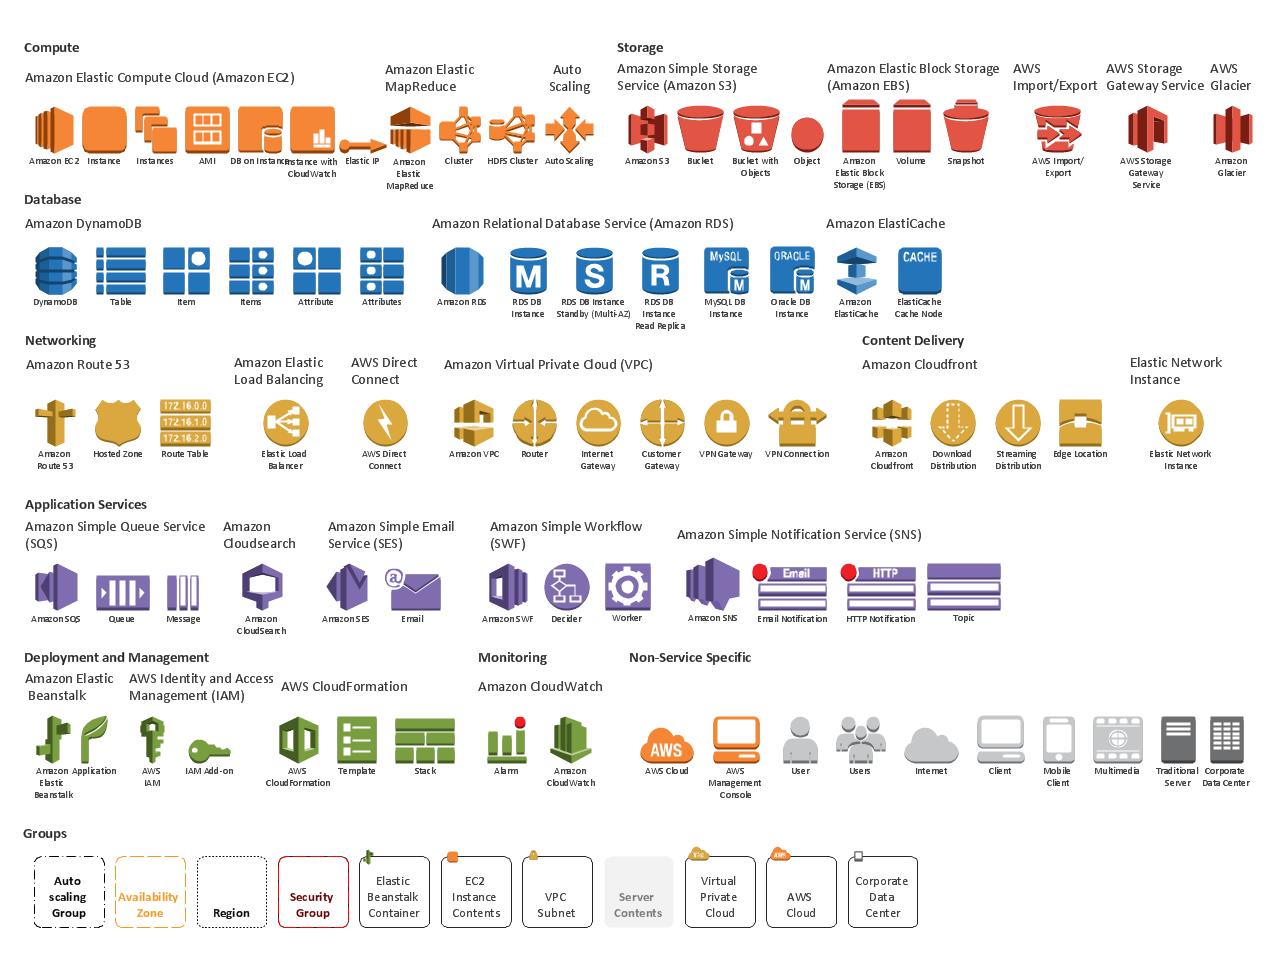
ConceptDraw Solution Park includes AWS architecture solution for creating Web Application Architectures.Swim Lane Flowchart Symbols
Use the set of special professionally developed swim lane flowchart symbols - single, multiple, vertical and horizontal lanes from the Swimlanes and Swimlanes BPMN 1.2 libraries from the Business Process Diagram solution, the Swim Lanes library from the Business Process Mapping solution as the perfect basis for your Swim Lane Flowcharts of processes, algorithms and procedures.- Sales flowchart - Vector stencils library | Sales Flowcharts | Www ...
- Flowchart - Vector stencils library | Design elements - Accounting ...
- Sales flowchart - Vector stencils library | HR flowchart - Vector ...
- Sales flowchart - Vector stencils library | Settings - Included Apps ...
- Basic Flowchart Symbols and Meaning | Business Process ...
- Sales flowchart - Vector stencils library | Accounting flowcharts ...
- Flowchart Diamond Symbol
- Sales flowchart - Vector stencils library | Database Operation ...
- Audit process | Sales flowchart - Vector stencils library | Design ...



-hr-flowchart---vector-stencils-library.png--diagram-flowchart-example.png)
-hr-flowchart---vector-stencils-library.png--diagram-flowchart-example.png)

-hr-flowchart---vector-stencils-library.png--diagram-flowchart-example.png)

-hr-flowchart---vector-stencils-library.png--diagram-flowchart-example.png)
-hr-flowchart---vector-stencils-library.png--diagram-flowchart-example.png)

-hr-flowchart---vector-stencils-library.png--diagram-flowchart-example.png)





-hr-flowchart---vector-stencils-library.png--diagram-flowchart-example.png)

-hr-flowchart---vector-stencils-library.png--diagram-flowchart-example.png)
















-hr-flowchart---vector-stencils-library.png--diagram-flowchart-example.png)
-hr-flowchart---vector-stencils-library.png--diagram-flowchart-example.png)





-sales-flowchart---vector-stencils-library.png--diagram-flowchart-example.png)
-sales-flowchart---vector-stencils-library.png--diagram-flowchart-example.png)

-sales-flowchart---vector-stencils-library.png--diagram-flowchart-example.png)

-sales-flowchart---vector-stencils-library.png--diagram-flowchart-example.png)
-sales-flowchart---vector-stencils-library.png--diagram-flowchart-example.png)

-sales-flowchart---vector-stencils-library.png--diagram-flowchart-example.png)





-sales-flowchart---vector-stencils-library.png--diagram-flowchart-example.png)

-sales-flowchart---vector-stencils-library.png--diagram-flowchart-example.png)
























-sales-flowchart---vector-stencils-library.png--diagram-flowchart-example.png)
-sales-flowchart---vector-stencils-library.png--diagram-flowchart-example.png)
















-cross-functional-flowcharts---vector-stencils-library.png--diagram-flowchart-example.png)
-cross-functional-flowcharts---vector-stencils-library.png--diagram-flowchart-example.png)
-cross-functional-flowcharts---vector-stencils-library.png--diagram-flowchart-example.png)
-cross-functional-flowcharts---vector-stencils-library.png--diagram-flowchart-example.png)
