 Matrices
This solution extends ConceptDraw PRO software with samples, templates and library of design elements for drawing the business matrix diagrams.
 Marketing
This solution extends ConceptDraw PRO v9 and ConceptDraw MINDMAP v7 with Marketing Diagrams and Mind Maps (brainstorming, preparing and holding meetings and presentations, sales calls).
 Seven Management and Planning Tools
Seven Management and Planning Tools solution extends ConceptDraw PRO and ConceptDraw MINDMAP with features, templates, samples and libraries of vector stencils for drawing management mind maps and diagrams.
 Business Productivity Area
Business Productivity Solutions extend ConceptDraw products with tools for making presentations, conducting meetings, preparing documents, brainstorming, or building new strategies.
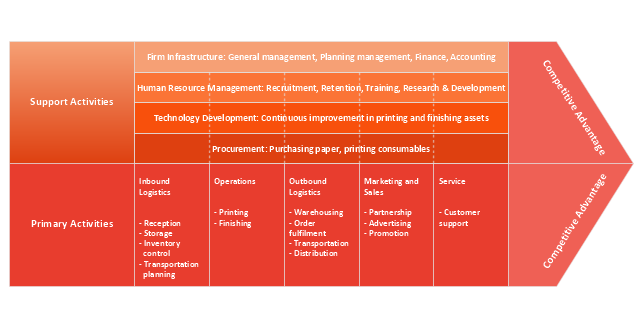
"A value chain is a chain of activities that a firm operating in a specific industry performs in order to deliver a valuable product or service for the market. ...
The concept of value chains as decision support tools, was added onto the competitive strategies paradigm developed by Porter as early as 1979. In Porter's value chains, Inbound Logistics, Operations, Outbound Logistics, Marketing and Sales and Service are categorized as primary activities. Secondary activities include Procurement, Human Resource management, Technological Development and Infrastructure." [Value chain. Wikipedia]
This Porter's value chain matrix diagram example was created using the ConceptDraw PRO diagramming and vector drawing software extended with the Matrices solution from the Marketing area of ConceptDraw Solution Park.
"The growth–share matrix (aka the product portfolio, BCG-matrix, Boston matrix, Boston Consulting Group analysis, portfolio diagram) is a chart that was created by Bruce D. Henderson for the Boston Consulting Group in 1970 to help corporations to analyze their business units, that is, their product lines. This helps the company allocate resources and is used as an analytical tool in brand marketing, product management, strategic management, and portfolio analysis. ...
To use the chart, analysts plot a scatter graph to rank the business units (or products) on the basis of their relative market shares and growth rates.
Cash cows is where company has high market share in a slow-growing industry. ...
Dogs, more charitably called pets, are units with low market share in a mature, slow-growing industry. ...
Question marks (also known as problem children) are business operating in a high market growth, but having a low market share. ...
Stars are units with a high market share in a fast-growing industry." [Growth–share matrix. Wikipedia]
This Boston growth-share (BCG) matrix diagram example was created using the ConceptDraw PRO diagramming and vector drawing software extended with the Matrices solution from the Marketing area of ConceptDraw Solution Park.
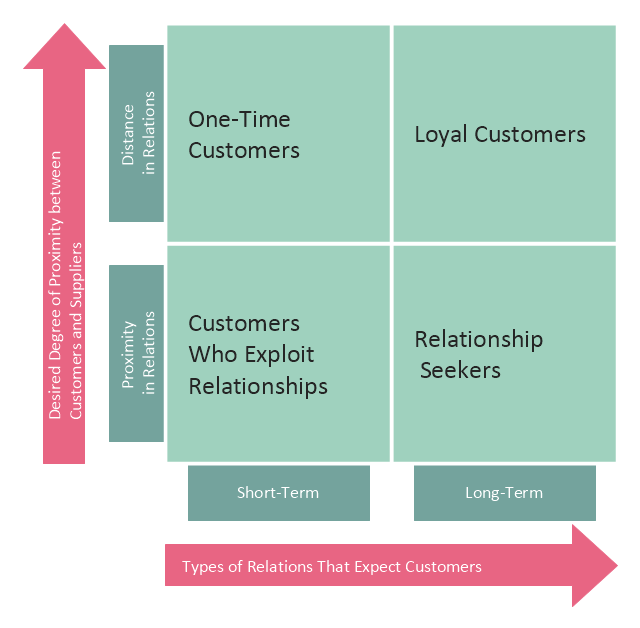
This customer types matrix diagram distribute customers into four categories depending of two criteria: 1) desired degree of proximity between customers and suppliers, and 2) types of relations that expect customers.
One time customers have short-term relations with suppliers and characterized by distance in relations with them.
Loyal customers have long-term relations with suppliers and characterized by distance in relations with them.
Customers who exploit relationships have short-term relations with suppliers and characterized by proximity in relations with them.
Relationship seekers have long-term relations with suppliers and characterized by proximity in relations with them.
This customer types matrix diagram example was created using the ConceptDraw PRO diagramming and vector drawing software extended with the Matrices solution from the Marketing area of ConceptDraw Solution Park.
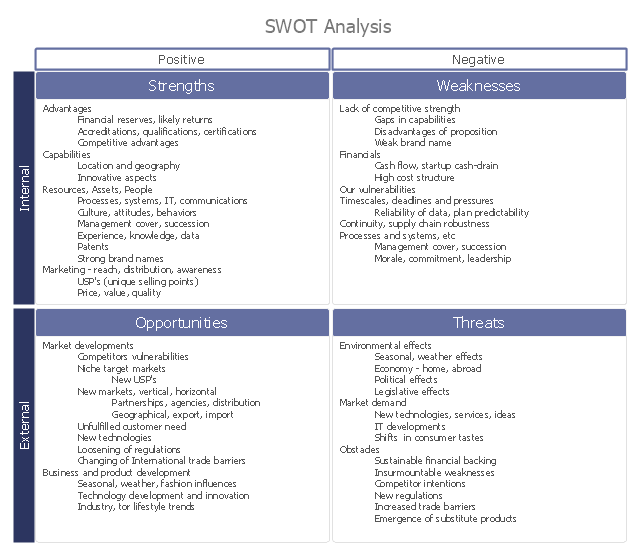
"SWOT analysis (SWOT Matrix) is a structured planning method used to evaluate the Strengths, Weaknesses, Opportunities, and Threats involved in a project or in a business venture. A SWOT analysis can be carried out for a product, place, industry or person. It involves specifying the objective of the business venture or project and identifying the internal and external factors that are favorable and unfavorable to achieving that objective. ...
The degree to which the internal environment of the firm matches with the external environment is expressed by the concept of strategic fit." [SWOT analysis. Wikipedia]
This SWOT analysis matrix diagram example was drawn using the ConceptDraw PRO diagramming and vector drawing software extended with the SWOT Analysis solution from the Management area of ConceptDraw Solution Park.
 ConceptDraw Solution Park
ConceptDraw Solution Park collects graphic extensions, examples and learning materials
- Deployment flowchart - Trading process diagram | Deployment ...
- Marketing | SWOT analysis matrix diagram templates | Swot Analysis ...
- Matrices | Seven Management and Planning Tools | SWOT analysis ...
- ConceptDraw Solution Park | Fishbone Diagram | SWOT matrix ...
- TOWS analysis matrix diagram - Template | SWOT Analysis Solution ...
- Marketing | Circle-spoke diagram template | SWOT analysis matrix ...
- Swot Analysis Examples for Mac OSX | SWOT analysis matrix ...
- Deployment chart template | Quality function deployment chart ...
- SWOT analysis matrix diagram templates | SWOT Analysis | SWOT ...
- SWOT analysis matrix diagram templates | Pyramid Chart Examples ...
- Value Stream Mapping | Entity-Relationship Diagram (ERD) | UML ...
- SWOT Analysis | SWOT Chart | SWOT analysis matrix diagram ...
- Boston growth-share (BCG) matrix diagram
- Porter's generic strategies matrix diagram | Matrices | Porter's value ...
- SWOT analysis matrix diagram examples | SWOT Analysis Tool for ...
- Porter's generic strategies matrix diagram | SWOT Analysis Solution ...
- Matrices | Seven Management and Planning Tools | Feature ...
- Boston growth-share (BCG) matrix diagram | Matrices | SWOT ...
- Swot Analysis Examples for Mac OSX | Pyramid Chart Examples ...
- SWOT analysis matrix diagram examples | Matrices | SWOT Sample ...

-matrix-diagram.png--diagram-flowchart-example.png)


