Types of Flowchart - Overview
When designing a process or an instruction in clear and understandable way, you should consider creating a flowchart. You can avoid spending a lot of time understanding complex concepts as they get clear with different diagrams. The flowcharts are very popular diagram type, they are useful at different fields from the description business processes to the presentation of cooking recipes. Basic Flowchart, Business Process Modeling Diagram, Process Flowchart, Cross Functional Flowchart, Procedure Flowchart, Data Flow Diagram, IDEF Flowchart, SDL Diagram, Workflow Diagram, Document Flowchart, Program Flowchart, Value Stream Map, System Flowchart, Highlight Flowchart, Sales Flowchart are the main types flowchart. The ConceptDraw PRO is one of the professional applications which has great advantages and using which you can create different types of Flowcharts easy and fast. Try to draw an illustrative and comprehensible diagram in ConceptDraw PRO describing the processes instead of writing complex long text and make sure how it is convenient. Visio is expensive, and if you use it in a team environment, these costs are compounded. ConceptDraw PRO is an affordable alternative to Visio and luckily, it comes with a team plan. ConceptDraw PRO can import and export Visio files, so Mac users can collaborate with PC users stuck on Microsoft's software.
Basic Diagramming
Create flowcharts, organizational charts, bar charts, line graphs, and more with ConceptDraw PRO.
Line Chart Examples
The Line Graphs solution from Graphs and Charts area of ConceptDraw Solution Park contains a set of examples, templates and design elements library of line and scatter charts. Use it to draw line and scatter graphs using ConceptDraw PRO diagramming and vector drawing software for illustrating your documents, presentations and websites.Flowchart Examples and Templates
ConceptDraw PRO vector diagramming software and ConceptDraw Solution Park provide a wide variety of diagrams, organizational charts, business charts and flowchart examples, templates and samples. You are free to choose any example or template you are interested in from the ConceptDraw STORE, then use it to simplify your work at the designing professional-looking flowcharts and diagrams. As for flowcharts, turn your attention for the Flowcharts solution from the "Diagrams" area of ConceptDraw Solution Park, Process Flowcharts and Cross-Functional Flowcharts solutions from the Business Processes area, Accounting Flowcharts and Audit Flowcharts solutions from the Finance and Accounting area, which are completely devoted to flowcharts creation and provide an enormous collection of helpful flowchart templates and samples. Each of them is specially developed, well thought-out, dedicated to a certain thematic and carries a specific purpose. You need only to determine with your needs and to decide which one corresponds them the best and suits for you.Pictures of Graphs
ConceptDraw PRO diagramming and vector drawing software extended with Picture Graphs solution from the Graphs and Charts Area is the best choice for making professional looking pictures of graphs and colorful picture graphs.Pyramid Diagram
At the base of the identity of an organisational is its organizational culture.Geo Map - Asia - Pakistan
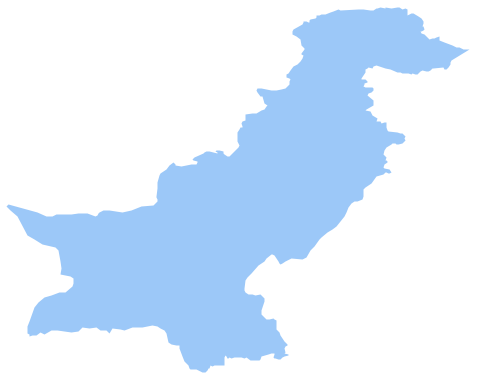
Pakistan, officially the Islamic Republic of Pakistan, is a sovereign country in South Asia. The vector stencils library Pakistan contains contours for ConceptDraw PRO diagramming and vector drawing software. This library is contained in the Continent Maps solution from Maps area of ConceptDraw Solution Park.Geo Map - Canada - Quebec
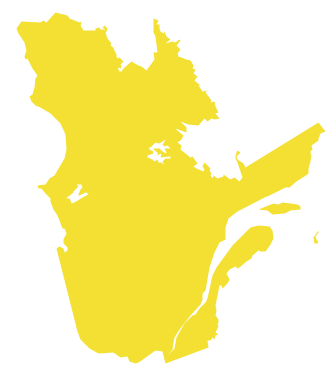
Quebec is a province in east-central Canada. The vector stencils library Quebec contains contours for ConceptDraw PRO diagramming and vector drawing software. This library is contained in the Continent Maps solution from Maps area of ConceptDraw Solution Park.Types of Map - Overview
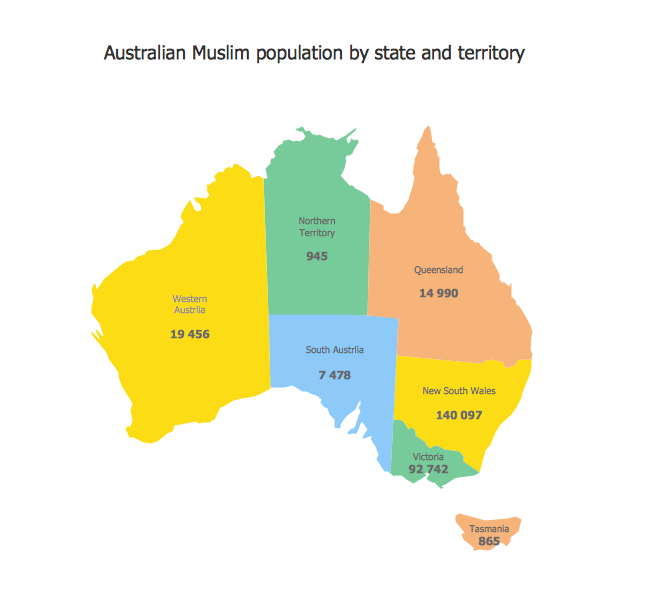
ConceptDraw defines some map types, divided into three categories. Every map type has specific shapes and examples.Geo Map - Canada - Alberta
Alberta is a province of Canada. The vector stencils library Alberta contains contours for ConceptDraw PRO diagramming and vector drawing software. This library is contained in the Continent Maps solution from Maps area of ConceptDraw Solution Park.Line Graph
ConceptDraw PRO extended with Line Graphs solution from Graphs and Charts area of ConceptDraw Solution Park is ideal software for quick and simple drawing professional looking line graph.Geo Map - Europe - Iceland
The vector stencils library Iceland contains contours for ConceptDraw PRO diagramming and vector drawing software. This library is contained in the Continent Maps solution from Maps area of ConceptDraw Solution Park.Geo Map — Asia
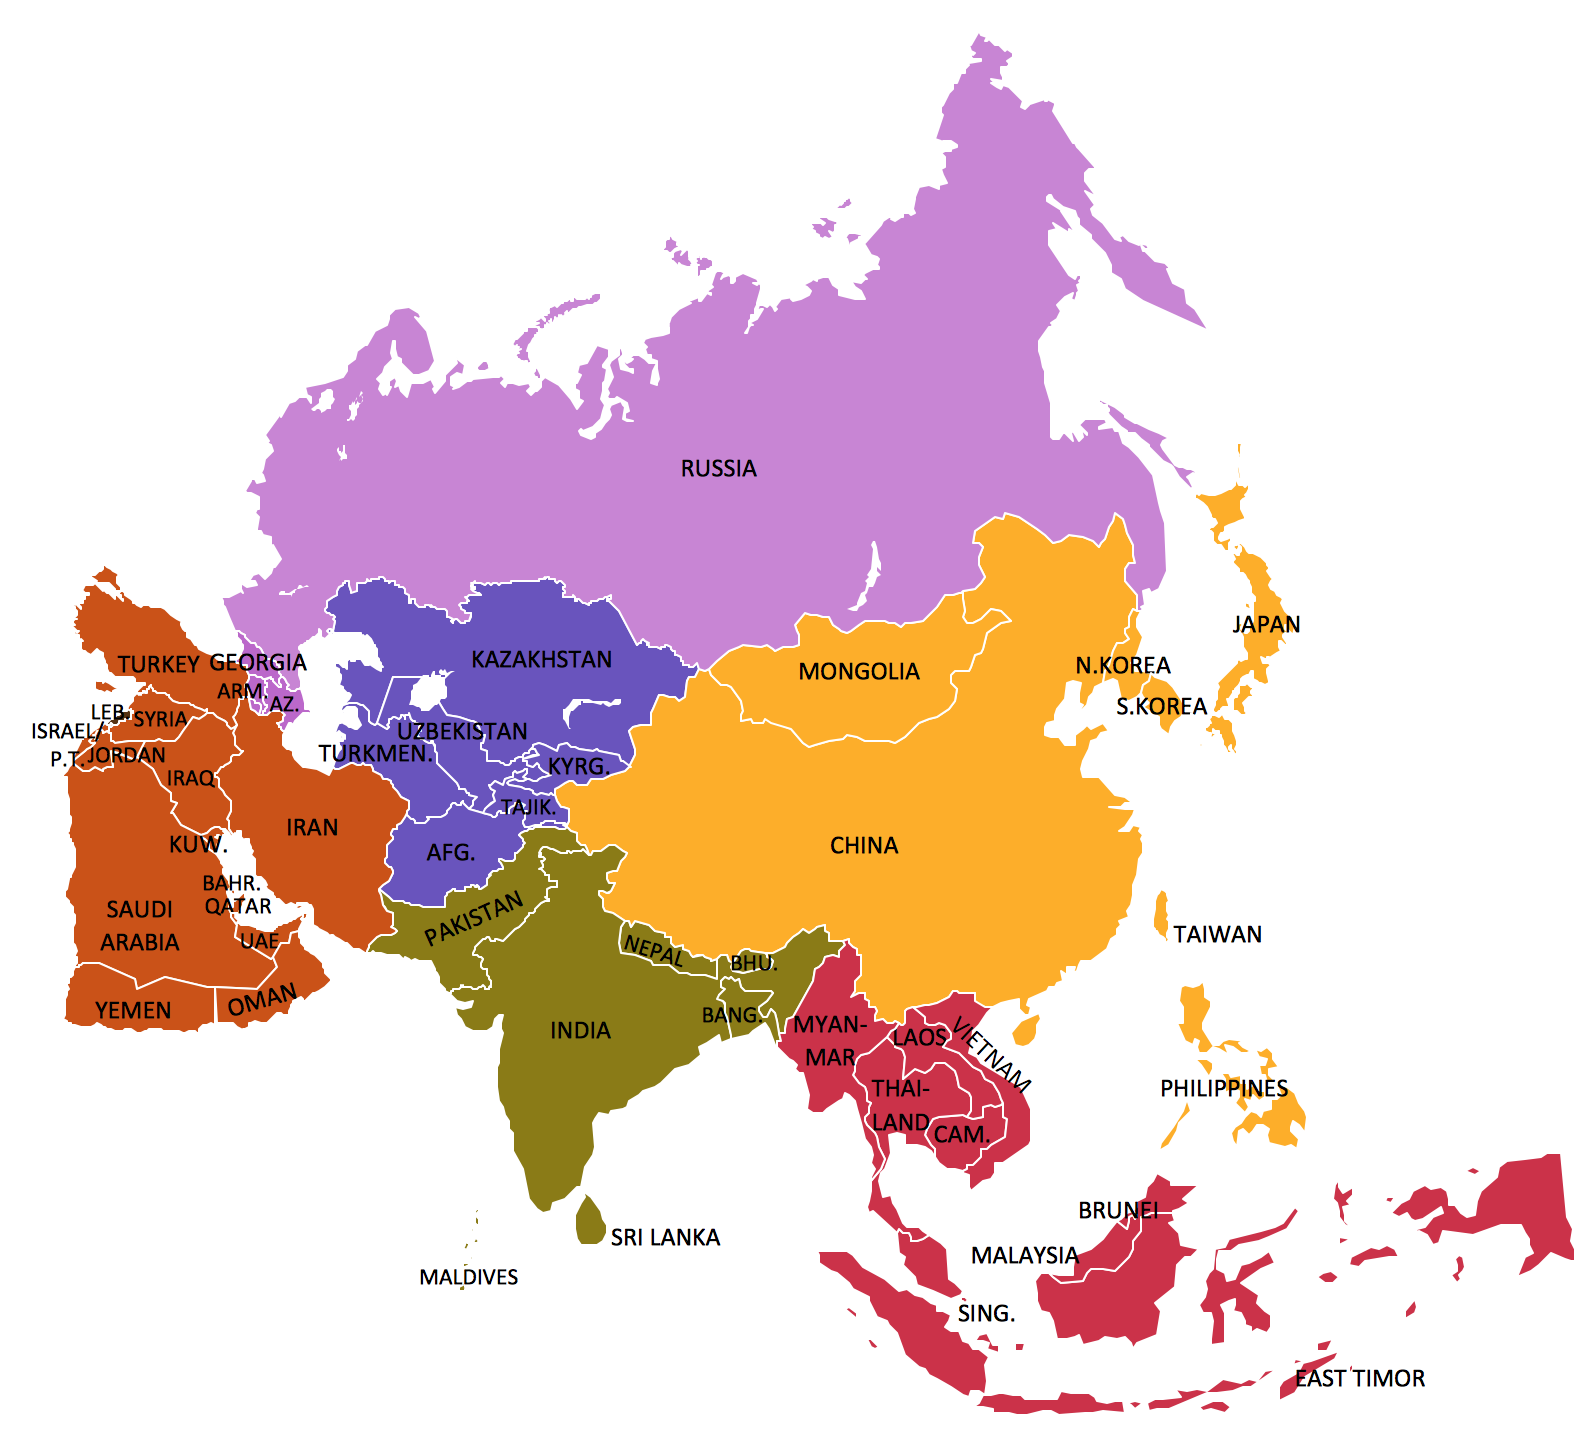
ConceptDraw is idea to draw the geological maps of Asia from the pre-designed vector geo map shapes. Use Geo Map Asia to draw thematic maps, geospatial infographics and vector illustrations for your business documents, presentations and websites.Geo Map - Canada - Nova Scotia
Nova Scotia is one of Canada's three Maritime provinces and constitutes one of the four Atlantic Canada provinces. The vector stencils library Nova Scotia contains contours for ConceptDraw PRO diagramming and vector drawing software. This library is contained in the Continent Maps solution from Maps area of ConceptDraw Solution Park.Geo Map - Canada - Saskatchewan
Saskatchewan is a prairie province in Canada, which has a total area of 651,900 square kilometres (251,700 sq mi) and a land area of 592,534 square kilometres (228,800 sq mi), the remainder being water area (covered by lakes/ponds, reservoirs and rivers). The vector stencils library Saskatchewan contains contours for ConceptDraw PRO diagramming and vector drawing software. This library is contained in the Continent Maps solution from Maps area of ConceptDraw Solution Park.- An Easy Diagram Of Population
- Population Explosion Flow Chart
- Population Chart Drawing
- Types of Flowchart - Overview | Flowchart Examples and Templates ...
- PM Easy | Basic Diagramming | Easy Flowchart Software | Easy ...
- Basic Flowchart Images. Flowchart Examples | How to Connect an ...
- Example Of Chart Diagram Of Showing World Population
- Line Chart Examples | Pictures of Graphs | Line Graph | Population ...
- Population Types Flowchart
- Influence Diagram Software | Influence Diagram | Types of ...
- Basic Diagramming | Line Chart | Line Chart Template for Word ...
- Image chart - The total financing of the Philippines from 2001-2010 ...
- Influence Diagram Software | Influence Diagram | Total Quality ...
- Bar Graph Of Population Growth Rate
- Basic Diagramming | Business Diagram Software | ER Diagrams ...
- Line Graph Of Population
- Create Graphs and Charts | Pie Chart Examples and Templates ...
- How to Create a Social Media DFD Flowchart | Social Ecological ...
- Examples of Flowcharts , Org Charts and More | Business Report Pie ...
- Barrie population - Picture bar graph | Picture graphs - Vector ...


