Positioning Map
ConceptDraw DIAGRAM is a powerful diagramming and vector drawing software. Extended with Matrices Solution from the Marketing Area of ConceptDraw Solution Park it became the best software for quick and easy designing various types of Matrix Diagrams, including Positioning Map.Risk Positioning Diagram
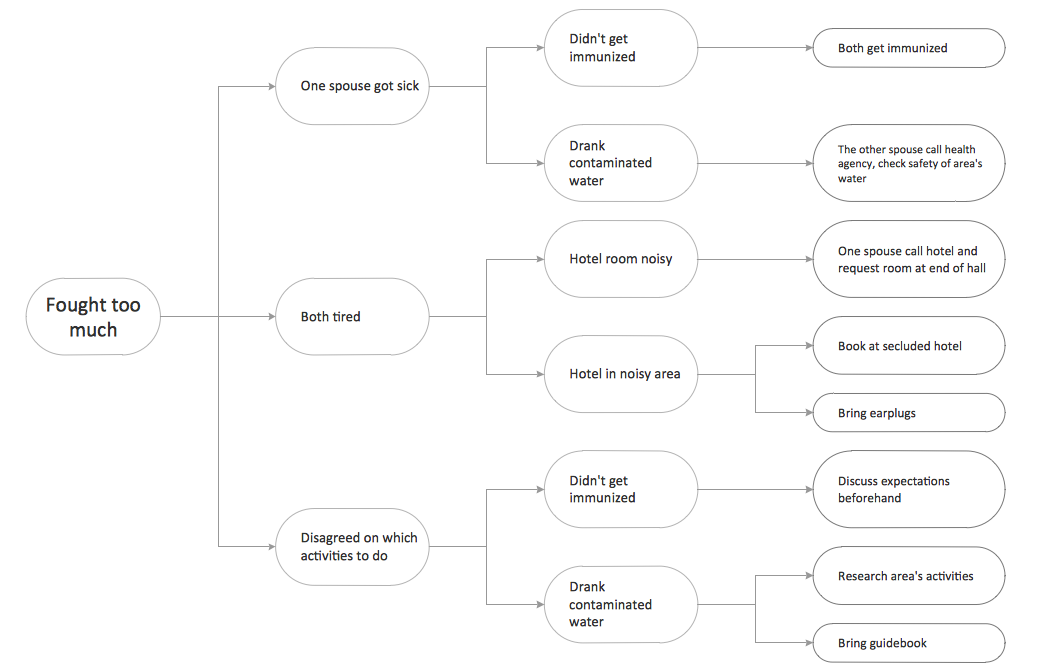
Risk Positioning Diagram - This sample was created in ConceptDraw DIAGRAM diagramming and vector drawing software using the Seven Management and Planning Tools Solution from the Business Productivity area of ConceptDraw Solution Park. This sample shows the Risk positioning diagram. There are visually displayed problems and solutions near them. You can view and analyze the causations and solutions.Infield Positioning for Baseball Situations
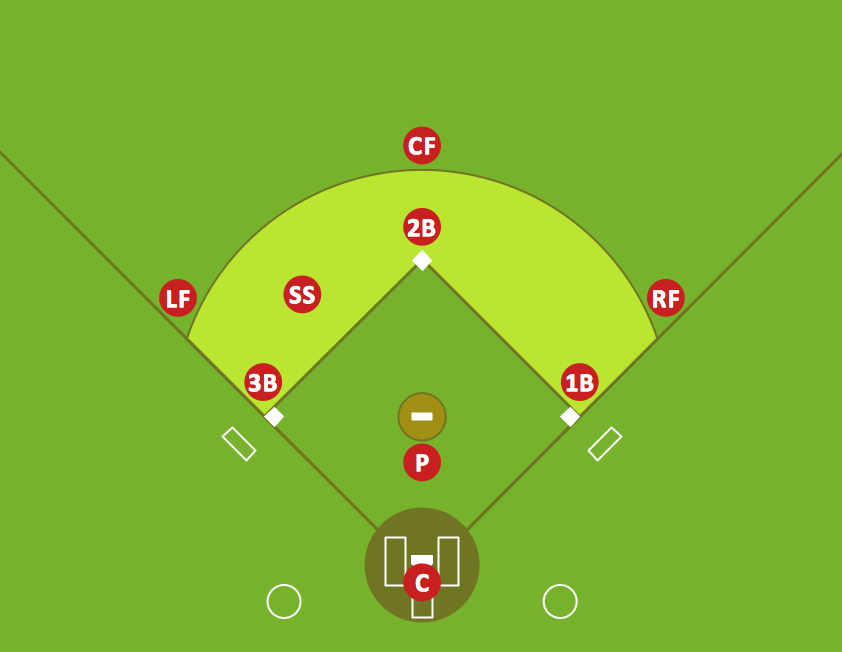
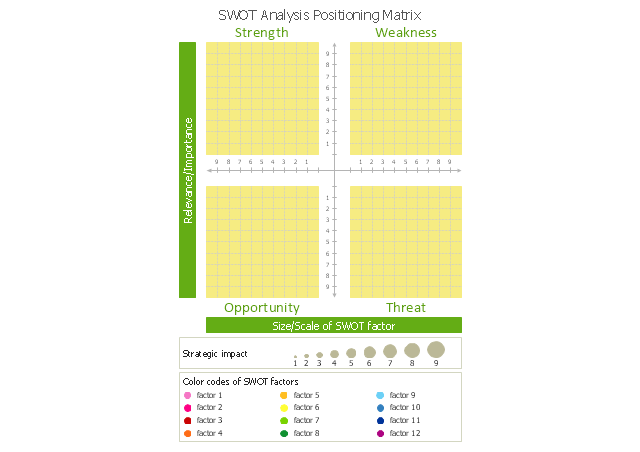
Infield Positioning for Baseball Situations - Baseball is very interesting and popular sport game. As each sport game it includes large quantity of game situations, positions and rules. If you are baseball coach or fan, you need convenient and useful software to design the baseball-related diagrams. In this case ConceptDraw DIAGRAM diagramming and vector drawing software is a real godsend for you!This SWOT analysis matrix template helps you in positioning of SWOT factors as bubbles on bubble chart by size/ scale (X axis) and relevance/ importance (Y axis). The diameter of bubbles shows strategic impact of SWOT factors.
The template "SWOT analysis positioning matrix" for the ConceptDraw PRO diagramming and vector drawing software is included in the SWOT Analysis solution from the Management area of ConceptDraw Solution Park.
The template "SWOT analysis positioning matrix" for the ConceptDraw PRO diagramming and vector drawing software is included in the SWOT Analysis solution from the Management area of ConceptDraw Solution Park.
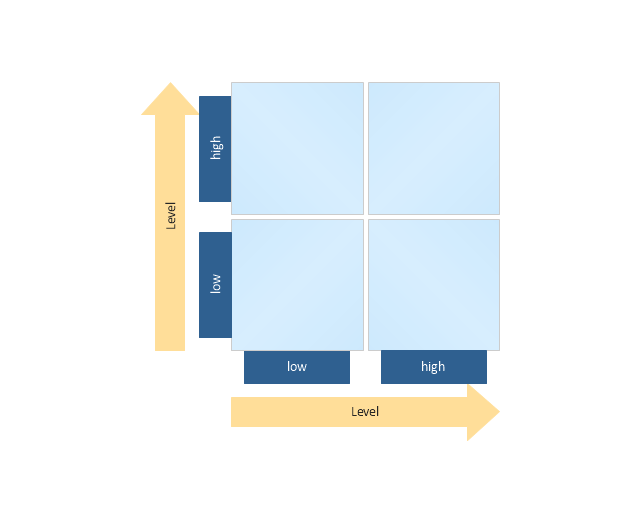
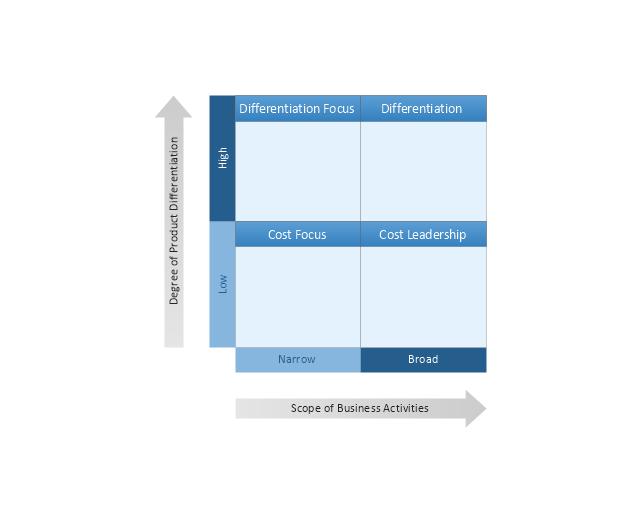
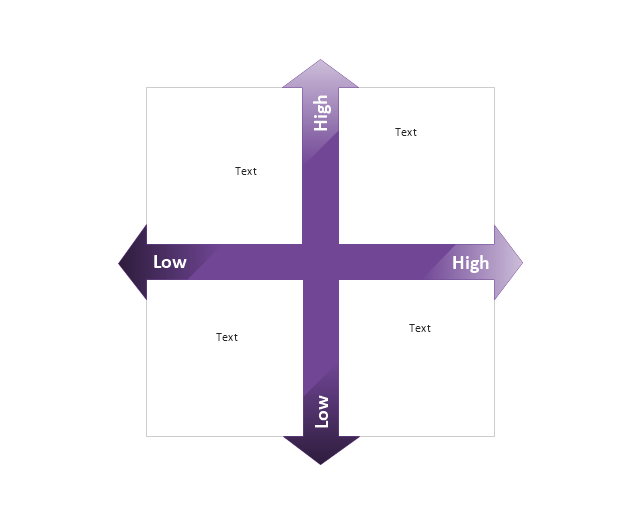
In marketing perceptual or positioning maps are used for developing the market positioning strategy for product or service.
"Perceptual mapping is a diagrammatic technique used by asset marketers that attempts to visually display the perceptions of customers or potential customers. Typically the position of a product, product line, brand, or company is displayed relative to their competition." [Perceptual mapping. Wikipedia]
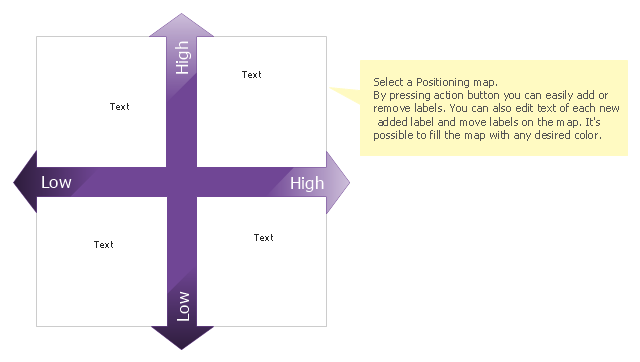
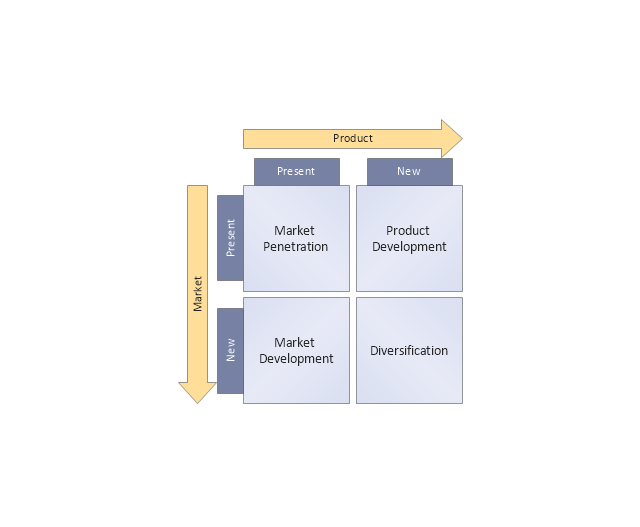
This positioning map diagram example was created using the ConceptDraw PRO diagramming and vector drawing software extended with the Matrices solution from the Marketing area of ConceptDraw Solution Park.
A Positioning Map is a great tool to set yourself apart from your competition and to determine where competitors are lagging behind when looking at what is important to your ideal customer. A Positioning Map can represent products and services together. This permits one to compare and contrast these two items in relation to one another.
The main strength of this tool is to help in making a decision on a competitive position that enables you to distinguish your products from the offerings of your competition.
The use a Positioning Map will help you build a strategy that gets you closer to your target.
The template "Positioning map" for the ConceptDraw PRO diagramming and vector drawing software is included in the Matrices solution from the Marketing area of ConceptDraw Solution Park.
Swot Analysis Examples for Mac OSX
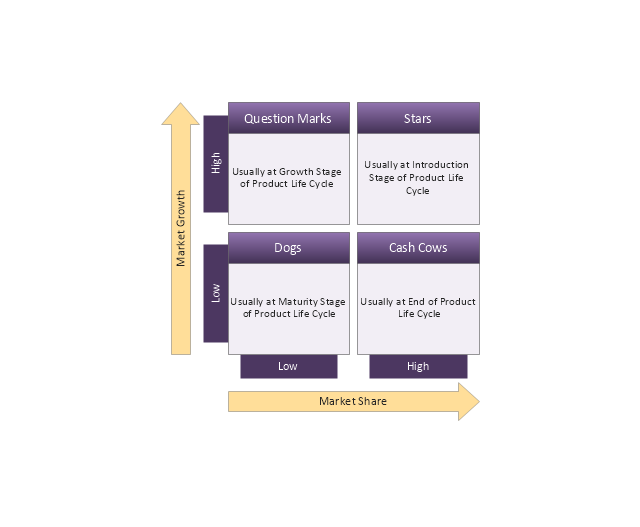
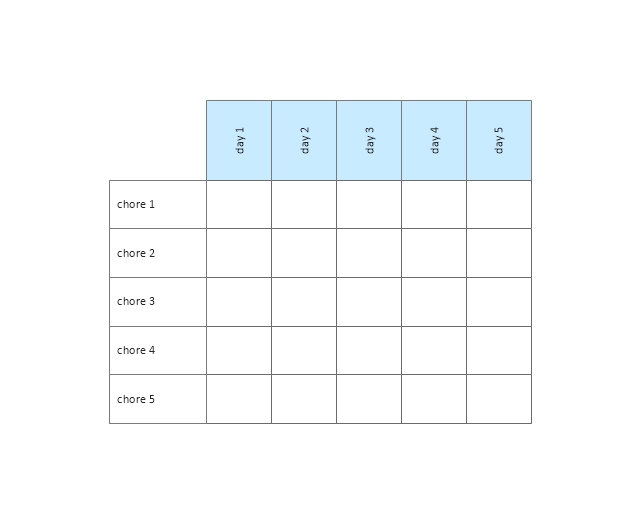
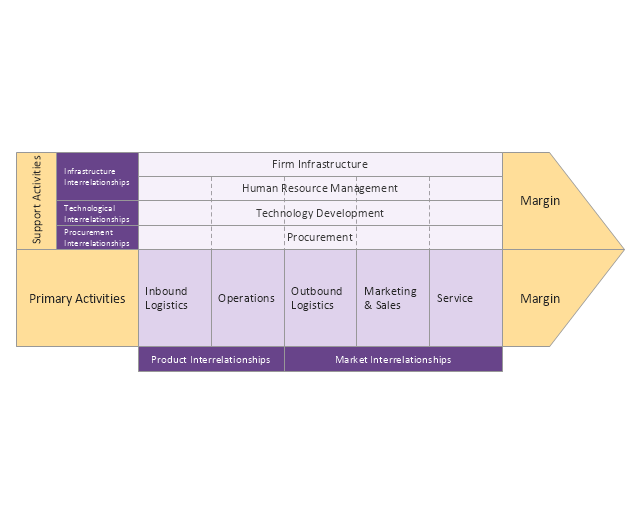
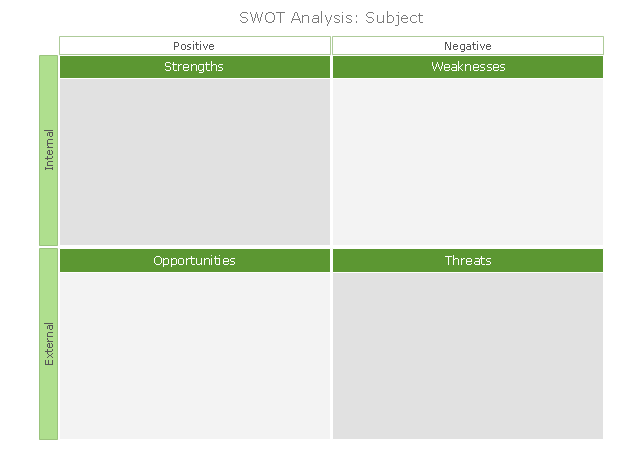
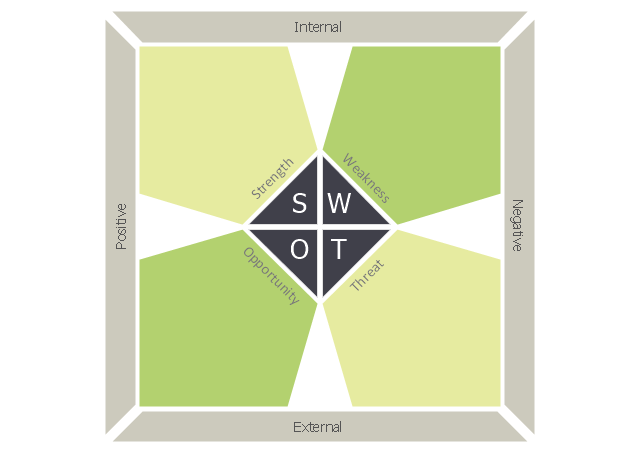
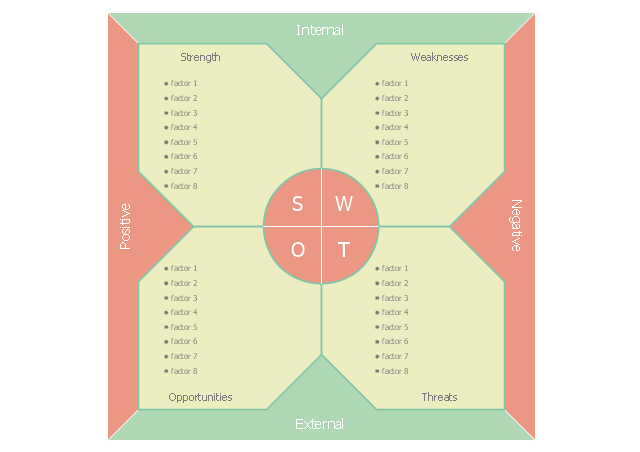
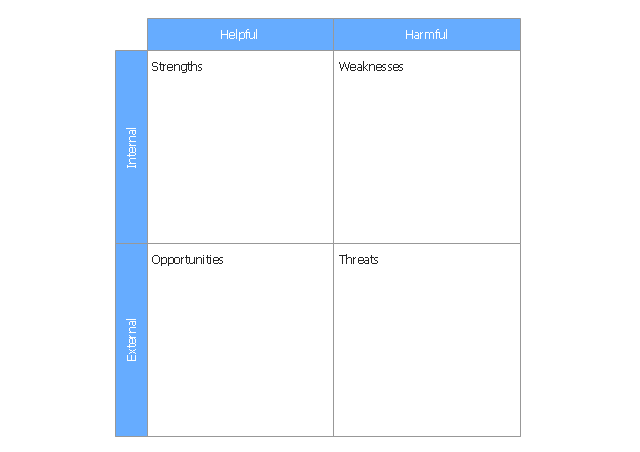
SWOT is an acronym of the words Strengts, Weaknesses, Opportunities and Тhreats. SWOT analysis is used to show the real situation and prospects of the company on the market, the internal environment of the company is reflected by S and W, and external by O and T. SWOT analysis is a quality tool for structuring available information, which is successfully used in the process of strategy planning, it helps analysts in formulation recommendations on the basis of collected information and data, structured in a form of SWOT Matrix. The SWOT analysis is effective and simple in use, however its results in great depend on the completeness and quality of initial information, from the depth of understanding of the current state and development trends of the market, and also from the used software. ConceptDraw DIAGRAM extended with powerful tools of SWOT and TOWS Matrix Diagrams solution, containing templates and SWOT analysis examples for Mac OSX and Windows, is ideal software for creation professional SWOT Matrices and SWOT Analysis Matrices.The vector stencils library "Matrices" contains 10 templates of marketing matrix diagrams and charts.
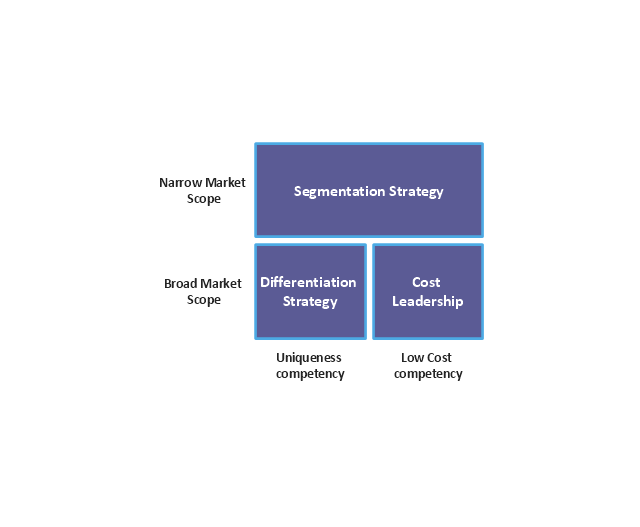
Use these templates to create your marketing matrices in the ConceptDraw PRO diagramming and vector drawing software extended with the Matrices solution from the Marketing area of ConceptDraw Solution Park.
Use these templates to create your marketing matrices in the ConceptDraw PRO diagramming and vector drawing software extended with the Matrices solution from the Marketing area of ConceptDraw Solution Park.
The vector stencils library "Matrices" contains 10 templates of marketing matrix diagrams and charts.
Use these templates to create your marketing matrices in the ConceptDraw PRO diagramming and vector drawing software extended with the Matrices solution from the Marketing area of ConceptDraw Solution Park.
Use these templates to create your marketing matrices in the ConceptDraw PRO diagramming and vector drawing software extended with the Matrices solution from the Marketing area of ConceptDraw Solution Park.
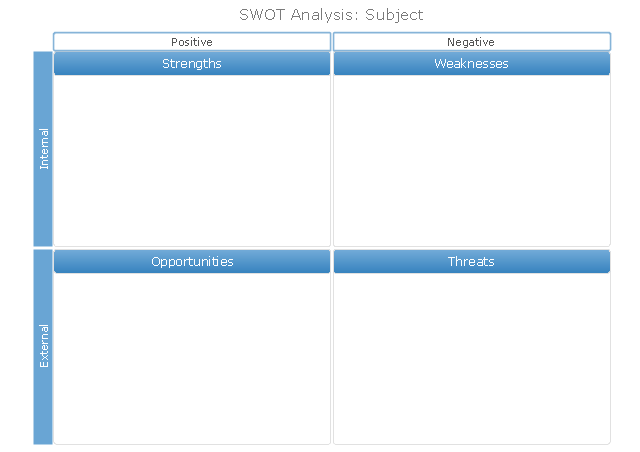
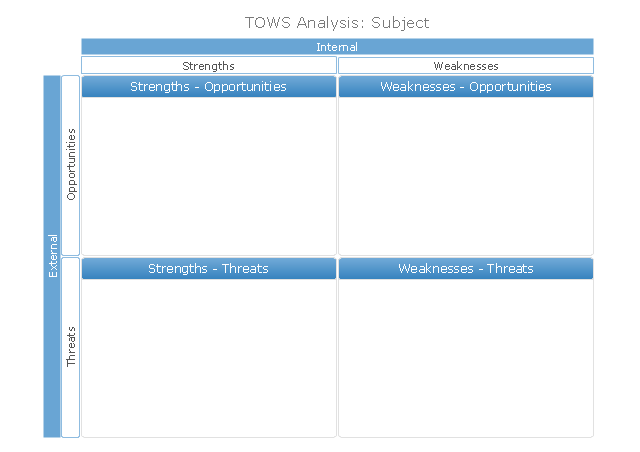
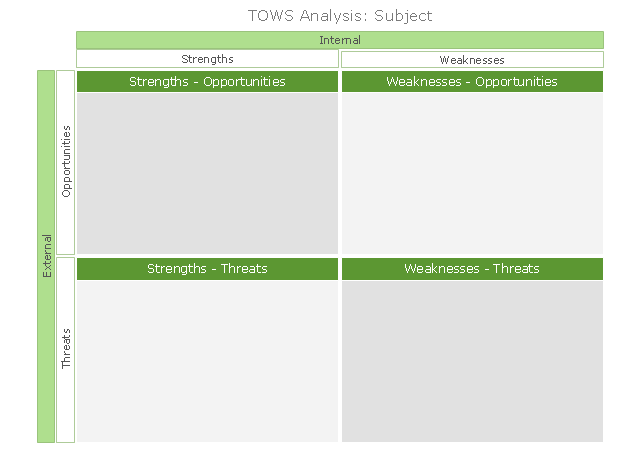
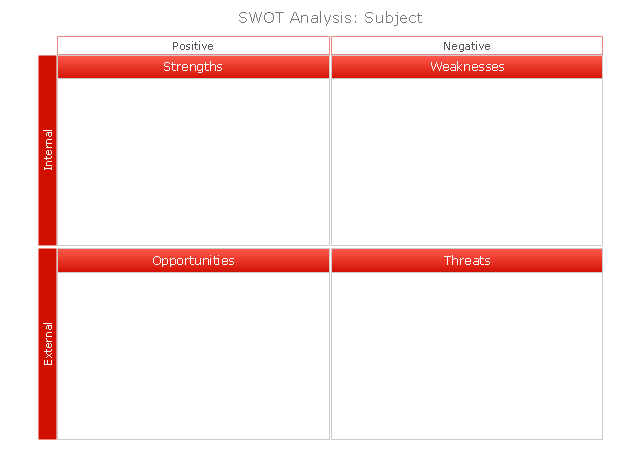
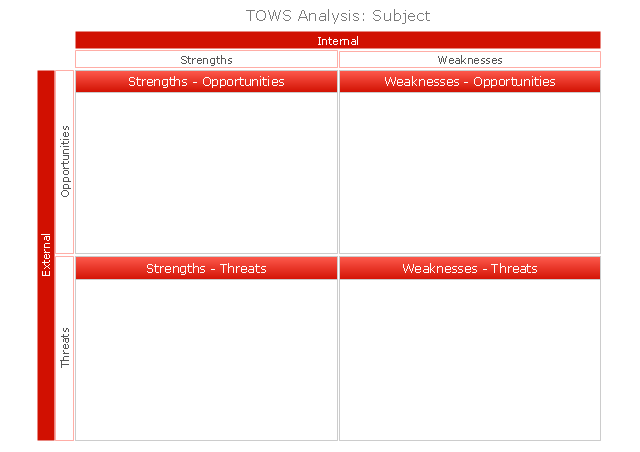
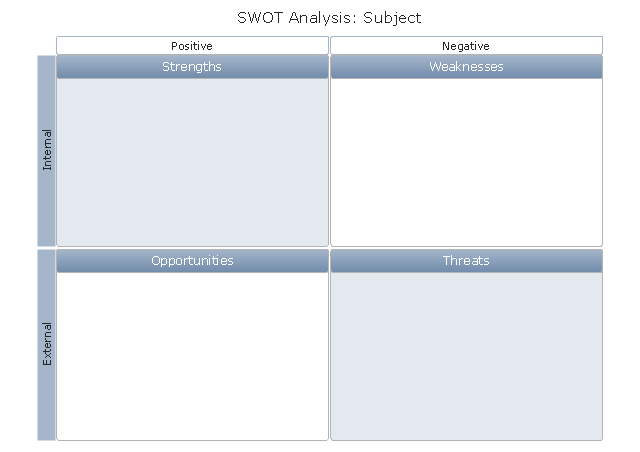
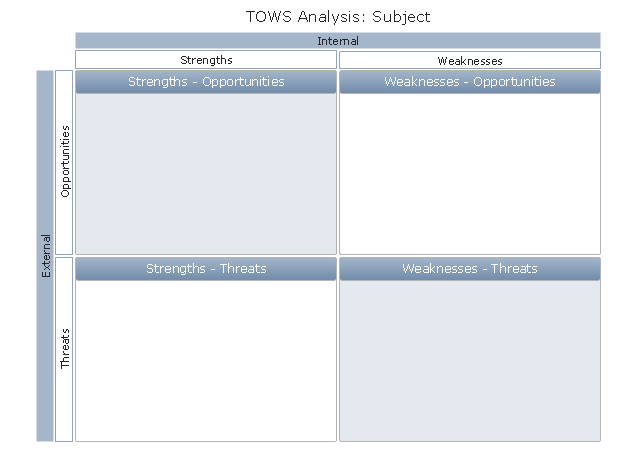
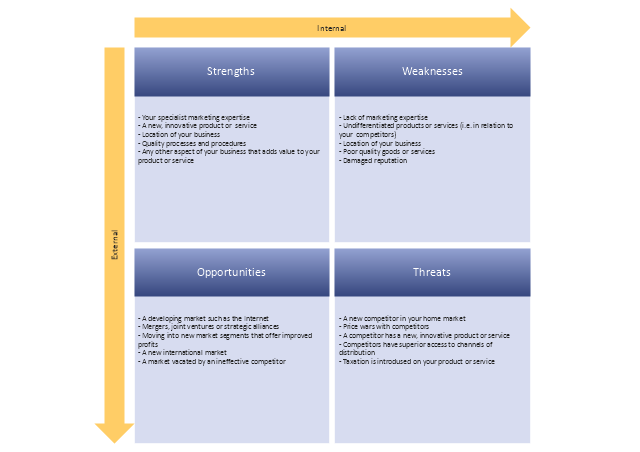
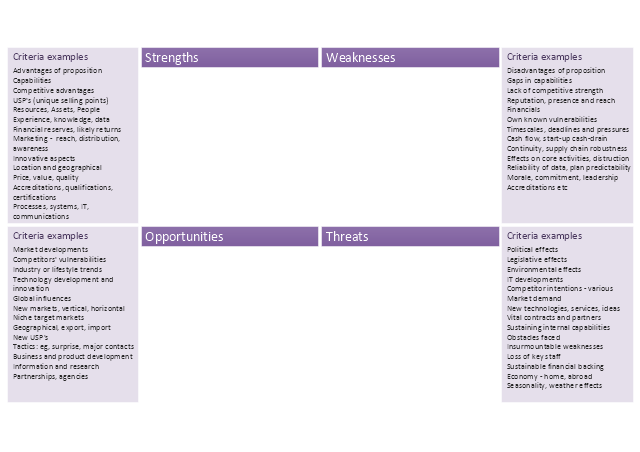
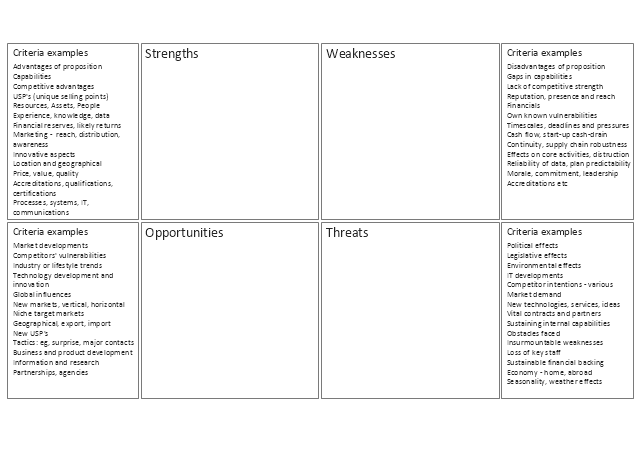
The vector stencils library "SWOT" contains 19 SWOT and TOWS analysis matrix diagram templates. Use it to create your SWOT and TOWS matrices in the ConceptDraw PRO diagramming and vector drawing software extended with the SWOT Analysis solution from the Management area of ConceptDraw Solution Park.
"The Global Positioning System (GPS) is a space-based satellite navigation system that provides location and time information in all weather conditions, anywhere on or near the Earth where there is an unobstructed line of sight to four or more GPS satellites. The system provides critical capabilities to military, civil and commercial users around the world. It is maintained by the United States government and is freely accessible to anyone with a GPS receiver." [Global Positioning System. Wikipedia]
This GPS operation diagram example was created using the ConceptDraw PRO diagramming and vector drawing software extended with the Telecommunication Network Diagrams solution from the Computer and Networks area of ConceptDraw Solution Park.
This GPS operation diagram example was created using the ConceptDraw PRO diagramming and vector drawing software extended with the Telecommunication Network Diagrams solution from the Computer and Networks area of ConceptDraw Solution Park.
SWOT Analysis
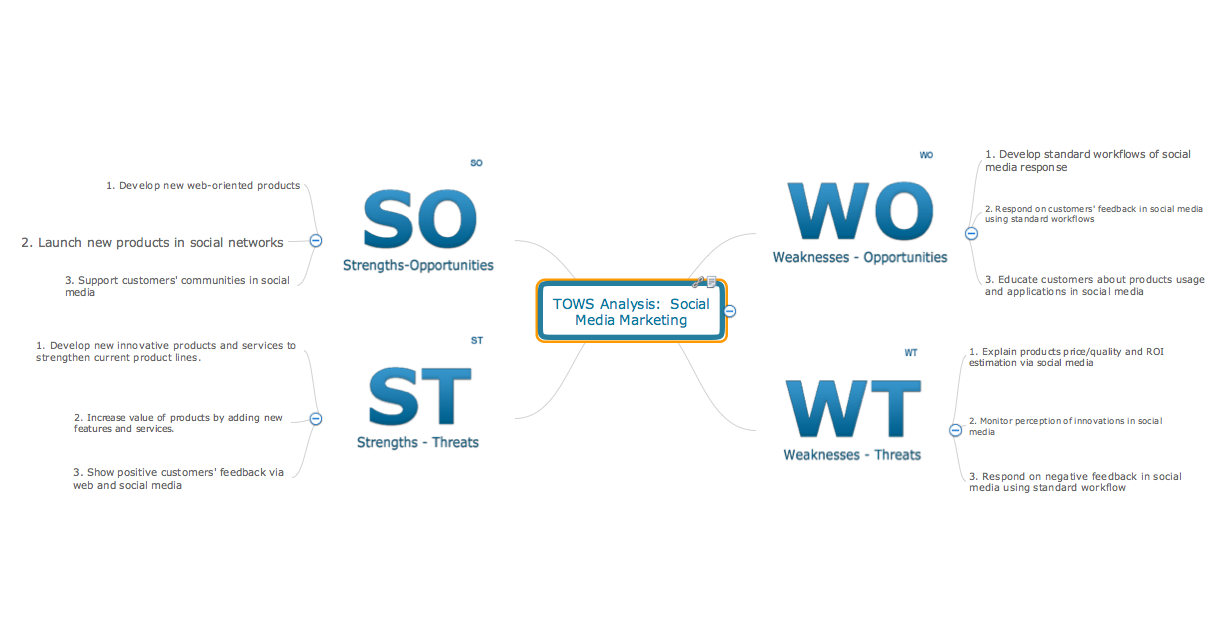
Using mind mapping to define Strengths, Weaknesses/Limitations, Opportunities, and Threats is a natural fit. SWOT mind maps quickly capture your ideas, and allow you to add and subtract easily, ensuring you don’t overlook any important items.Competitor Analysis
Competitor analysis is a first and obligatory step in elaboration the proper corporate marketing strategy and creating sustainable competitive advantage. Use powerful opportunities of numerous solutions from ConceptDraw Solution Park for designing illustrative diagrams, charts, matrices which are necessary for effective competitor analysis.Export from ConceptDraw MINDMAP into MS Word Document
ConceptDraw Word Exchange solution gives you the ability to export mind maps to MS Word. It also allows stylizing the resulting document by using a custom MS Word template.
The vector stencils library "Matrices" contains 10 templates of marketing matrix diagrams and charts.
Use these templates to create your marketing matrices in the ConceptDraw PRO diagramming and vector drawing software extended with the Matrices solution from the Marketing area of ConceptDraw Solution Park.
Use these templates to create your marketing matrices in the ConceptDraw PRO diagramming and vector drawing software extended with the Matrices solution from the Marketing area of ConceptDraw Solution Park.
Software for Creating SWOT Analysis Diagrams
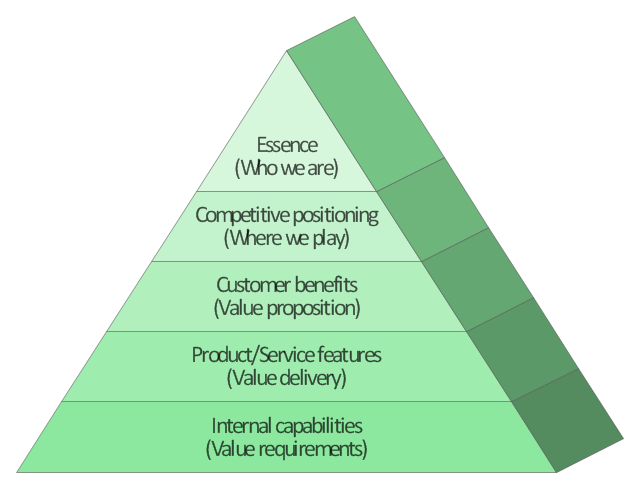
SWOT analysis or alternatively SWOT matrix is a simple, but useful tool for auditing an organization and its environment, for analyzing its strengths and weaknesses, opportunities and threats that can appear. A SWOT analysis can be executed for an industry, product, place, or person. It is a first stage of planning which helps the marketing specialists to focus on the key issues. SWOT analysis includes the identification of objectives of the project or business venture, specification of internal and external factors favorable and vice versa unfavorable for achievement the designated goal. ConceptDraw DIAGRAM ector graphics software enhanced with SWOT and TOWS Matrix Diagrams solution from Management area of ConceptDraw Solution Park is a powerful software for creating SWOT analysis diagrams. Ready-to-use templates, samples and examples allow create your own TOWS and SWOT matrices in minutes. The integration between ConceptDraw MINDMAP and ConceptDraw DIAGRAM applications will be also helpful for easier drawing.This market value pyramid diagram has 5 levels:
1) Essence (Who we are),
2) Competitive positioning (Where we play),
3) Customer benefits (Value proposition),
4) Product / Service features (Value delivery),
5) Internal capabilitiea (Value requirements).
Use this triangular scheme to develop your marketing strategy.
"Market value or OMV (Open Market Valuation) is the price at which an asset would trade in a competitive auction setting. Market value is often used interchangeably with open market value, fair value or fair market value, although these terms have distinct definitions in different standards, and may differ in some circumstances." [Market value. Wikipedia]
The triangle chart example "Market value" was created using the ConceptDraw PRO diagramming and vector drawing software extended with the Pyramid Diagrams solution from the Marketing area of ConceptDraw Solution Park.
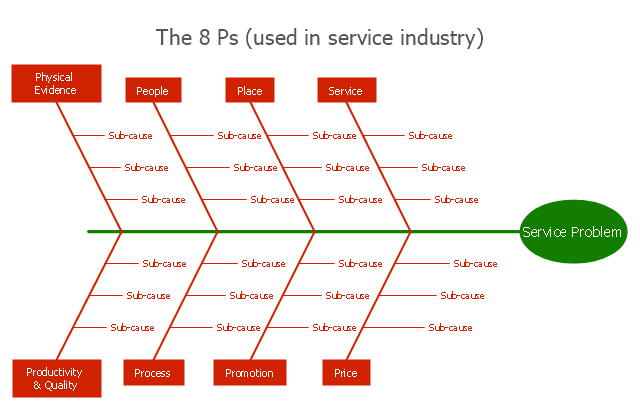
"Causes in the diagram are often categorized, such as to ...
The 7 Ps (used in marketing industry):
(1) Product/ Service;
(2) Price;
(3) Place;
(4) Promotion;
(5) People/ personnel;
(6) Positioning;
(7) Packaging. " [Ishikawa diagram. Wikipedia]
This 8 Ps Ishikawa diagram (service cause and effect diagram) template is included in the Fishbone Diagram solution from the Management area of ConceptDraw Solution Park.
Map Directions
ConceptDraw DIAGRAM software extended with Directional Maps Solution from the Maps Area of ConceptDraw Solution Park offers you the set of useful tools for easy drawing map directions, directional maps, road maps, navigation schemes, transit maps of any complexity, etc.What is SWOT Analysis?
What is SWOT analysis? The SWOT abbreviation is formed from the reduction of four words - strength, weakness, opportunity and threat, on which is based the SWOT analysis. It is a structured planning method that involves the analysis of the situation within a company, as well as analysis of external factors and the situation on the market. SWOT analysis emphasizes that the strategy must to combine the internal capabilities and external situation the best way as possible. The use of SWOT analysis allows to systemize all available information and apply this clear picture to make informed decisions concerning to your business development. In fact, SWOT analysis is an intermediate step between the formulation of goals and the statement of problem. The main goal is a sustainability and improvement of efficiency of business functioning. When you have an installed ConceptDraw DIAGRAM software, it gives you a lot of benefits in SWOT analysis. Use the powerful drawing tools and capabilities of the SWOT and TOWS Matrix Diagrams solution to hold the SWOT analysis effectively and with pleasure.- Positioning Map | Positioning map | What is SWOT Analysis in ...
- Positioning map | Market Positioning Diagram
- Positioning Map Template Word
- Competitor Analysis | Positioning map | Positioning Map | Market ...
- Positioning map
- SWOT analysis positioning matrix - Template | Positioning Map ...
- Infield Positioning for Baseball Situations | Positioning map ...
- Matrices | Positioning map | Diagram Positioning Strategy Marketing
- Positioning map | Positioning Map | Competitor Analysis ...
- Risk Positioning Diagram | Infield Positioning for Baseball Situations ...
- Positioning map | Competitor Analysis | Service 8 Ps fishbone ...
- Positioning Map | SWOT analysis positioning matrix - Template ...
- SWOT analysis positioning matrix - Template | Positioning map ...
- SWOT analysis positioning matrix - Template | How To Create a ...
- Positioning map - Template
- Competitor Analysis | Positioning map | Brand essence model ...
- Positioning Map | Positioning map | Competitor Analysis | Market ...
- Positioning Map | Basketball Court Diagram and Basketball ...
- SWOT analysis positioning matrix - Template | Matrices | SWOT and ...

