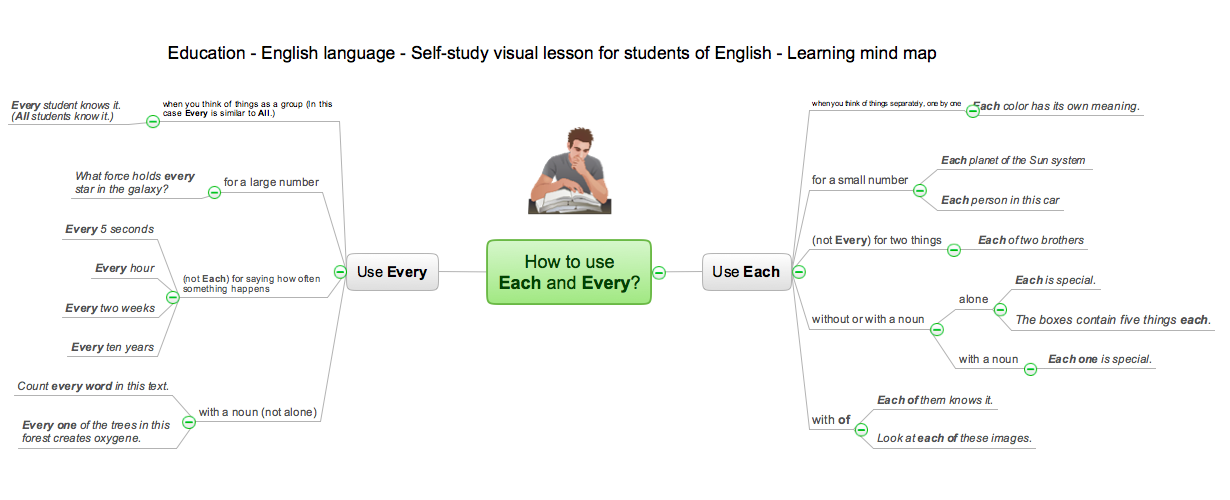
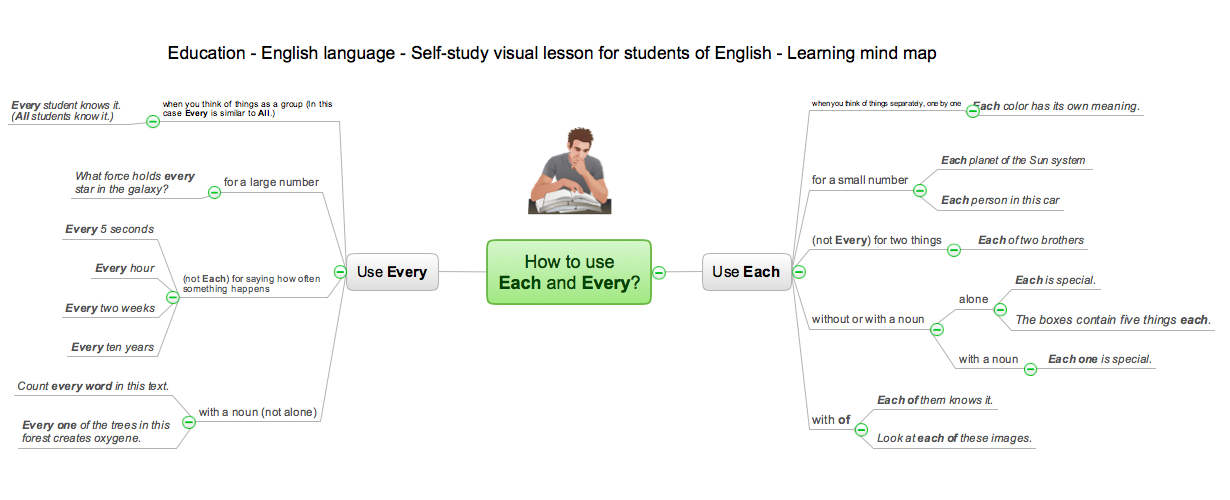
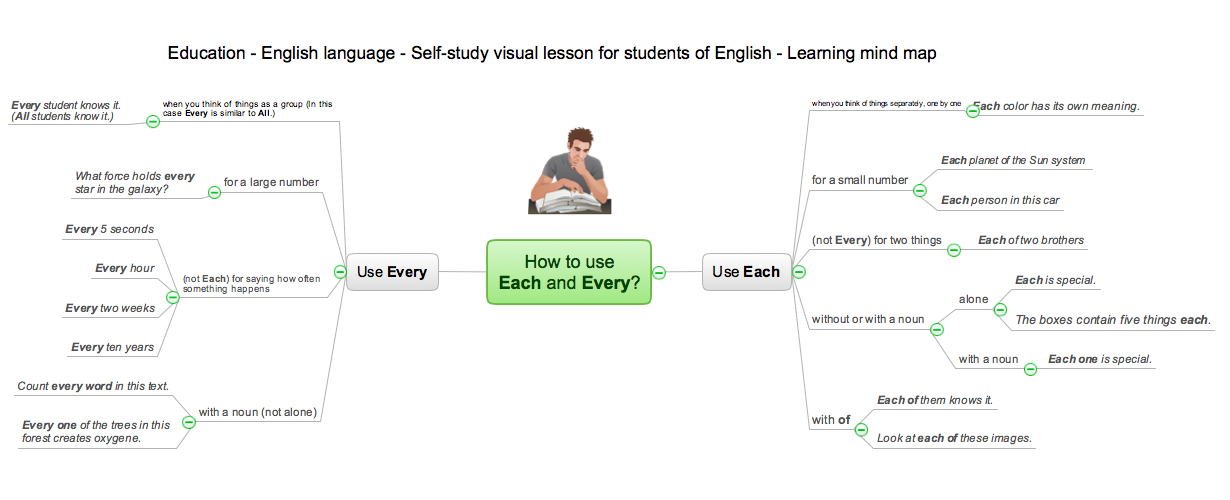
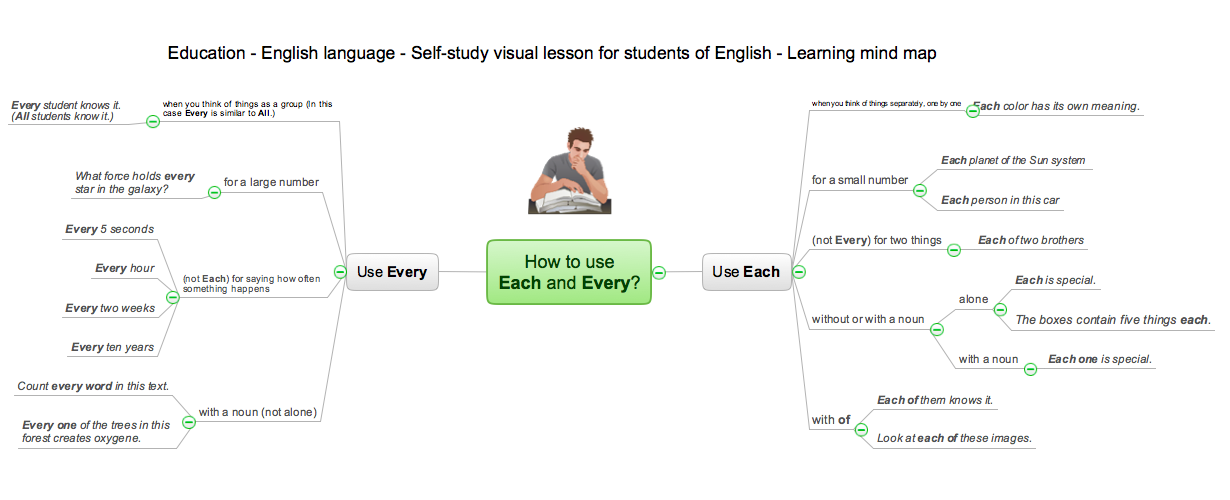
eLearning - Easy English on Skype
Learning English On-line using Skype. Mind map as a presentation makes it powerful tool for eLearning. E-Learning tools are slideshows, presentations, videos, mind maps.
eLearning: Speaking English
Innovative Education Solutions: English Speaking Online Classroom. How to study Online with live teacher at real time.
How Teachers Use Skype for eLearning
Teachers use Skype in the classroom to enrich experiences for students. Using mind mapping software in virtual classrooms for brainstorming and presentation make an effective way to gather information and track results.
eLerning for Skype
How to use Skype in the Classroom: Tips for effective teaching online for organizations of all sizes. Software for online training and virtual classroom that provides an interactive learning environment.
How it works : eLearning
Online Tools for eLearning: How to Make Online Trainings. Remote Presentations via Skype. Mind map that allows professors and teachers at all levels of the education collaborate in real time.
eLearning - International Teaching Community
eLearning Solutions for Teachers: Connecting Students Worldwide. Free Platform for Remote Learning. Skype as a remote education tool. Remote collaboration and presentation.
 UK Map
The Map of UK solution contains collection of professionally designed samples and scalable vector stencil graphics maps, representing the United Kingdom counties, regions and cities. Use the Map of UK solution from ConceptDraw Solution Park as the base fo
How to show a mind map presentation via Skype
Video tutorials on ConceptDraw products. Try it today!HelpDesk
How to Create a Fishbone (Ishikawa) Diagram Quickly
A Fishbone (Ishikawa) diagram is also called cause-and-effect diagram. Fishbone diagram is often used in business to determine the cause of some problem. The diagram illustrates the main causes and sub-causes leading to an event. The main goal of the Fishbone diagram is to illustrate in a graphical way the relationship between a given outcome and all the factors that influence this outcome. The complete diagram resembles a fish skeleton as its name implies. The ability to create a Fishbone Diagram is supported by the Fishbone Diagram solution. Use ConceptDraw MINDMAP for structuring data and then ConceptDraw DIAGRAM for generating a Fishbone Diagram from mind map structure.Language School E-Learning
E-Learning in Schools: Online Language Teaching tools. E-Learning software for remote presentations with Skype. Best practices for eLearning.
Work Order Process Flowchart. Business Process Mapping Examples
The business process is a set of actions or tasks which are undertaken by an organization for production some goods or services, they are then offered for the customers and are ordered by them. Process Flowcharts and Order Process Flowcharts are sufficiently prevalent, well known and actively used in variety of fields of life, business and science. They are constructed using the common standardized symbols, thus are clear and understandable for all. They help effectively represent the processes, determine the order in which the process activities happen, document the order processes, and also effectively analyze the processes with a goal to increase their efficiency. Create your own Process Flowcharts, Order Process Flowcharts, Cross-Functional Flow Charts representing the order processing steps using powerful drawing tools of ConceptDraw DIAGRAM software and variety of predesigned vector objects from the libraries of Business Process Mapping Solution from Business Processes area of ConceptDraw Solution Park.Skype as eLearning Platform
eLearning Solutions: Free Platform for Remote Learning. Skype as a remote education tool. Digital Learning Technologies.
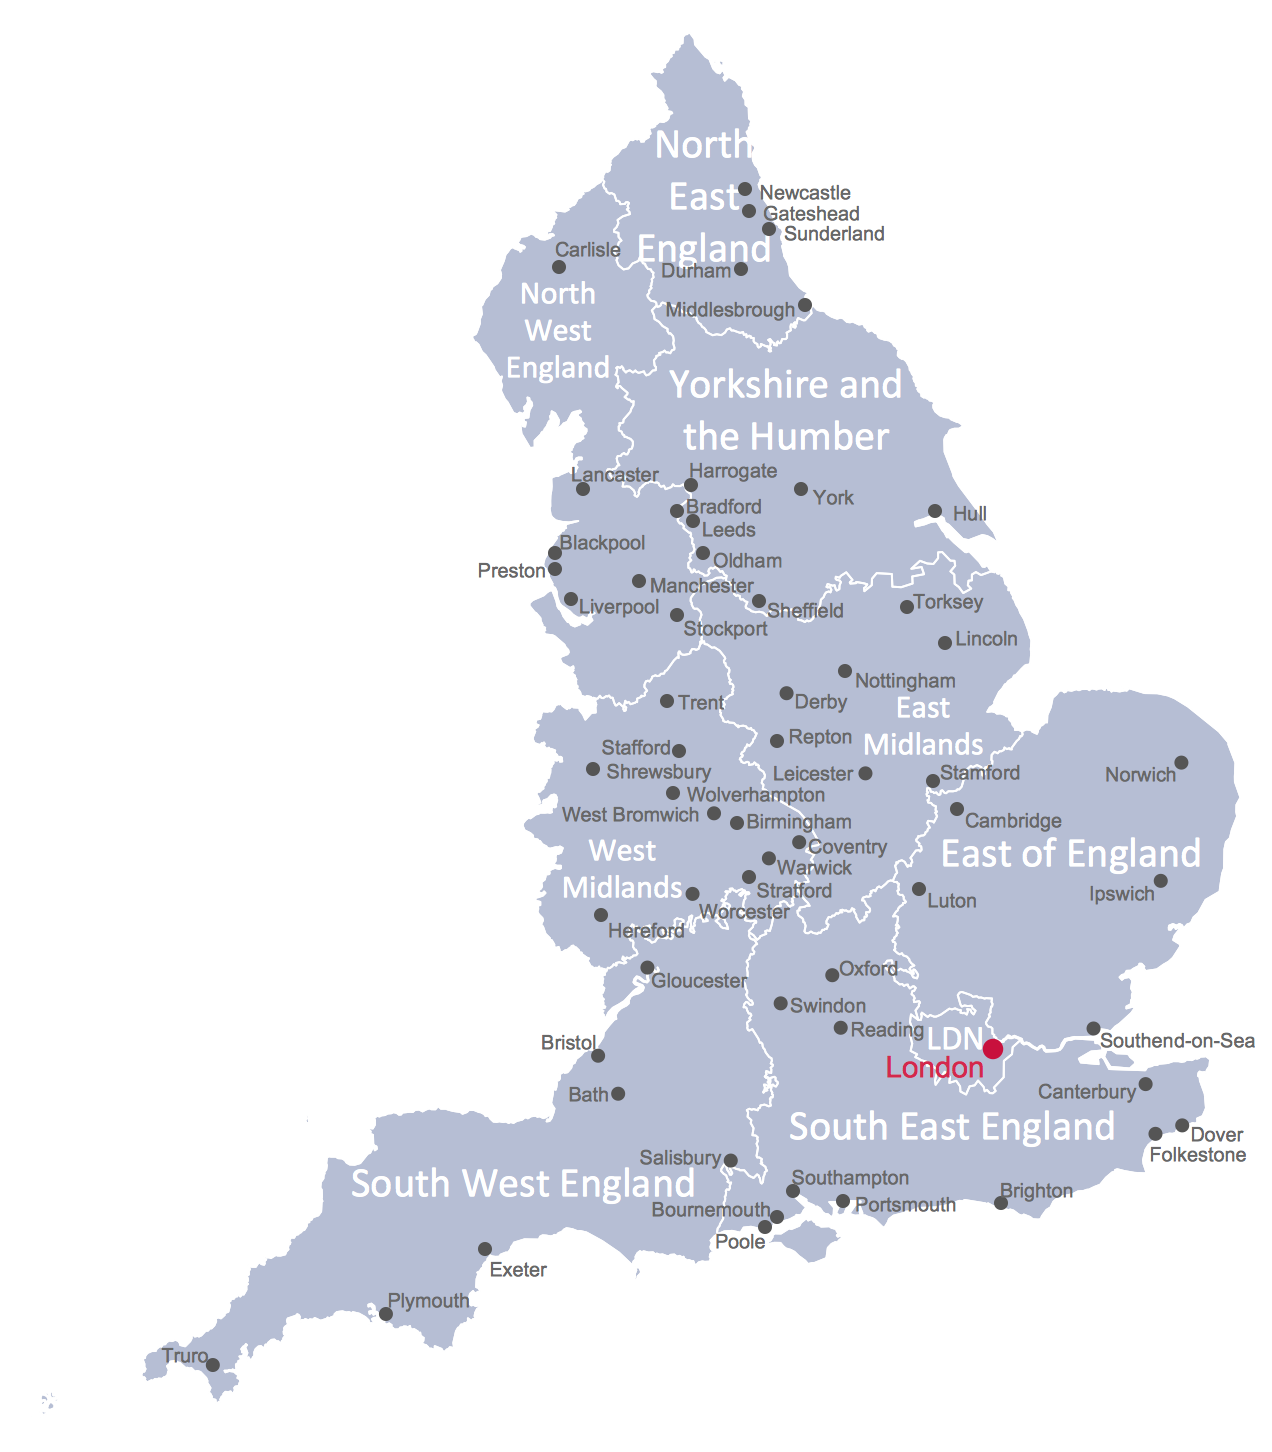
Map of England
England is a country that is part of the United Kingdom. It shares land borders with Scotland to the north and Wales to the west. Design of various maps, including the Map of England is usually complex and labor-intensive process. But now we have a possibility to create UK maps fast and easy thanks to the ConceptDraw DIAGRAM diagramming and vector drawing software enhanced with Map of UK Solution from the Maps Area of ConceptDraw Solution Park.HelpDesk
How to Add a Fishbone Diagram to PowerPoint Presentation
Fishbone (Ishikawa) diagram is often used in business to determine the cause of some problems. The easiest way to draw a Fishbone diagram is using ConceptDraw Fishbone Diagram solution.- How To Do A Mind Map In PowerPoint | Presenting a Slide Show to ...
- English Teacher Mind Map
- How to Create a PowerPoint ® Presentation from a Mind Map | How ...
- How To Do A Mind Map In PowerPoint | Apartment plan | Flat design ...
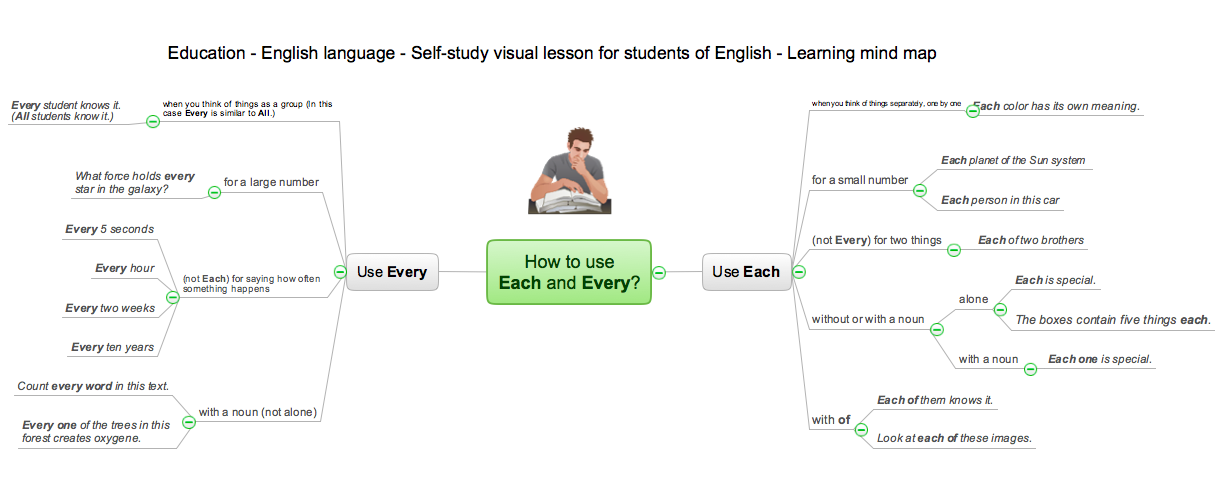
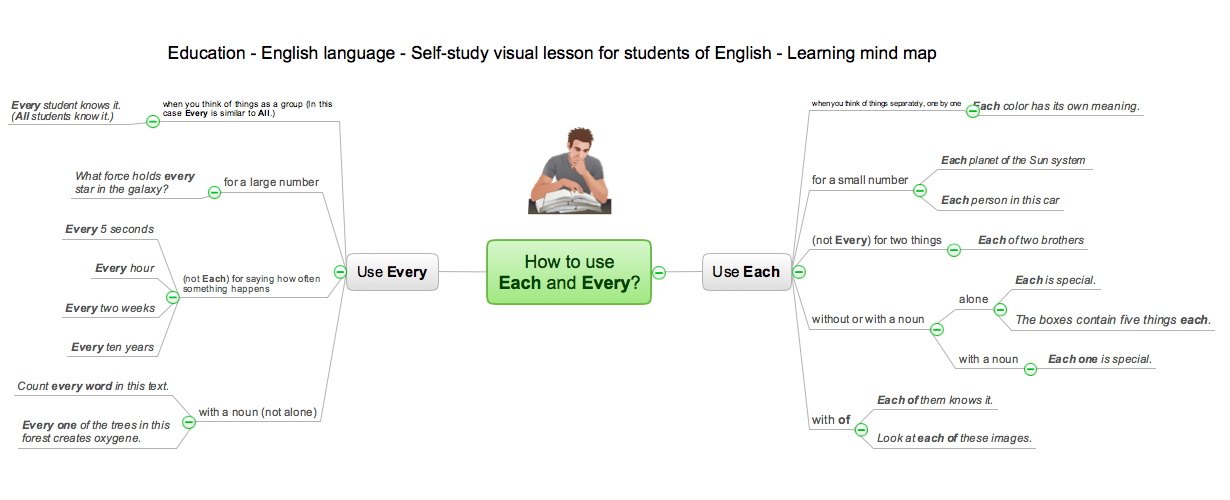
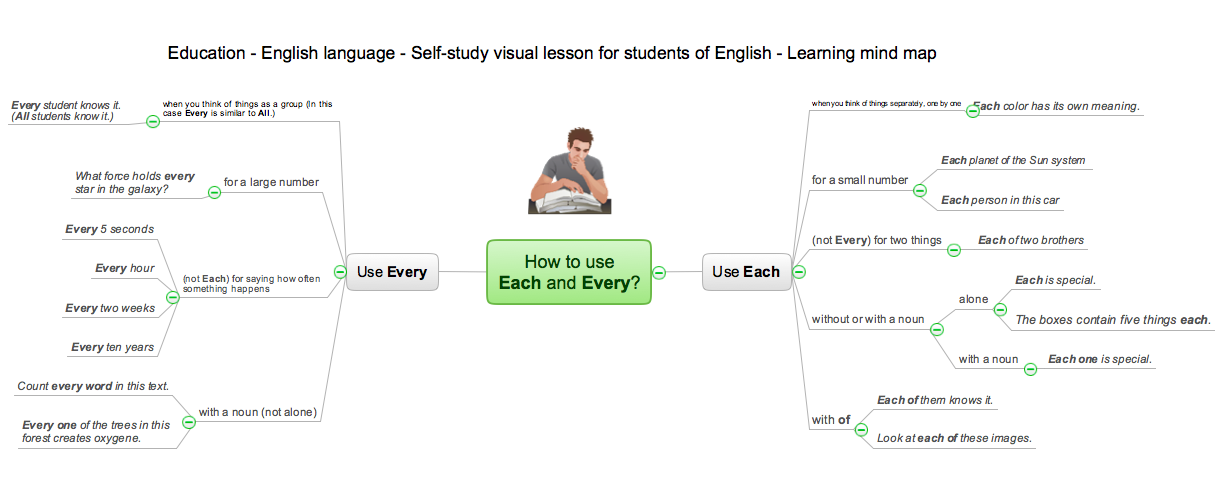
- Mindmap Each And Every
- Ppt On Online Brainstorming
- Mind Map Of English Education
- How To Do A Mind Map In PowerPoint | Looking at ConceptDraw ...
- Entity Life History Explain In System Analysis And Design Ppt
- Hamburger | Mind Map Food | Mind Mapping in the Quality ...
- Apartment plan | Flat design floor plan | How To Do A Mind Map In ...
- Europe Map Ppt Free
- Map Of Europe Powerpoint
- How to show a mind map presentation via Skype | How Teachers ...
- eLearning: Speaking English | eLearning - Easy English on Skype ...
- ERD Symbols and Meanings | How To Do A Mind Map In ...
- Draw Chemical Reactions In Powerpoint
- How Teachers Use Skype for eLearning | eLearning - Easy English ...
- How to Import a PowerPoint Presentation to ConceptDraw MINDMAP
