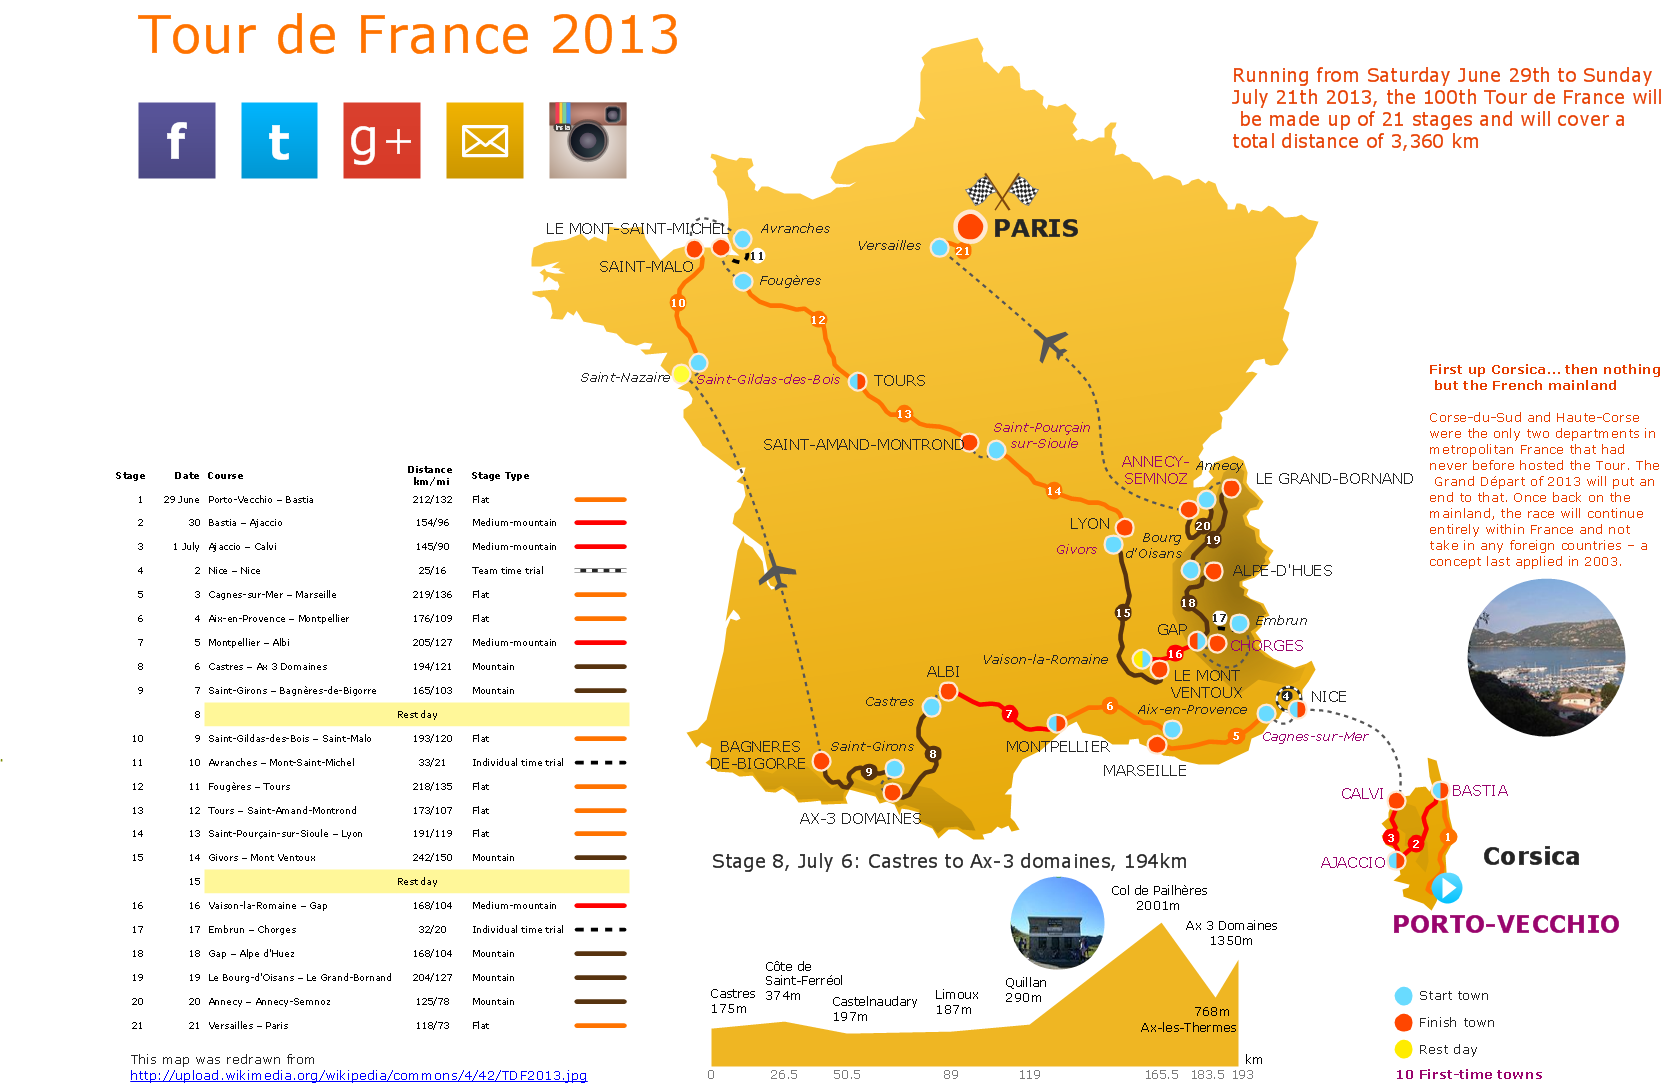
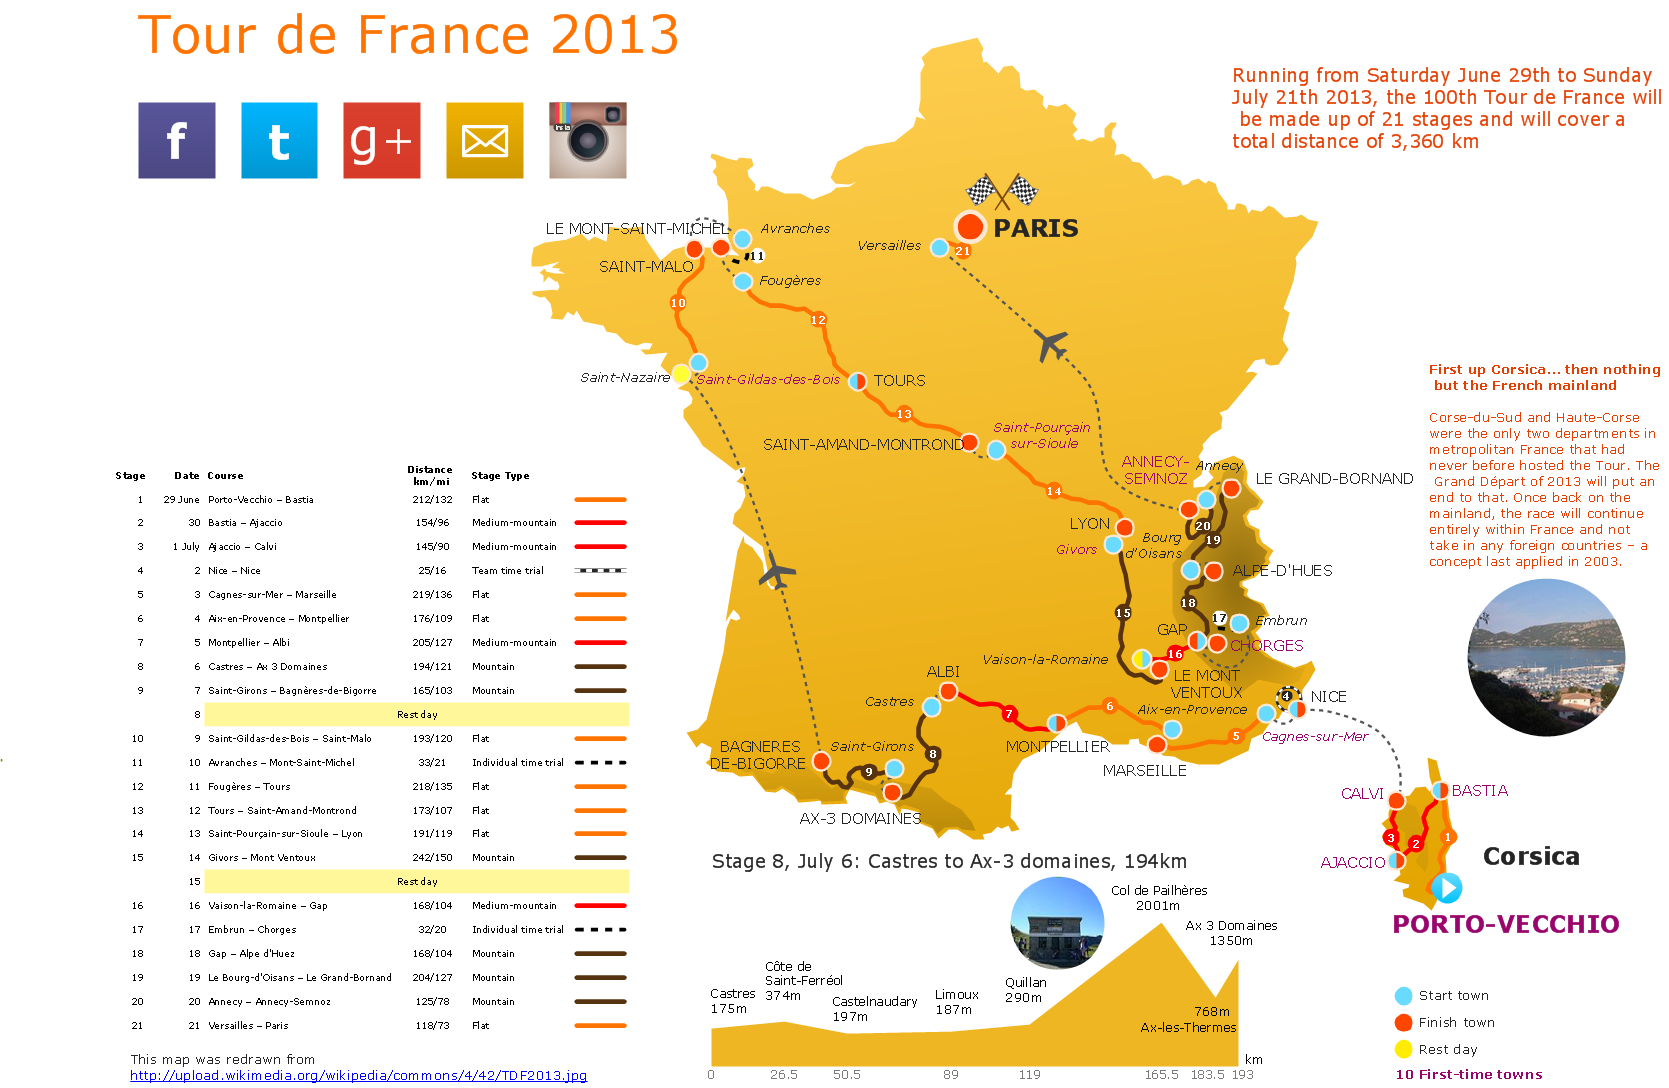
Transportation Infographics
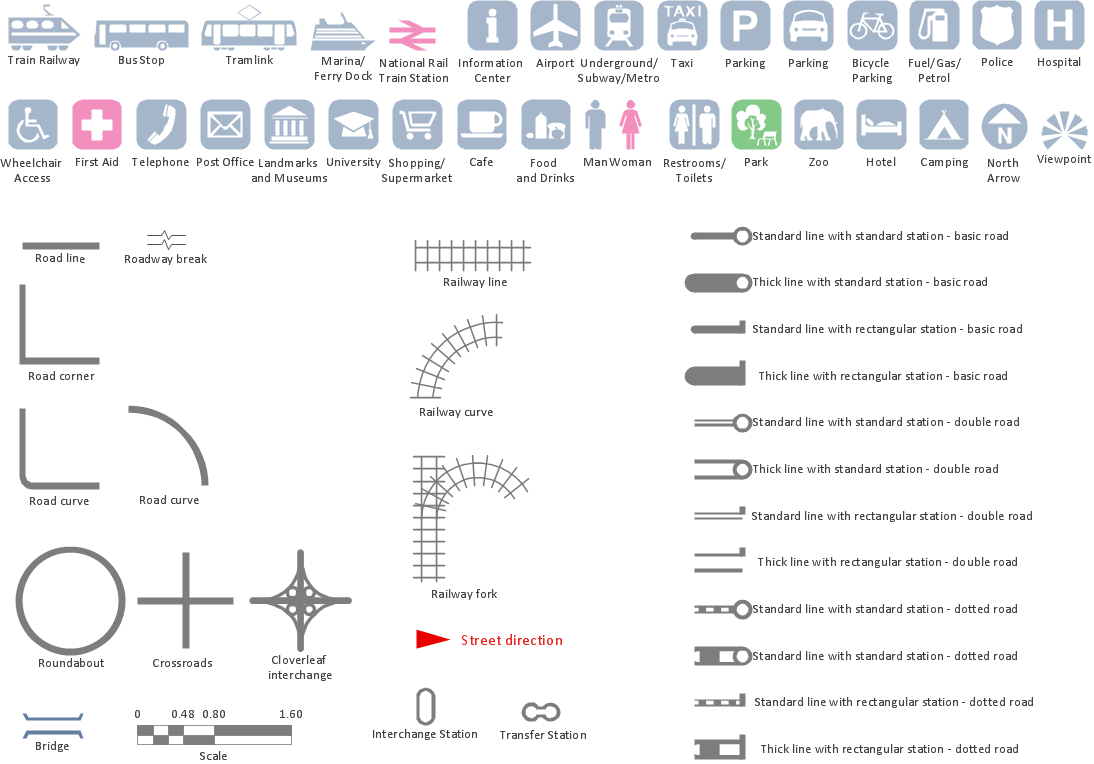
ConceptDraw is a visualization Software for making transportation infographics. Infographics design vector elements and vector graphics which will surely help you in your design process.HelpDesk
How to Create PowerPoint Presentation from Data Driven Infographics Using ConceptDraw PRO
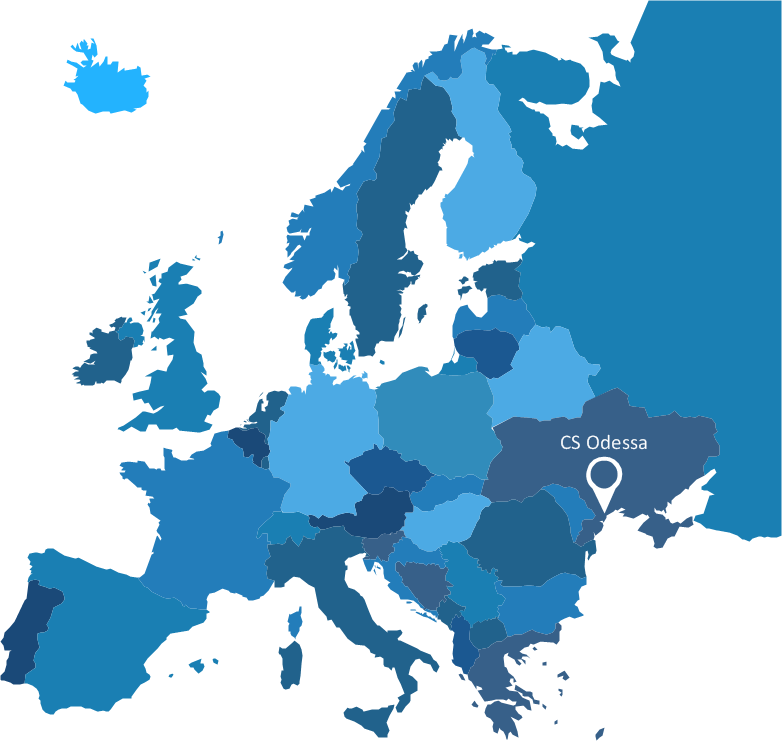
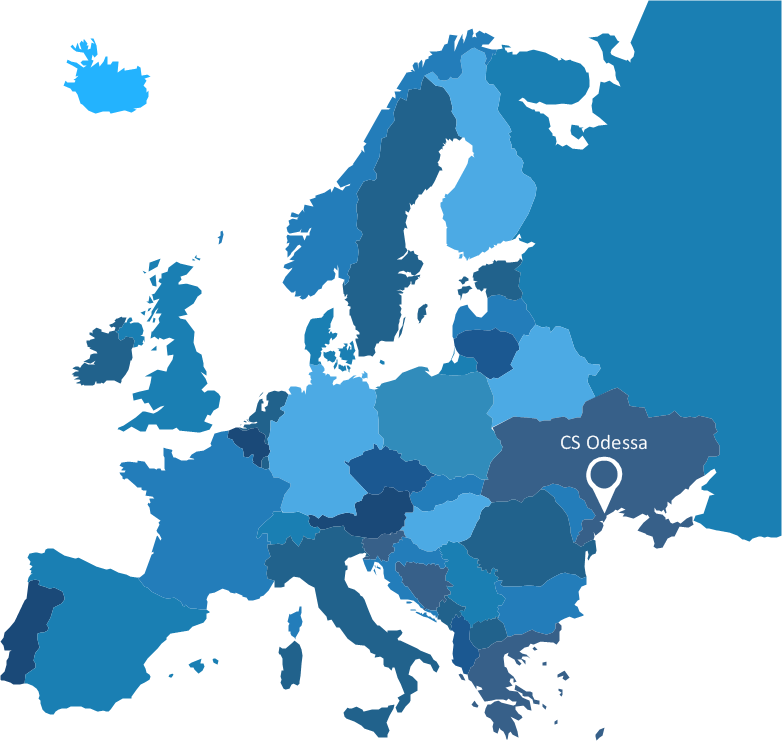
ConceptDraw PRO can be used as a tool for creating data-driven infographics. It allows you to draw data driven using the special templates and vector stencils libraries. ConceptDraw PRO allows you to make a MS PowerPoint Presentation from your Data-driven infographics in a few simple steps.Spatial infographics Design Elements: Continental Map
ConceptDraw PRO is a software for making infographics illustrations. You can work with various components to build really impressive and easy-to-understand infographics design.HelpDesk
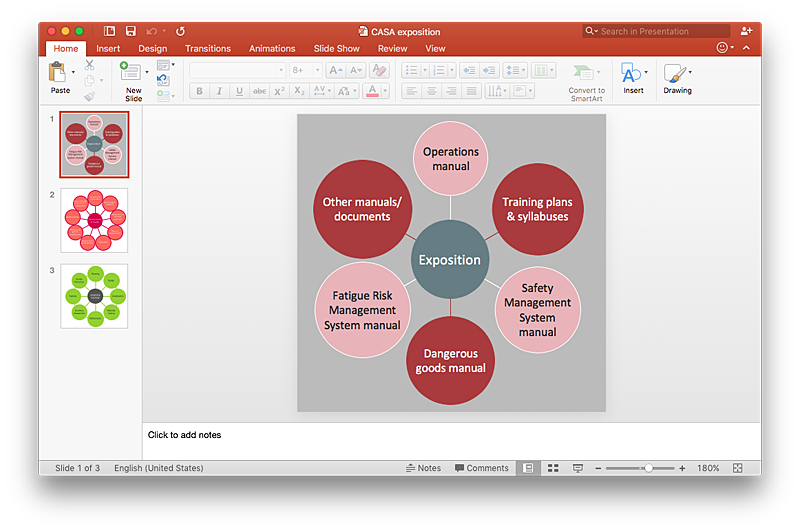
How to Add a Circle-spoke Diagram to a PowerPoint Presentation Using ConceptDraw PRO
ConceptDraw PRO can be used as a tool for creating circle spoke diagrams along with other marketing diagrams. ConceptDraw PRO allows you to make a MS PowerPoint Presentation from your marketing diagrams in a few simple steps.Brilliant Examples of Infographics Map, Transport, Road
ConceptDraw PRO contains spatial infographics samples, map templates to be filled in, and libraries of vector stencils for main design elements of spatial infographics.Winter Sports Vector Clipart. Medal Map. Spatial Infographics
Tracking Olympic results in visual format is the most modern way to deliver statistics to a broad audience. This is a good example of an illustrated table you may easily modify, print, or publish on web from ConceptDraw Winter Sports solution .Best Tool for Infographic Construction
ConceptDraw is a best data visualization tool that will allow everyone to create rich infographics and visualizations quickly and easily.Sample Pictorial Chart. Sample Infographics
Sample Pictorial Chart - Pictorial Infographics solution provides easy-to-use design infographics drawing tools, large collection of different sample infographics and infograms, sample pictorial chart and templates to be filled in, and 10 libraries with great quantity of predesigned vector pictograms. Use Pictorial Infographics solution to draw your own design pictorial infographics documents quick and easy.Map Infographic Maker
Take inspiration with ConceptDraw to visualise your maps and make eye-catching infographics.Spatial infographics Design Elements: Transport Map
Do you like infographics and data visualization? Creating infographics is super-easy with ConceptDraw.Visualization Spatial Data Using Thematic Maps Combined with Infographics
Now anyone can build an infographics from their data using ConceptDraw. Nice and simple, but the features it have are power-packed!Excellent Examples of Infographic Maps
Create Spatial infographics with ConceptDraw using its excellent examples of infographic maps. We hope these can inspire and teach you!Superb Examples of Infographic Maps
Great examples of Infographic Maps, they are needed for inspiration.HelpDesk
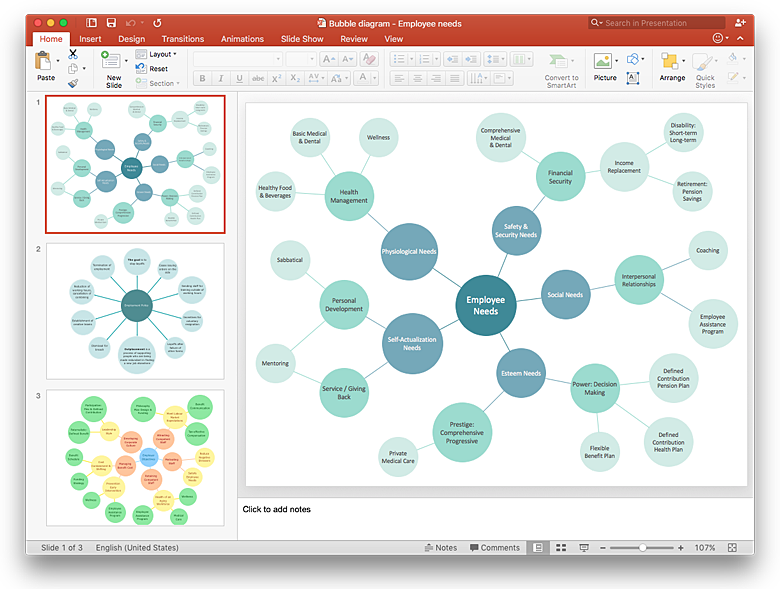
How to Add a Bubble Diagram to a PowerPoint Presentation Using ConceptDraw PRO
Bubble diagrams can be used to compare concepts, and identify areas of similarity and difference. ConceptDraw PRO allows you to make a MS PowerPoint Presentation from your charts in a few simple steps. A bubble diagram is a chart that represents information visually in the form of series of bubbles. Bubble charts are often used in marketing and management during the early stages of product development to visualize ideas and concepts by organizing them in a hierarchy. The ability to create this form of diagram is contained within the Bubble Diagrams solution. A PowerPoint presentation of bubble diagrams can be used to demonstrate and identify areas of similarity and difference of featured business ideas and concepts.How to Create a Powerful Infographic When You do not Have a Designer
Create a powerful infographic, become inspired by the people with ConceptDraw.- Project Timeline | Infographic Generator | Process Flowchart ...
- Free Powerpoint Infographics
- How to Create a Powerful Infographic When You do not Have a ...
- Powerpoint Vector Graphics Router
- Project Timeline | Infographic Generator | Basic Flowchart Symbols ...
- Spatial infographics Design Elements: Continental Map | Spatial ...
- Diagram For Map Of France
- Gane Sarson Diagram | Creating Data Driven Infographics ...
- KPI Dashboard | How to Add a Circle-spoke Diagram to a ...
- Subway Train Map | Transportation Infographics | How to draw Metro ...
- How To Do A Mind Map In PowerPoint | Ribbon interface - Vector ...
- Swot Template Ppt Free
- Circular diagrams - Vector stencils library | Circular Arrows | Basic ...
- How to draw Metro Map style infographics ? Moscow, New York, Los ...
- Powerpoint Graphics It Solution
- How to Add a Block Diagram to a PowerPoint Presentation Using ...
- HVAC Marketing Plan | Marketing Plan Infographic | HVAC Business ...
- Telecommunication Network Diagrams Solution. ConceptDraw.com ...
- Export from ConceptDraw PRO Document to PPT or PPTX (MS ...


