Process Improvement

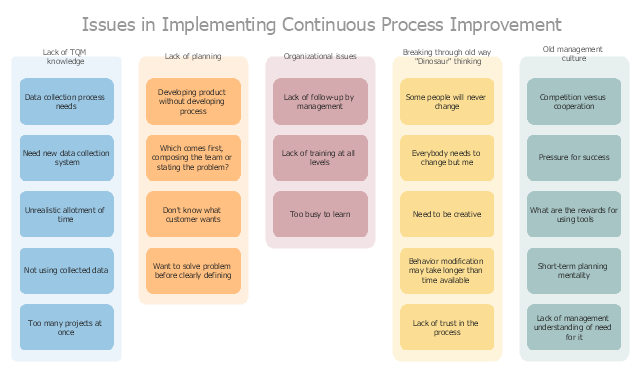
"A continual improvement process, also often called a continuous improvement process (abbreviated as CIP or CI), is an ongoing effort to improve products, services, or processes. These efforts can seek "incremental" improvement over time or "breakthrough" improvement all at once. Delivery (customer valued) processes are constantly evaluated and improved in the light of their efficiency, effectiveness and flexibility.
Some see CIPs as a meta-process for most management systems (such as business process management, quality management, project management, and program management)." [Continual improvement process. Wikipedia]
The affinity diagram example "Implementing continuous process improvement" was created using the ConceptDraw PRO diagramming and vector drawing software extended with the solution "Seven Management and Planning Tools" from the Management area of ConceptDraw Solution Park.
Affinity diagram
EPC for Business Process Improvement

An Event-driven Process Chain (EPC) - flowchart used for business process modelling
 flowchart used for business process modelling")
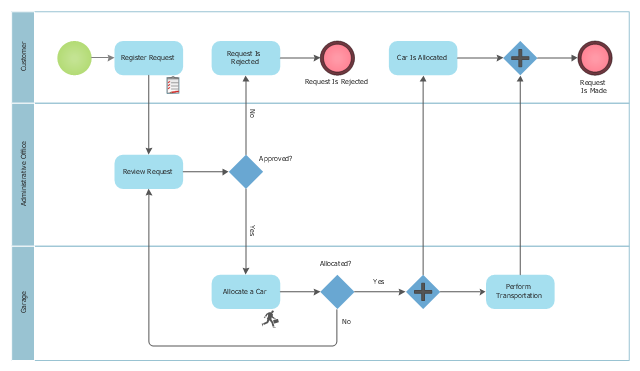
This BPMN (Business Process Model and Notation) diagram sample shows the taxi order process workflow.
"Business process modeling (BPM) in systems engineering is the activity of representing processes of an enterprise, so that the current process may be analyzed and improved. BPM is typically performed by business analysts and managers who are seeking to improve process efficiency and quality. The process improvements identified by BPM may or may not require information technology involvement, although that is a common driver for the need to model a business process, by creating a process master. Business process modeling results in the improvement of the way tasks performed by the business. They can pick up errors or cons about the way processes are currently being performed and model an improved way of carrying out these processes." [Business process modeling. Wikipedia]
The business process modeling diagram example "Taxi order process - BPMN 1.2 diagram" was created using the ConceptDraw PRO diagramming and vector drawing software extended with the Business Process Diagram solution from the Business Processes area of ConceptDraw Solution Park.
Business process modeling
HelpDesk
How to Create a Business Process Workflow Diagram Using ConceptDraw PRO

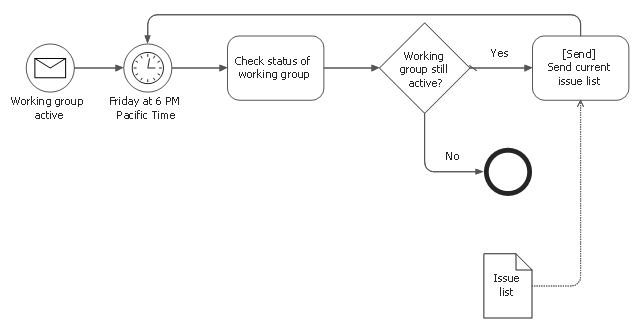
This BPMN diagram sample was designed on the base of the Wikimedia Commons file: BPMN-AProcesswithNormalFlow.svg. [commons.wikimedia.org/ wiki/ File:BPMN-AProcesswithNormalFlow.svg]
"Business process modelling (BPM) is the activity of representing processes of an enterprise, so that the current ("as is") process may be analyzed and improved in future ("to be"). Business process modelling is typically performed by business analysts and managers who are seeking to improve process efficiency and quality. The process improvements identified by business process modelling may or may not require Information Technology involvement, although that is a common driver for the need to model a business process, by creating a process master.
Change management programs are typically involved to put the improved business processes into practice. With advances in technology from large platform vendors, the vision of business process modelling models becoming fully executable (and capable of simulations and round-trip engineering) is coming closer to reality every day." [Enterprise modelling. Wikipedia]
The business process diagram example "A process with normal flow" was created using the ConceptDraw PRO diagramming and vector drawing software extended with the Business Process Model and Notation solution from the Business Processes area of ConceptDraw Solution Park.
BPMN diagram
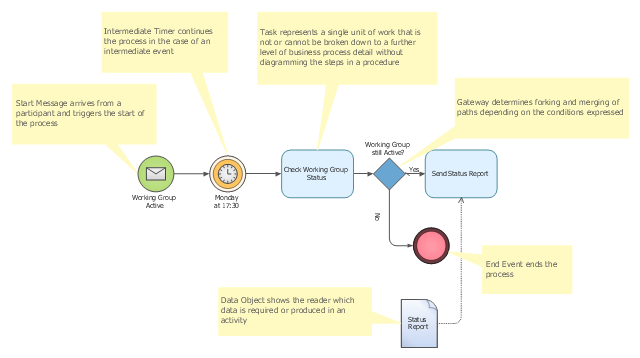
"Business process modeling (BPM) in systems engineering is the activity of representing processes of an enterprise, so that the current process may be analyzed and improved. BPM is typically performed by business analysts and managers who are seeking to improve process efficiency and quality. The process improvements identified by BPM may or may not require information technology involvement, although that is a common driver for the need to model a business process, by creating a process master. Business process modeling results in the improvement of the way tasks performed by the business. They can pick up errors or cons about the way processes are currently being performed and model an improved way of carrying out these processes." [Business process modeling. Wikipedia]
The template "Business process model diagram BPMN 1.2" for the ConceptDraw PRO diagramming and vector drawing software is included in the Business Process Diagram solution from the Business Processes area of ConceptDraw Solution Park.
The template "Business process model diagram BPMN 1.2" for the ConceptDraw PRO diagramming and vector drawing software is included in the Business Process Diagram solution from the Business Processes area of ConceptDraw Solution Park.
Business process model diagram BPMN 1.2 template
Process Flowchart


Types of Flowcharts


"Business process improvement (BPI) is a systematic approach to help an organization optimize its underlying processes to achieve more efficient results. ...
An organization is only as good as its processes. To be able to make the necessary changes in an organization, one needs to understand the key processes of the company. Rummler and Brache suggested a model for running a Process Improvement and Management project (PI&M), containing the following steps:
1. Identify the process to be improved (based on a critical business issue): The identification of key processes can be a formal or informal exercise. The management team might select processes by applying a set of criteria derived from strategic and tactical priorities, or process selection is based on obvious performance gaps. It is important is to select the process(es) which have the greatest impact on a competitive advantage or customer requirement.
2. Develop the objective(s) for the project based on the requirements of the process: The focus might be on quality improvement, productivity, cost, customer service or cycle time. The goal is however always the same; to get the key process under control.
3. Select the members of the cross-functional team: A horizontal (cross-functional) analysis is carried out by a team composed of representatives of all functions involved in the process. While a consultant or in-house staff person can do the job, the quality of the analysis and the commitment to change is far greater with a cross-functional team.
4. Document the current process by creating a flowchart or "organization map": Describe the process regarding the Organizational level, the Process level and the Job/ Performer level according to Rummler. Develop a cross-functional process map for the process.
5. Identify "disconnects" in the process: “Disconnections” are everything that inhibit the efficiency and effectiveness of the process. The identification should be categorized into the three levels: The Organizational level, the Process level and the Job/ Performer level.
6. Recommend changes (organizational, in the process or in its execution): Categorize and prioritize the main problems and possibilities, evaluate alternative solutions. Develop a cross-functional process map for the recommended process.
7. Establish process and sub-process measures: The process measures should reflect the objectives of the project.
8. Implement the improvements." [Business process improvement. Wikipedia]
The opportunity flow chart example "Replacing engine oil" was created using the ConceptDraw PRO diagramming and vector drawing software extended with the Cross-Functional Flowcharts solution from the Business Processes area of ConceptDraw Solution Park.
Opportunity flowchart

Process Mapping

Work Order Process Flowchart. Business Process Mapping Examples

Quality Improvement

Elements of an Event-Driven Process Chain
")
- Process Flowchart | Quality Improvement | TQM Software — Build ...
- Business Process Modeling with ConceptDraw | How To Make a ...
- Business Process Improvement Wiki
- Affinity diagram - Implementing continuous process improvement ...
- Business Process Improvement Sample Flowchart
- EPC for Business Process Improvement | An Event-driven Process ...
- Workflow Application | Business Process Modeling Tools | Taxi order ...
- Process Improvement
- EPC for Business Process Improvement | Process Improvement | An ...
- EPC for Business Process Improvement | An Event-driven Process ...
- Process Improvement | Business process Flow Chart - Event-Driven ...
- Event-driven Process Chain Diagrams | Business process Flow ...
- Booking process - BPMN 2.0 diagram | Business process model ...
- EPC for Business Process Improvement
- Business Process Modeling Resume
- Business Process Modeling with ConceptDraw | UML Business ...
- Business process model diagram BPMN 1.2 - Template | Design ...
- Taxi order process - BPMN 1.2 diagram | Taxi service order ...
- Opportunity flowchart - Template | Replacing engine oil - Opportunity ...
- BPM Software | Business process model diagram BPMN 1.2 ...