 Plant Layout Plans
This solution extends ConceptDraw PRO v.9.5 plant layout software (or later) with process plant layout and piping design samples, templates and libraries of vector stencils for drawing Plant Layout plans. Use it to develop plant layouts, power plant desig
HelpDesk
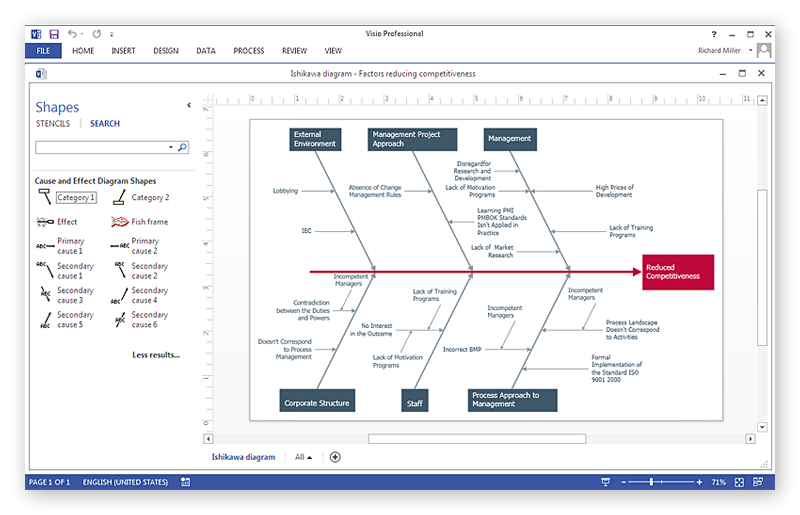
How To Create a MS Visio Cause and Effect Diagram Using ConceptDraw PRO
Cause-and-Effect Ishikawa Diagram is a graphical method of analysis and cause-effect relationships, a tool in the form of fish bone. It is used to systematically determine the cause of the problem and represent it graphically. The technique is primarily used in the framework of quality management for the analysis of quality problems and their causes. Nowadays, it has found worldwide distribution and is used in multiple problem areas. It is one of the tools of lean manufacturing, which is used in group work to find the problems and their causes. ConceptDraw PRO allows you to easily create Fishbone (Ishikawa) diagram and then make a MS Visio VSDX, or VSD files from your diagrams in a couple clicks, using the export capabilities of ConcewptDraw PRO.
 Seven Management and Planning Tools
Seven Management and Planning Tools solution extends ConceptDraw PRO and ConceptDraw MINDMAP with features, templates, samples and libraries of vector stencils for drawing management mind maps and diagrams.
 ConceptDraw Solution Park
ConceptDraw Solution Park collects graphic extensions, examples and learning materials
- Project Timeline | Program Evaluation and Review Technique ...
- Program Evaluation and Review Technique (PERT) with ...
- Program Evaluation and Review Technique (PERT) with ...
- Project plan timeline - Request for proposal (RFP) | Program ...
- Timeline Diagrams | Mac OS X User Interface | Program Evaluation ...
- Activity Network Diagram Method | Timeline Diagrams | Program ...
- Project Timeline | Gant Chart in Project Management | Program ...
- Program Evaluation and Review Technique (PERT) with ...
- Timeline Diagrams | Process Flowchart | Program Evaluation and ...
- Examples of Flowcharts, Org Charts and More | Program Evaluation ...
- Project —Task Trees and Dependencies | Program Evaluation and ...
- | Gant Chart in Project Management | Program Evaluation and ...
- Examples of Flowcharts, Org Charts and More | Program Evaluation ...
- How to Make a Timeline | Timeline Diagrams | Project Timeline ...
- PERT Chart Software | Program Evaluation and Review Technique ...
- Activity Network (PERT) Chart | Program Evaluation and Review ...
- Gantt charts for planning and scheduling projects | Program ...
- Program Evaluation and Review Technique (PERT) with ...
- Construction Project Chart Examples | Program Evaluation and ...
- How To Create a PERT Chart | Program Evaluation and Review ...
