Project —Task Trees and Dependencies

ConceptDraw PROJECT Project Management Software Tool

Pyramid Diagram

How To Implement Collaborative Project Management


Project — Assigning Resources


Project — Working With Costs

"A project network is a graph (flow chart) depicting the sequence in which a project's terminal elements are to be completed by showing terminal elements and their dependencies.
... the project network shows the "before-after" relations.
The most popular form of project network is activity on node, the other one is activity on arrow.
The condition for a valid project network is that it doesn't contain any circular references." [Project network. Wikipedia]
The PERT chart example "Project management plan" was created using the ConceptDraw PRO diagramming and vector drawing software extended with the solution "Seven Management and Planning Tools" from the Management area of ConceptDraw Solution Park.
PERT

Legend

Software Work Flow Process in Project Management with Diagram

This sample shows the Workflow Diagram that clearly illustrates stages a BPM consists of and relations between all parts of business. The Workflow Diagrams are used to represent the transferring of data during the work process, to study and analysis the working processes, and to optimize a workflow.
Gant Chart in Project Management

Project — Working With Tasks

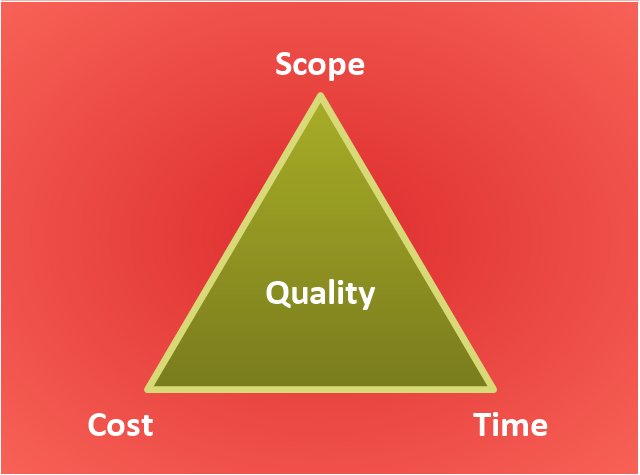
"The Project Management Triangle (called also Triple Constraint or the Iron Triangle) is a model of the constraints of project management. It is a graphic aid where the three attributes show on the corners of the triangle to show opposition. It is useful to help with intentionally choosing project biases, or analyzing the goals of a project. It is used to illustrate that project management success is measured by the project team's ability to manage the project, so that the expected results are produced while managing time and cost." [Project management triangle. Wikipedia]
The pyramid chart example "Project management triangle diagram" was redesigned using the ConceptDraw PRO diagramming and vector drawing software from Wikimedia Commons file Project-triangle-en.svg. [commons.wikimedia.org/ wiki/ File:Project-triangle-en.svg]
The project management triangle chart example is included in the Pyramid Diagrams solution from the Marketing area of ConceptDraw Solution Park.
Pyramid diagram
Remote Projects in Corporate Strategy

What Constitutes a Project?

Gantt charts for planning and scheduling projects

- Project Management Charts And Graphs
- Project management life cycle - Flowchart | Basic Diagramming ...
- Conceptdraw.com: Mind Map Software, Drawing Tools | Project ...
- Flow Chart Of Project Management
- Gant Chart in Project Management | Gantt chart examples | Gantt ...
- Project management life cycle - Flowchart | Program to Make Flow ...
- Schedule pie chart - Daily action plan | How To Implement ...
- PERT chart - Project management plan | Program Evaluation and ...
- Project Timeline | Gant Chart in Project Management | | Software ...
- Gant Chart in Project Management | How To Create a FlowChart ...
- Gant Chart in Project Management | Project —Task Trees and ...
- Flow Chart In Project Management
- Project Management Structure Diagram
- Gantt chart examples | Gant Chart in Project Management | Gantt ...
- Gant Chart in Project Management | Gantt Chart Software | Gantt ...
- Project Management Chart
- Gant Chart in Project Management | How to Create Multiple Projects ...
- Gant Chart in Project Management | How to Draw a Gantt Chart ...
- Project Management Flow Chart