 PM Teams
This solution extends ConceptDraw Office 2.0 products with a single information space for messaging to teams.
What Constitutes a Project?
Separated into categories of Basic, Intermediate, and Advanced categories, the new instructional videos about ConceptDraw PROJECT cover a huge breadth of topics, explaining how to use project management software. Users new to ConceptDraw PROJECT will find the Basic lessons an essential platform for familiarizing themselves with the programs′s functions and found it simple project management software. This video lesson is the first in Basic lessons series tells about affordable simple project management software, it may be used as an intro for what is project management using simple project management sample. ConceptDraw PROJECT is excellent portfolio project management software, this lessons explains how to use project management software for small business in case of multi project environment.
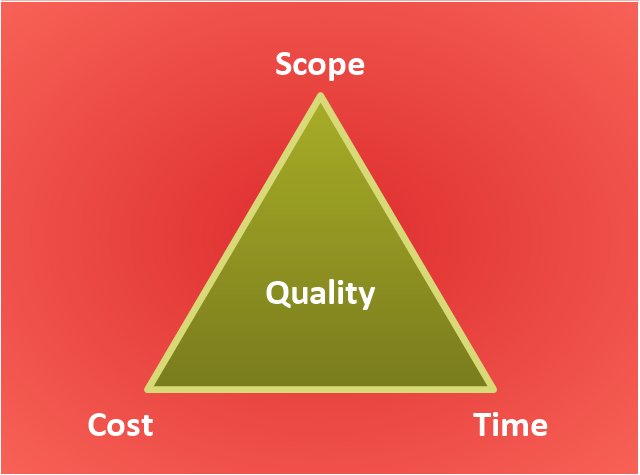
"The Project Management Triangle (called also Triple Constraint or the Iron Triangle) is a model of the constraints of project management. It is a graphic aid where the three attributes show on the corners of the triangle to show opposition. It is useful to help with intentionally choosing project biases, or analyzing the goals of a project. It is used to illustrate that project management success is measured by the project team's ability to manage the project, so that the expected results are produced while managing time and cost." [Project management triangle. Wikipedia]
The pyramid chart example "Project management triangle diagram" was redesigned using the ConceptDraw PRO diagramming and vector drawing software from Wikimedia Commons file Project-triangle-en.svg. [commons.wikimedia.org/ wiki/ File:Project-triangle-en.svg]
The project management triangle chart example is included in the Pyramid Diagrams solution from the Marketing area of ConceptDraw Solution Park.
Collaboration in a Project Team
Create with our data flow diagram software perfect data flow diagrams. Download data flow diagram software for FREE. Use hundreds of data flow diagram examples.HelpDesk
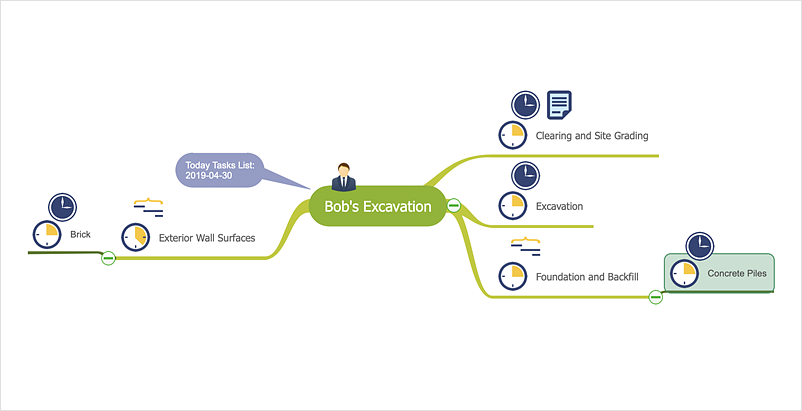
How to Manage a Multiple Project Participants Responsibilities With To-Do Mind Maps
All project participants are kept informed of their responsibilities in projects and can detail their tasks in a creative mind map format.HelpDesk
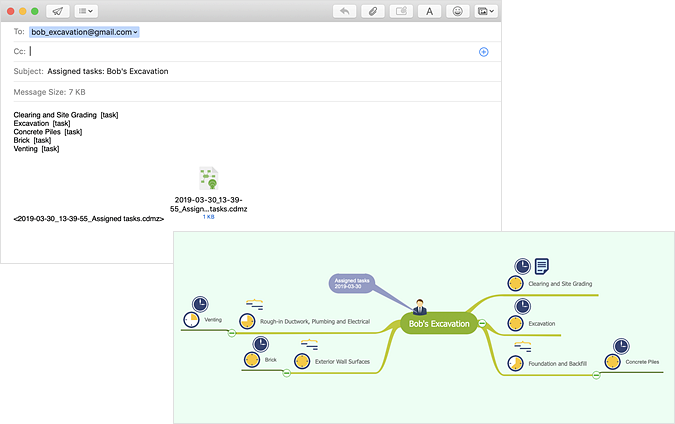
How to Use ConceptDraw PROJECT Micro Reports
Microreport is a tool to help you communicate better with your project team.
 PM Easy
PM Easy solution extends the ConceptDraw PROJECT functionality with an ability to support neutral methodology of project management and to quickly start a project by listing the task relationships and dependencies, that makes the iterative planning much easier. The project management tool and available visual tools, such as mind mapping, increase the effectiveness of tracking and analysis your project tasks. PM Easy solution from ConceptDraw Solution Park is mainly targeted at project managers in small or medium-sized companies, allowing them to make the project plan and execute projects using mind mapping technique, to implement planning using mind mapping, and to track tasks using ConceptDraw PROJECT application.
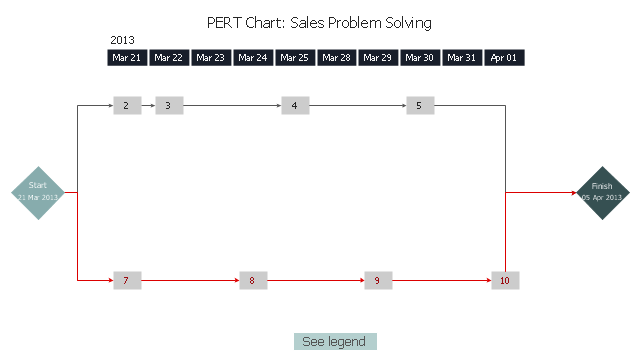
"Solution selling is a sales methodology. Rather than just promoting an existing product, the salesperson focuses on the customer's pain(s) and addresses the issue with his or her offerings (product and services). The resolution of the pain is what constitutes a "solution". ...
Followers of "solution-selling" generally apply a consultative sales approach to all aspects of their sales process (or during a sales cycle) including:
Prospecting;
Diagnosing customer needs;
Crafting a potential solution;
Establishing value;
Bargaining for access to decision-makers;
Positioning proof, ROI and the total solution;
Negotiating a win-win solution;
Following up to ensure customer success.
The solution selling methodology has evolved as key components of professional selling evolve. As a result, solution selling has become more broadly defined - to include dimensions of "sales process", "competitive selling", "value selling" as well as "consultative selling" or "complex selling" which set the focus on the team's aspects of the sales." [Solution selling.Wikipedia]
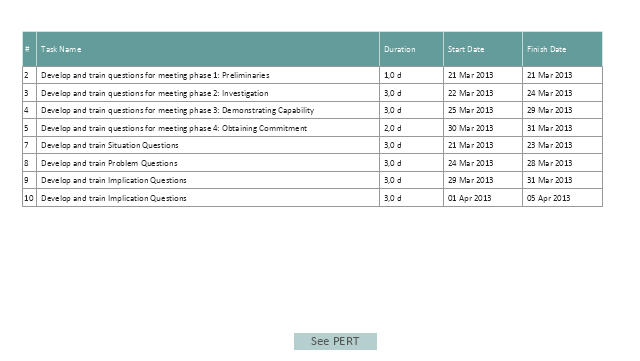
The PERT chart example "Sale problem solution" was created using the ConceptDraw PRO diagramming and vector drawing software extended with the solution Seven Management and Planning Tools from the Management area of ConceptDraw Solution Park.
HelpDesk
How to Create a Timeline Diagram
A Timeline is a chart which displays a project plan schedule in chronological order. A Timeline is used in project management to depict project milestones and visualize project phases and show project progress. The graphic form of a timeline makes it easy to understand critical project milestones, such as the progress of a project schedule. Timelines are particularly useful for project scheduling or project management when accompanied with a Gantt chart. It captures the main of what the project will accomplish and how it will be done. making a project timeline is one of the most important skills a project manager needs have. Making comprehensive, accurate timelines allows you getting every project off in the best way. ConceptDraw DIAGRAM allows you to draw a timeline chart using a special library.HelpDesk
How to Manage Multiple Projects on Windows
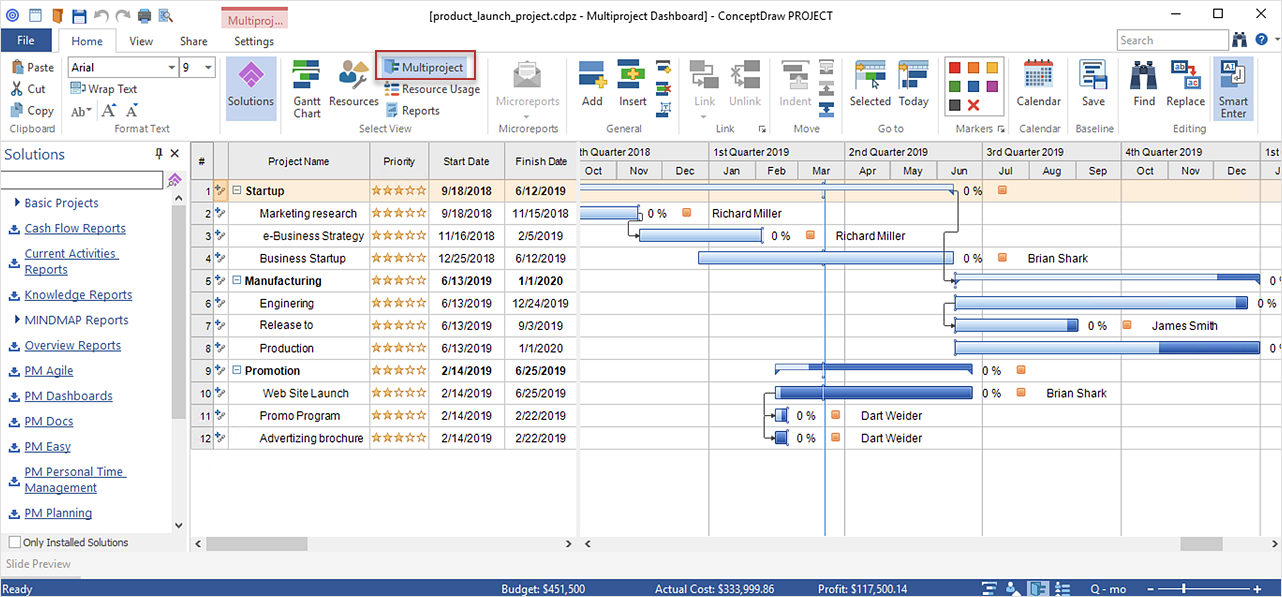
ConceptDraw PROJECT lets you to track multiple projects at the same time.Applications
ConceptDraw DIAGRAM is a multipurpose software from ConceptDraw suite intended for diagramming, business and technical drawing, and visual documenting. You can reach a lot of practical benefits from the use of ConceptDraw DIAGRAM. The list of ConceptDraw DIAGRAM applications and versatile possibilities is extremely great. Among them network and system diagramming, business diagramming, Cisco network design, network visualization, software and database design, software development, business flowcharting, data flow design, databases modeling and visualization, business processes modeling, business drawing, technical drawing, GUI prototyping, Organizational charts construction, business processes fixing, web site planning and design, Internet solutions design, information architecture design, UML modeling, ER diagrams design, home and landscape design, and a lot of other applications. ConceptDraw DIAGRAM offers the users a beneficial collaboration, compatibility with MS Visio and many other popular programs, including other products from ConceptDraw suite.- PERT chart template | Applications | Collaboration in a Project Team |
- Organizational Charts with ConceptDraw PRO | PM Teams ...
- PM Dashboards | Gantt Chart Software | Collaboration in a Project ...
- Project Assigning Resources | Gantt chart examples ...
- How to Draw an Organization Chart | Organizational Structure ...
- Gant Chart in Project Management | Project Working With Costs ...
- PM Teams | How to Draw an Organization Chart | Organizational ...
- PM Teams | How to Draw an Organization Chart | How To Plan and ...
- Pyramid Diagram | Diagram Flow Chart | How To Plan and ...
- Collaboration in a Project Team - Conceptdraw.com
- Organizational Charts with ConceptDraw PRO | How to Draw an ...
- PERT chart - Project management plan | Program Evaluation and ...
- Collaboration in a Project Team | Software Work Flow Process in ...
- Collaboration in a Project Team | Project Assigning Resources | |
- Collaboration in a Project Team | ConceptDraw ... - Conceptdraw.com
- Gant Chart in Project Management | Gantt charts for planning and ...
- Communication Tool for Remote Project Management | Gantt Chart ...
- Collaboration in a Project Team | Project Working With Tasks ...
- Organizational Charts with ConceptDraw PRO | Organizational ...
- Pyramid Diagram | Gantt charts for planning and scheduling projects ...

