Local area network (LAN). Computer and Network Examples
. Computer and Network Examples")

Process Flowchart


ConceptDraw PRO Network Diagram Tool


Network Glossary Definition

 Computer Network Diagrams
Computer Network Diagrams solution extends ConceptDraw PRO software with samples, templates and libraries of vector icons and objects of computer network devices and network components to help you create professional-looking Computer Network Diagrams, to plan simple home networks and complex computer network configurations for large buildings, to represent their schemes in a comprehensible graphical view, to document computer networks configurations, to depict the interactions between network's components, the used protocols and topologies, to represent physical and logical network structures, to compare visually different topologies and to depict their combinations, to represent in details the network structure with help of schemes, to study and analyze the network configurations, to communicate effectively to engineers, stakeholders and end-users, to track network working and troubleshoot, if necessary.
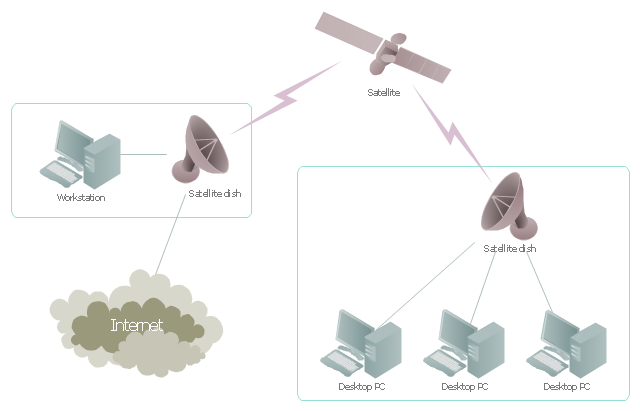
"Satellite Internet access is Internet access provided through communications satellites. ...
Satellite Internet generally relies on three primary components: a satellite in geostationary orbit (sometimes referred to as a geosynchronous Earth orbit, or GEO), a number of ground stations known as gateways that relay Internet data to and from the satellite via radio waves (microwave), and a VSAT (very-small-aperture terminal) dish antenna with a transceiver, located at the subscriber's premises. Other components of a satellite Internet system include a modem at the user end which links the user's network with the transceiver, and a centralized network operations center (NOC) for monitoring the entire system. Working in concert with a broadband gateway, the satellite operates a Star network topology where all network communication passes through the network's hub processor, which is at the center of the star. With this configuration, the number of remote VSATs that can be connected to the hub is virtually limitless." [Satellite Internet access. Wikipedia]
This satellite telecom network diagram example was created using the ConceptDraw PRO diagramming and vector drawing software extended with the Telecommunication Network Diagrams solution from the Computer and Networks area of ConceptDraw Solution Park.
Satellite telecom network diagram
 Computers and Communications
Computers and communications solution extends ConceptDraw PRO software with illustration samples, templates and vector stencils libraries with clip art of computers, control devices, communications, technology, Apple machines.
 Entity-Relationship Diagram (ERD)
Entity-Relationship Diagram (ERD) solution extends ConceptDraw PRO software with templates, samples and libraries of vector stencils from drawing the ER-diagrams by Chen's and crow’s foot notations.
 SYSML
SYSML
The SysML solution helps to present diagrams using Systems Modeling Language; a perfect tool for system engineering.
How To Send Presentation via Skype (Mac OS X)


 Specification and Description Language (SDL)
For people in the field of systems engineering or system design, working with specification and description language (sdl) and finite state machines (fsm).
 AWS Architecture Diagrams
AWS Architecture Diagrams with powerful drawing tools and numerous predesigned Amazon icons and AWS simple icons is the best for creation the AWS Architecture Diagrams, describing the use of Amazon Web Services or Amazon Cloud Services, their application for development and implementation the systems running on the AWS infrastructure. The multifarious samples give you the good understanding of AWS platform, its structure, services, resources and features, wide opportunities, advantages and benefits from their use; solution’s templates are essential and helpful when designing, description and implementing the AWS infrastructure-based systems. Use them in technical documentation, advertising and marketing materials, in specifications, presentation slides, whitepapers, datasheets, posters, etc.
Cloud Computing Architecture

 Cross-Functional Flowcharts
Cross-functional flowcharts are powerful and useful tool for visualizing and analyzing complex business processes which requires involvement of multiple people, teams or even departments. They let clearly represent a sequence of the process steps, the order of operations, relationships between processes and responsible functional units (such as departments or positions).
- Remote Computer Monitor System Case Tool Activity Diagram
- Component Diagram For Remote Computer Monitoring System
- Remote Computer Monitoring System Class Diagram
- Use Case Diagram For Remote Computer Monitoring In Star Uml
- Component Diagram For Remote Computer Monitoring
- Remote Computer Monitoring Class Diagram
- Deployment Diagram For Remote Computer Monitoring System
- Activity Diagram For Remote Computer Monitoring System
- Security system plan | Computer Monitering
- Usecase Diagram For Remote Computer Monitoring
- Remote Monitoring System Activity Diagram
- Activity Diagram Remote Computer Monitoring
- Class Diagram For Remote Monitering System
- Class Diagram For Remote Computer Moitering
- Use Case Diagram For Remote Monitoring System
- Remote Computer Monitoring System Class Daigeam
- Sequence Diagram Remote Computer Monitoring
- Computer Monitoring Usecase Diagram
- Er Diagram For Project Monitoring System