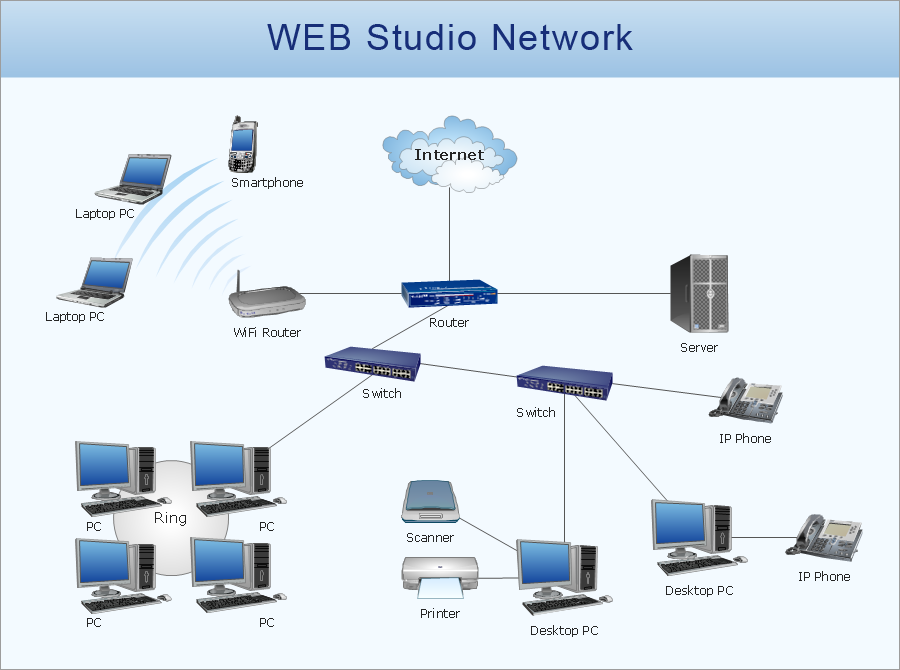
Network Drawing Software
ConceptDraw Network Drawing Software - Network design software for network drawings with abundant examples and templates. Create computer network designs, diagrams and schematics using ConceptDraw.
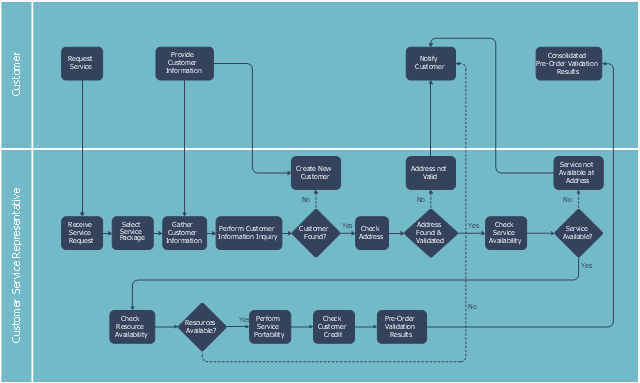
This swim lane diagram sample shows the telecom services process flow.
"Telecommunication is communication at a distance by technological means, particularly through electrical signals or electromagnetic waves. ...
Electrical and electromagnetic telecommunication technologies include telegraph, telephone, and teleprinter, networks, radio, microwave transmission, fiber optics, communications satellites and the Internet." [Telecommunication. Wikipedia]
"A telecommunications service provider or TSP is a type of communications service provider that has traditionally provided telephone and similar services. This category includes incumbent local exchange carriers, competitive local exchange carriers, and mobile wireless communication companies. ...
While some people use the terms "telecom service provider" and "communications service provider" interchangeably, the term TSP generally excludes Internet service providers (ISPs), cable companies, satellite TV, and managed service providers. ...
TSPs provide access to telephone and related communications services." [Telecommunications service provider. Wikipedia]
The cross-functional flowchart example "Providing telecom services" was created using the ConceptDraw PRO diagramming and vector drawing software extended with the Cross-Functional Flowcharts solution from the Business Processes area of ConceptDraw Solution Park.
 Telecommunication Network Diagrams
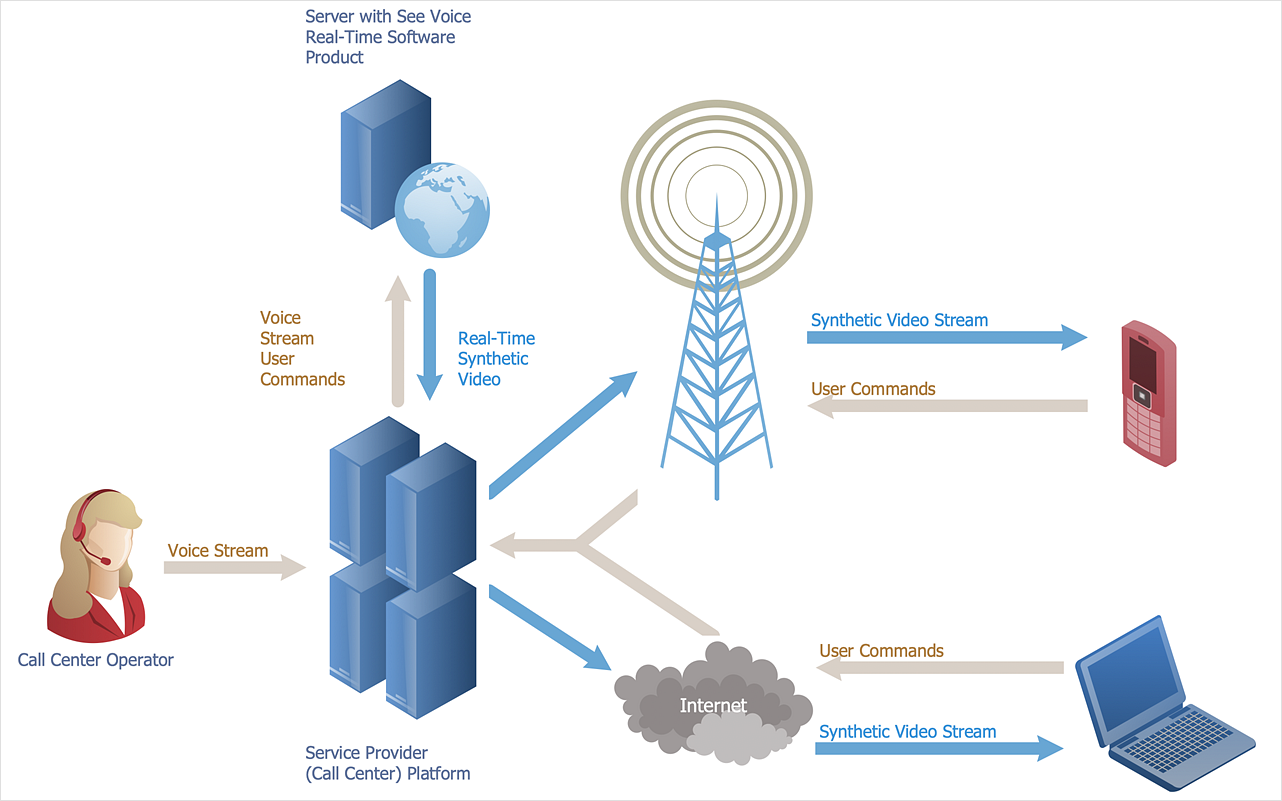
Telecommunication Network Diagrams solution extends ConceptDraw DIAGRAM software with samples, templates, and great collection of vector stencils to help the specialists in a field of networks and telecommunications, as well as other users to create Computer systems networking and Telecommunication network diagrams for various fields, to organize the work of call centers, to design the GPRS networks and GPS navigational systems, mobile, satellite and hybrid communication networks, to construct the mobile TV networks and wireless broadband networks.
Network Diagram Software
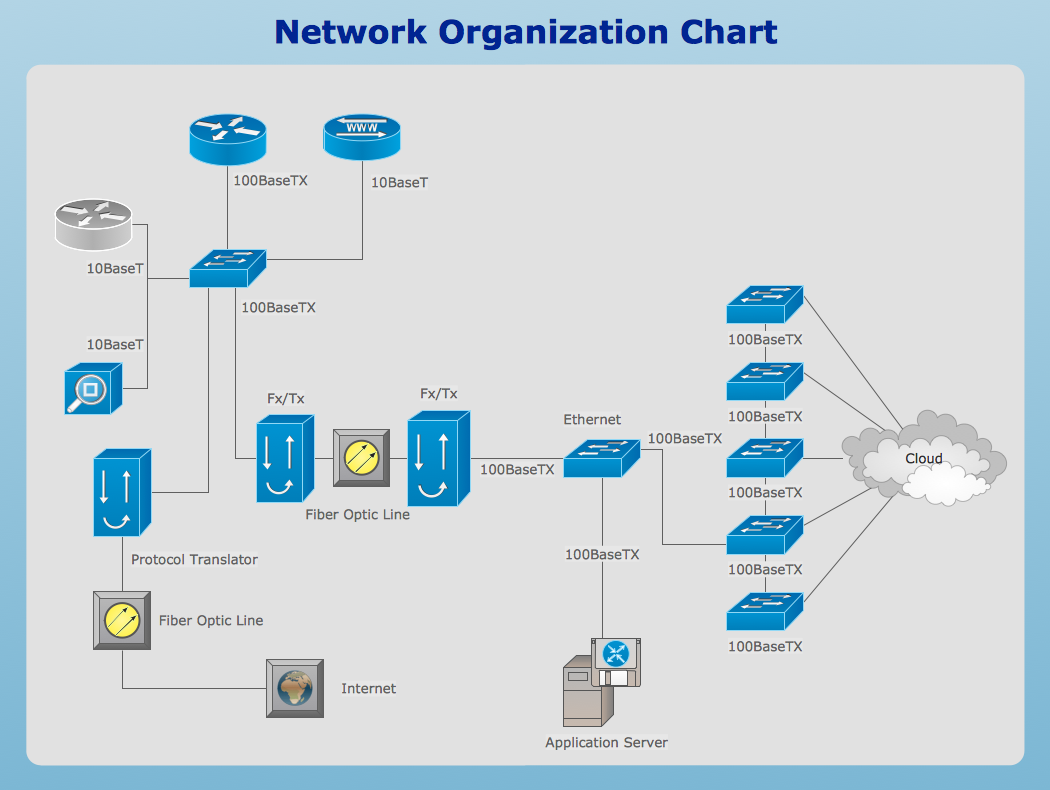
ConceptDraw Network Diagram Software - Network design software for network drawings with abundant examples and templates. Create computer network designs, diagrams and schematics using ConceptDraw.
This work flow chart sample was redesigned from the picture "Weather Forecast" from the article "Simulation Workflows".
[iaas.uni-stuttgart.de/ forschung/ projects/ simtech/ sim-workflows.php]
"(1) The weather is predicted for a particular geological area. Hence, the workflow is fed with a model of the geophysical environment of ground, air and water for a requested area.
(2) Over a specified period of time (e.g. 6 hours) several different variables are measured and observed. Ground stations, ships, airplanes, weather balloons, satellites and buoys measure the air pressure, air/ water temperature, wind velocity, air humidity, vertical temperature profiles, cloud velocity, rain fall, and more.
(3) This data needs to be collected from the different sources and stored for later access.
(4) The collected data is analyzed and transformed into a common format (e.g. Fahrenheit to Celsius scale). The normalized values are used to create the current state of the atmosphere.
(5) Then, a numerical weather forecast is made based on mathematical-physical models (e.g. GFS - Global Forecast System, UKMO - United Kingdom MOdel, GME - global model of Deutscher Wetterdienst). The environmental area needs to be discretized beforehand using grid cells. The physical parameters measured in Step 2 are exposed in 3D space as timely function. This leads to a system of partial differential equations reflecting the physical relations that is solved numerically.
(6) The results of the numerical models are complemented with a statistical interpretation (e.g. with MOS - Model-Output-Statistics). That means the forecast result of the numerical models is compared to statistical weather data. Known forecast failures are corrected.
(7) The numerical post-processing is done with DMO (Direct Model Output): the numerical results are interpolated for specific geological locations.
(8) Additionally, a statistical post-processing step removes failures of measuring devices (e.g. using KALMAN filters).
(9) The statistical interpretation and the numerical results are then observed and interpreted by meteorologists based on their subjective experiences.
(10) Finally, the weather forecast is visualized and presented to interested people." [iaas.uni-stuttgart.de/ forschung/ projects/ simtech/ sim-workflows.php]
The example "Workflow diagram - Weather forecast" was drawn using the ConceptDraw PRO diagramming and vector drawing software extended with the Workflow Diagrams solution from the Business Processes area of ConceptDraw Solution Park.
This wheel diagram sample was created on the base of figure illustrating the webpage "Chapter 3: Current State of the Ecosystem" of the website of the National Broadband Plan of US Federal Communications Comission (FCC). "The broadband ecosystem includes applications and content: e-mail, search, news, maps, sales and marketing applications used by businesses, user-generated video and hundreds of thousands of more specialized uses. Ultimately, the value of broadband is realized when it delivers useful applications and content to end-users.
Applications run on devices that attach to the network and allow users to communicate: computers, smartphones, set-top boxes, e-book readers, sensors, private branch exchanges (PBX), local area network routers, modems and an ever-growing list of other devices. New devices mean new opportunities for applications and content.
Finally, broadband networks can take multiple forms: wired or wireless, fixed or mobile, terrestrial or satellite. Different types of networks have different capabilities, benefits and costs.
The value of being connected to the network increases as more people and businesses choose to adopt broadband and use applications and devices that the network supports. Several factors contribute to their decisions. These include whether they can afford a connection, whether they are comfortable with digital technology and whether they believe broadband is useful.
Networks, devices and applications drive each other in a virtuous cycle. If networks are fast, reliable and widely available, companies produce more powerful, more capable devices to connect to those networks. These devices, in turn, encourage innovators and entrepreneurs to develop exciting applications and content. These new applications draw interest among end-users, bring new users online and increase use among those who already subscribe to broadband services. This growth in the broadband ecosystem reinforces the cycle, encouraging service providers to boost the speed, functionality and reach of their networks."
[broadband.gov/ plan/ 3-current-state-of-the-ecosystem/ ]
The circle pie chart example "Forces shaping the broadband ecosystem in the US" was created using the ConceptDraw PRO diagramming and vector drawing software extended with the Target and Circular Diagrams solution from the Marketing area of ConceptDraw Solution Park.
www.conceptdraw.com/ solution-park/ marketing-target-and-circular-diagrams
HelpDesk
How to Create a Telecommunication Network Diagram
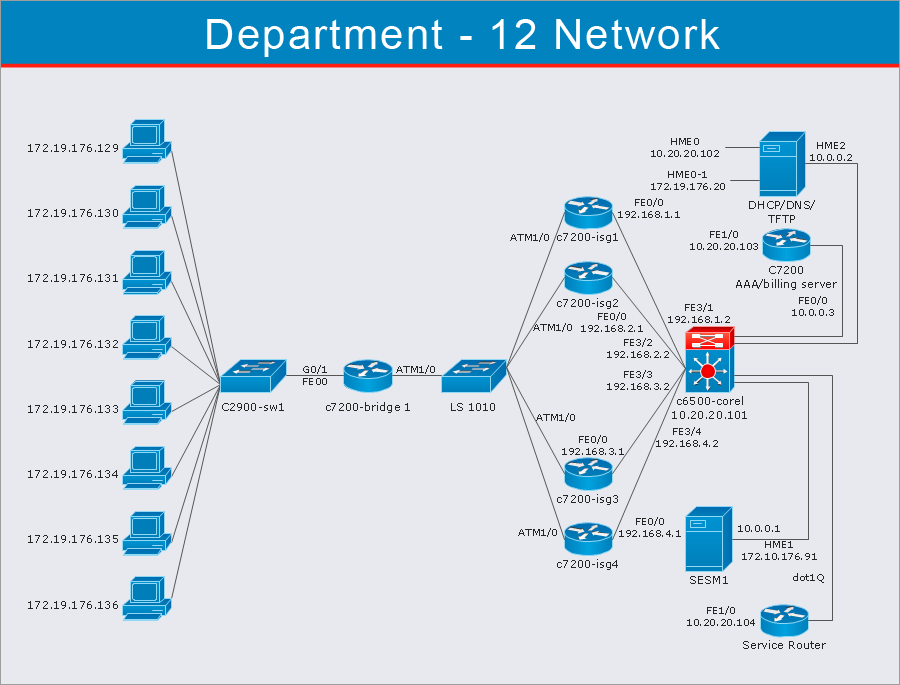
Telecommunication network diagram displays components and connections in a telecommunication network: how they are interacted between each other and with end-users. Telecommunication network diagrams usually created by system engineers for planning telecom networks. Also, they may be useful for a network management. Telecom network diagram visualizes the level of security and user access to certain equipment and data within a current network. Telecom network diagram can be used to identify weak points of an entire network or a part of it. ConceptDraw DIAGRAM allows you to draw a simple and clear Telecommunication Network diagrams.This vector stencils library contains 195 cloud computing icons.
Use it to design cloud computing infographic and diagrams with ConceptDraw PRO software.
"Cloud computing, also on-demand computing, is a kind of Internet-based computing that provides shared processing resources and data to computers and other devices on demand. It is a model for enabling ubiquitous, on-demand access to a shared pool of configurable computing resources (e.g., networks, servers, storage, applications and services), which can be rapidly provisioned and released with minimal management effort. Cloud computing and storage solutions provide users and enterprises with various capabilities to store and process their data in third-party data centers.
Cloud computing has become a highly demanded service or utility due to the advantages of high computing power, cheap cost of services, high performance, scalability, accessibility as well as availability." [Cloud computing. Wikipedia]
The vector stencils library "Cloud clipart" is included in the Cloud Computing Diagrams solution from the Computer and Networks area of ConceptDraw Solution Park.
Network Diagram Software
Network Diagrams are used to visually represent the network architecture, to illustrate the network structure, how the computers and other elements of the network are connected each other using a variety of network symbols, clipart and connection lines. They are incredibly useful on the stages of projecting computer network, of its construction and exploitation. Professionally designed and accurate Network Diagrams are equally convenient for computer engineers and users. You can construct them by hand on the paper or use special network diagramming software, such as ConceptDraw DIAGRAM. Having at disposal the powerful network diagramming tools of Computer Network Diagrams solution included to ConceptDraw Solution Park, you can succeed in drawing various types of Computer Network Diagrams, among them Network Communication Plans, Logical Network Diagrams, Network Topology Diagrams, LAN and WAN Diagrams, Network Floor Plan Layouts, Computer Network System Diagrams, Web-based Network Diagrams, Wireless Network Diagrams, Cisco Network Diagram, and others.
- Cross-functional flowchart - Providing telecom services ...
- Mobile satellite communication network diagram ...
- Communication Flow Chart For Concert
- Satellite Flowchart
- Mobile Satellite Flowchart
- Mobile satellite communication network diagram | Network Drawing ...
- Telecommunication Network Diagrams | Mobile satellite ...
- Mobile satellite communication network diagram ...
- Business Tv In Satellite Communication Wikipedia
- Mobile Communications Flow Charts
- ConceptDraw PRO Network Diagram Tool | Mobile satellite ...
- Mobile satellite communication network diagram ...
- Satellite telecom network diagram | Mobile satellite communication ...
- PERT chart - Template | Diagramming Software for Design UML ...
- Drawing Chart Of Communication
- Communication medium diagram | How to Create a Social Media ...
- Forces shaping the broadband ecosystem in the US - Circle pie chart
- Mobile satellite communication network diagram | Digital ...
- Communication network diagram | Telecommunication Network ...
- Mobile satellite communication network diagram | Mobile satellite ...




-cloud-clipart---vector-stencils-library.png--diagram-flowchart-example.png)
-cloud-clipart---vector-stencils-library.png--diagram-flowchart-example.png)


-cloud-clipart---vector-stencils-library.png--diagram-flowchart-example.png)


-cloud-clipart---vector-stencils-library.png--diagram-flowchart-example.png)
-cloud-clipart---vector-stencils-library.png--diagram-flowchart-example.png)


