This circle diagram sample was redesigned from the Wikimedia Commons file: Research cycle.png. "Some of the basic elements of the scientific method, arranged in a cycle to emphasize that it is an iterative process." [commons.wikimedia.org/ wiki/ File:Research_ cycle.png]
This file is licensed under the Creative Commons Attribution 2.0 Generic license. [creativecommons.org/ licenses/ by/ 2.0/ deed.en]
"The scientific method is a body of techniques for investigating phenomena, acquiring new knowledge, or correcting and integrating previous knowledge. To be termed scientific, a method of inquiry must be based on empirical and measurable evidence subject to specific principles of reasoning. ...
Four essential elements of the scientific method are iterations, recursions, interleavings, or orderings of the following:
(1) Characterizations (observations, definitions, and measurements of the subject of inquiry).
(2) Hypotheses (theoretical, hypothetical explanations of observations and measurements of the subject).
(3) Predictions (reasoning including logical deduction from the hypothesis or theory).
(4) Experiments (tests of all of the above)...
A linearized, pragmatic scheme of the four points above is sometimes offered as a guideline for proceeding:
(1) Define a question.
(2) Gather information and resources (observe).
(3) Form an explanatory hypothesis.
(4) Test the hypothesis by performing an experiment and collecting data in a reproducible manner.
(5) Analyze the data.
(6) Interpret the data and draw conclusions that serve as a starting point for new hypothesis.
(7) Publish results.
(8) Retest (frequently done by other scientists).
The iterative cycle inherent in this step-by-step method goes from point 3 to 6 back to 3 again." [Scientific method. Wikipedia]
The circle diagram example "Research cycle" was created using the ConceptDraw PRO diagramming and vector drawing software extended with the Target and Circular Diagrams solution from the Marketing area of ConceptDraw Solution Park.
www.conceptdraw.com/ solution-park/ marketing-target-and-circular-diagrams
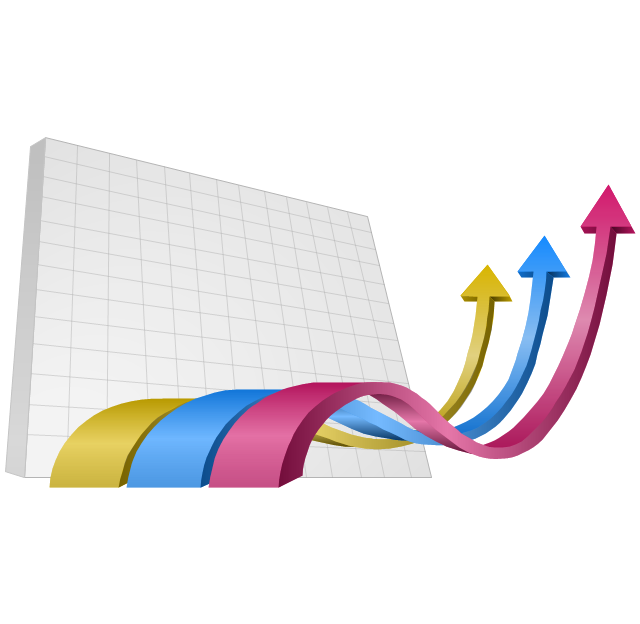
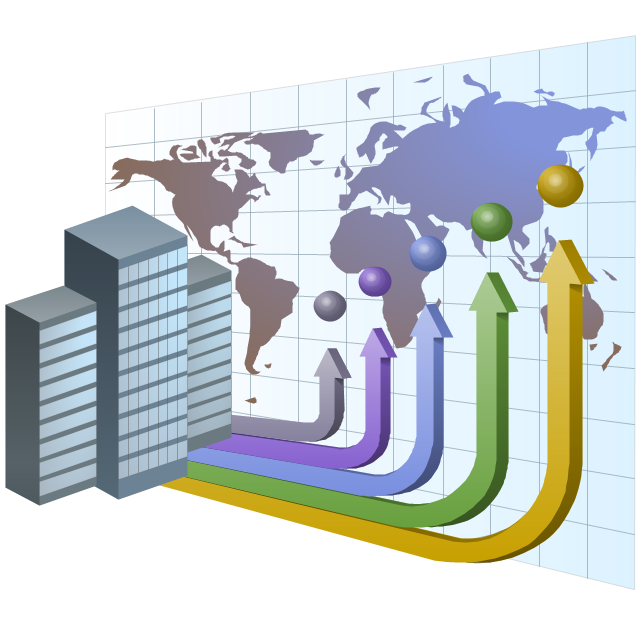
The vector clipart library "Presentation design elements" contains 45 presentation symbols and arrows which you can easy use in your slides and illustrations.
"A presentation is the process of presenting a topic to an audience. It is typically a demonstration, lecture, or speech meant to inform, persuade, or build good will. ... the use of visuals reduced meeting times... audiences believe presenters who use visuals are more professional and credible than presenters who merely speak. ... meetings and presentations reinforced with visuals help participants reach decisions and consensus more quickly." [Presentation. Wikipedia]
The clip art example "Presentation design elements - Vector clipart library" was created in the ConceptDraw PRO diagramming and vector drawing software using the Presentation Clipart solution from the Illustration area of ConceptDraw Solution Park.
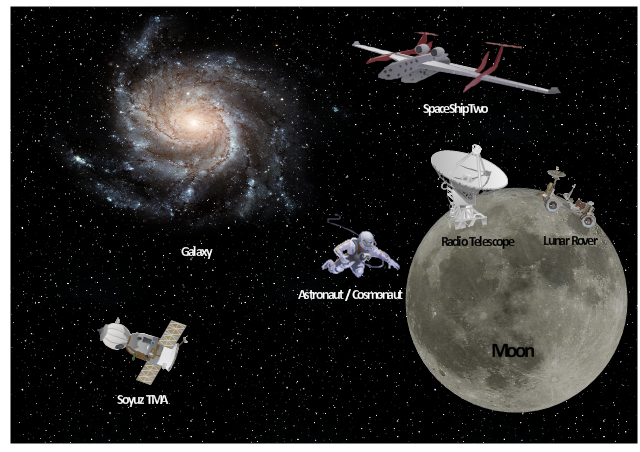
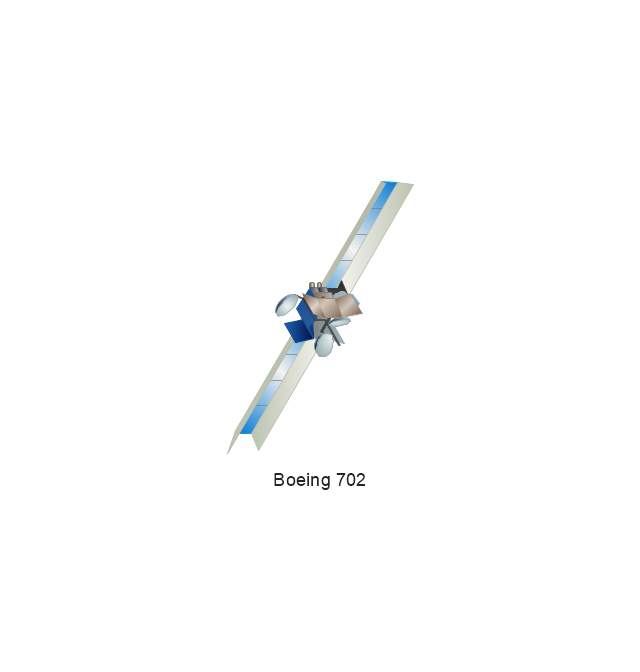
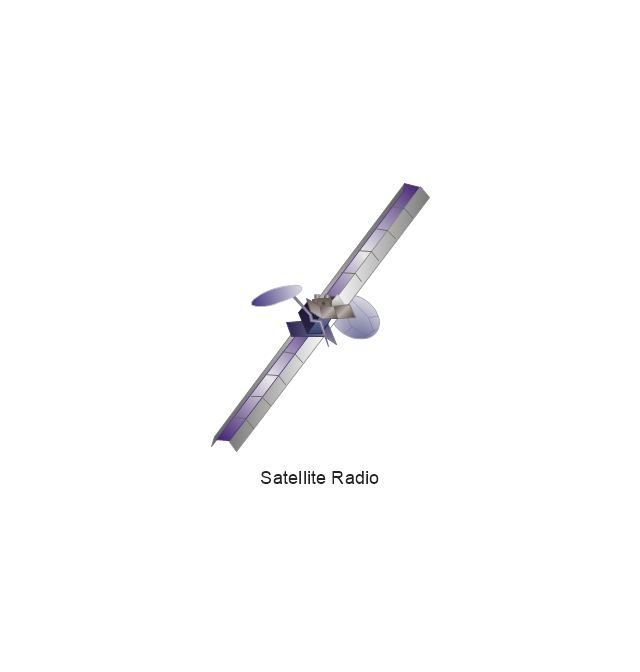
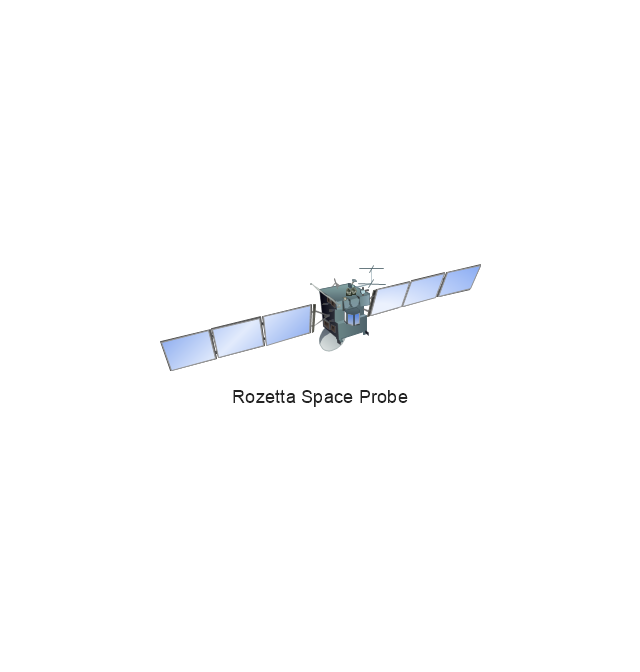
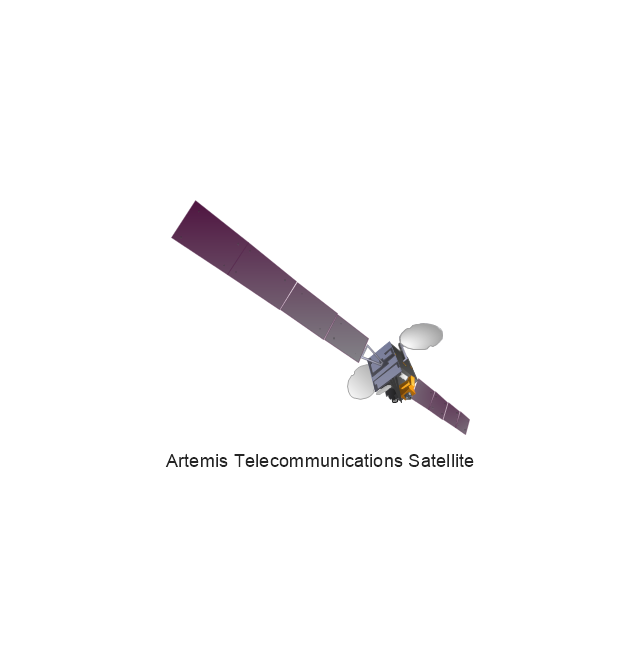
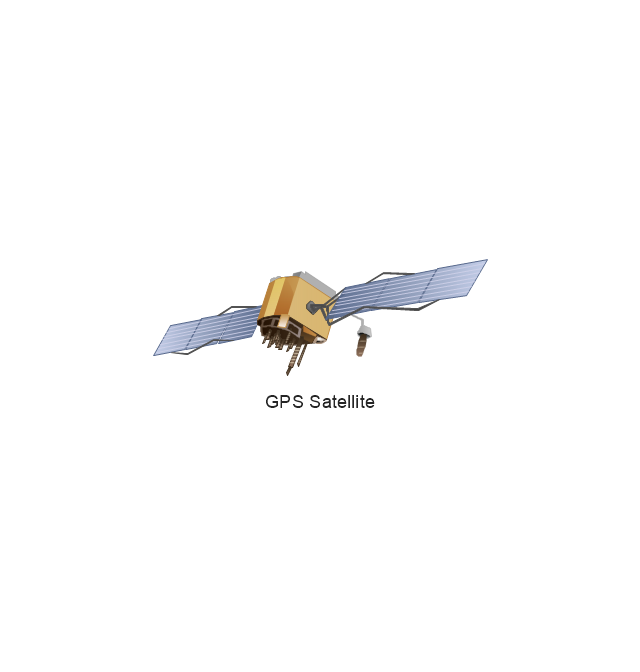
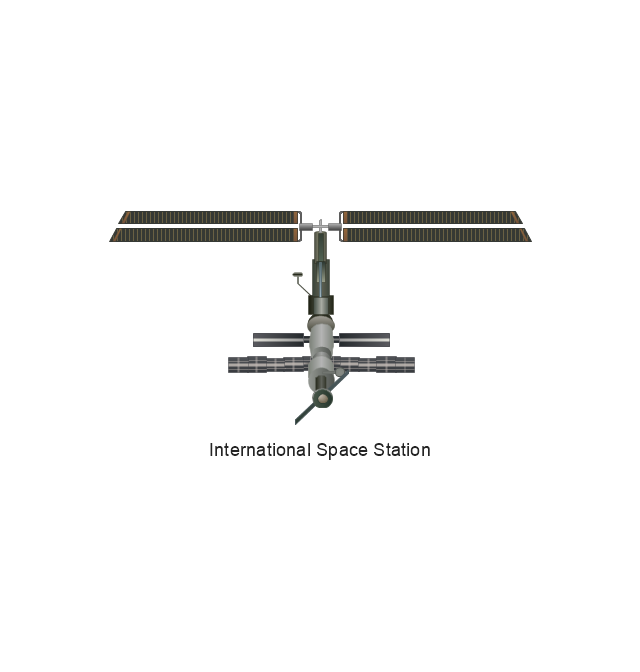
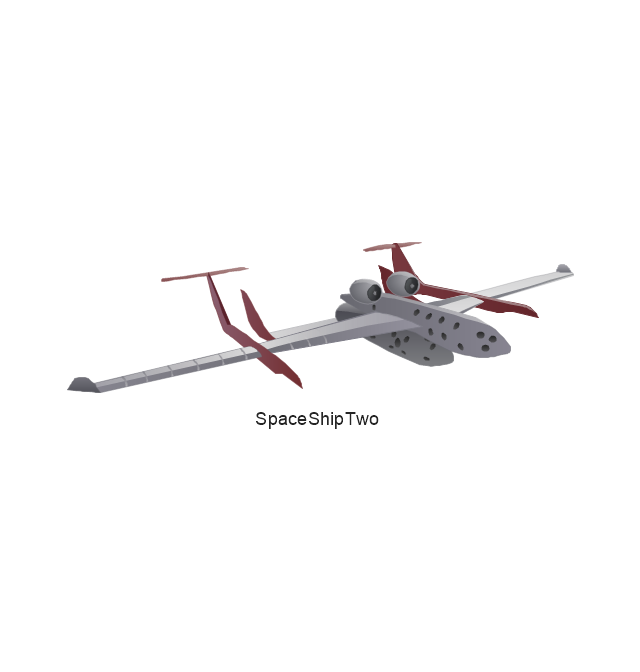
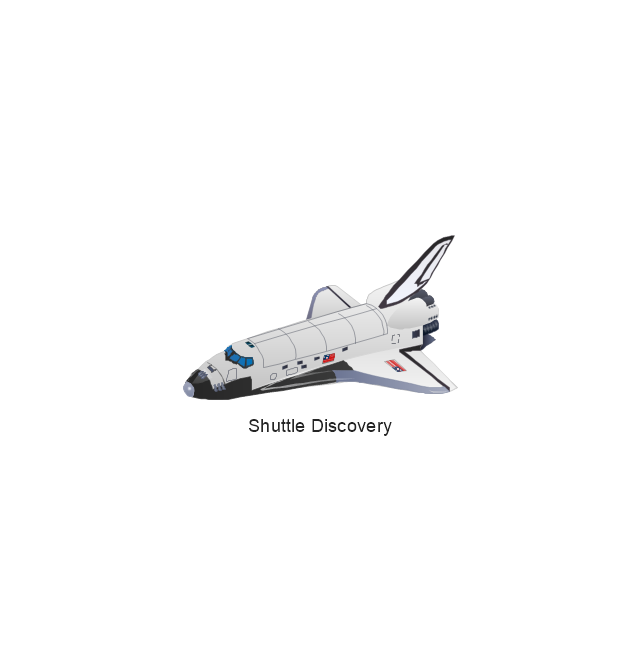
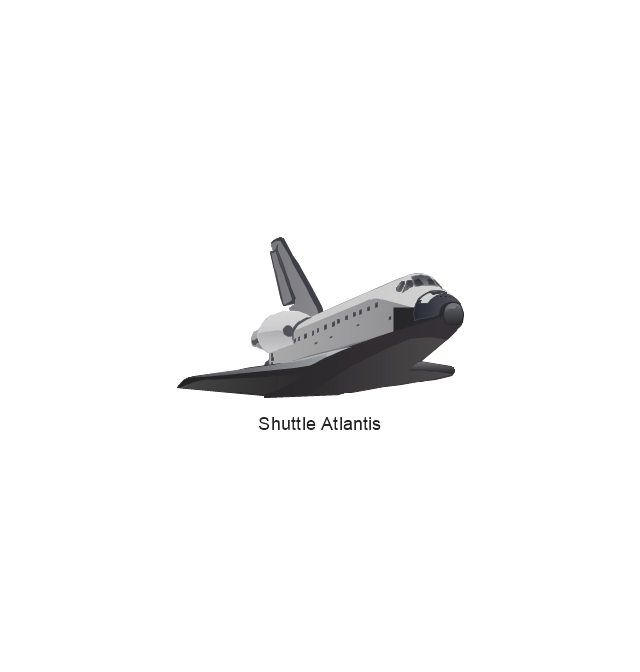
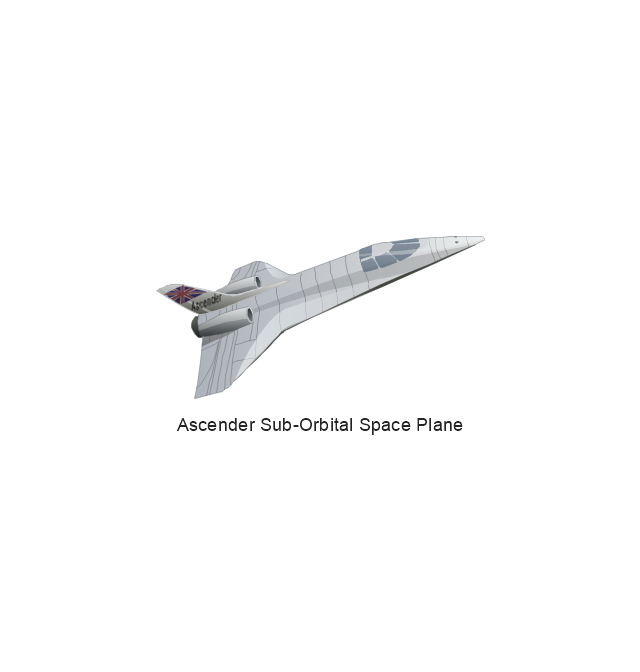
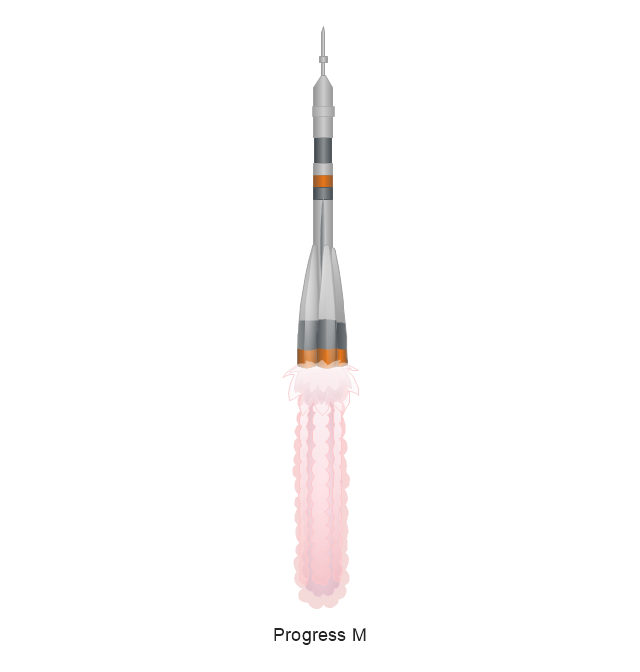
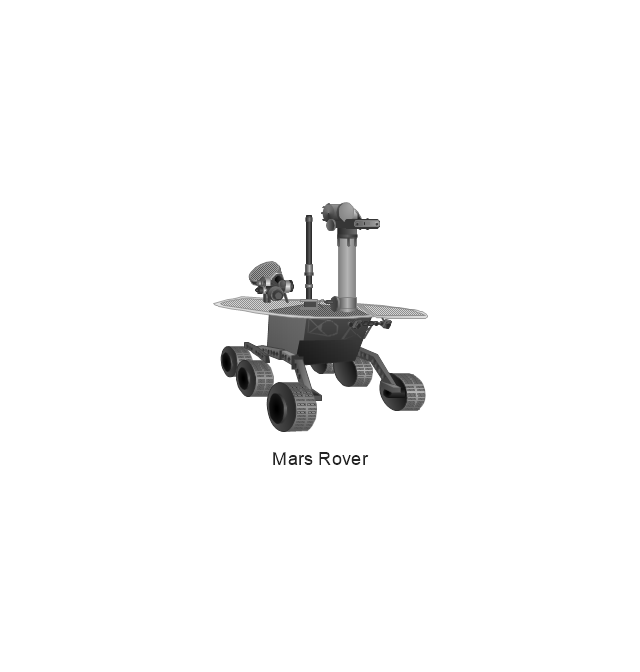
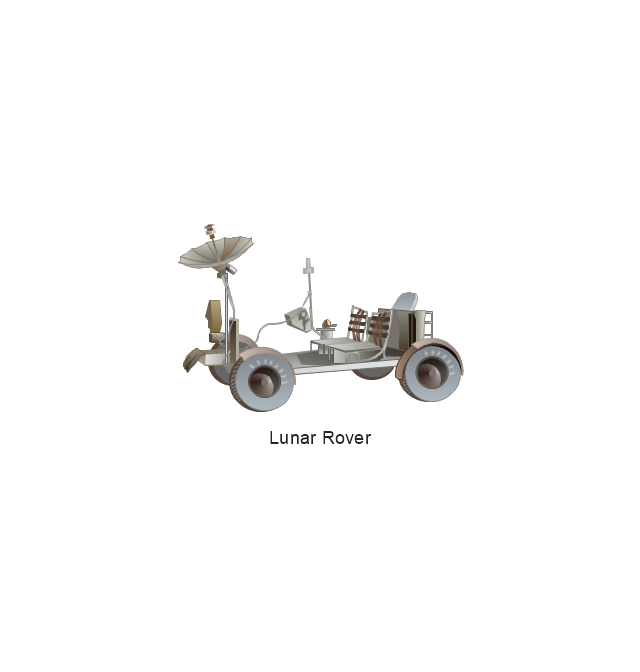
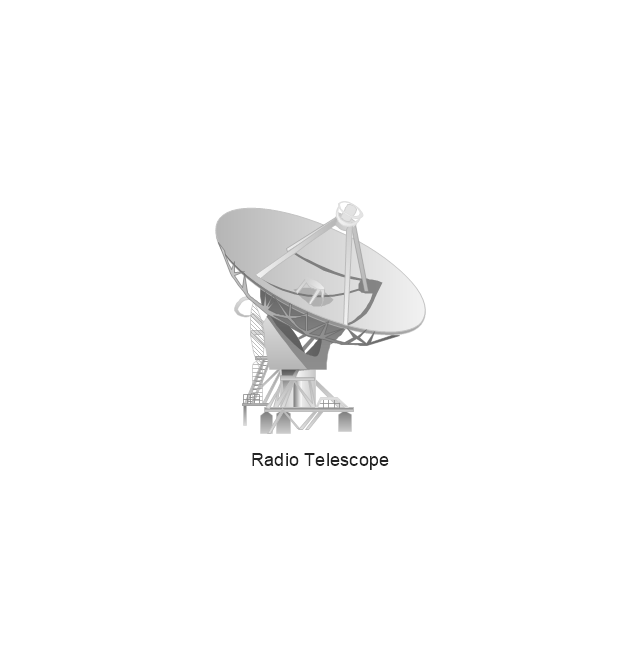
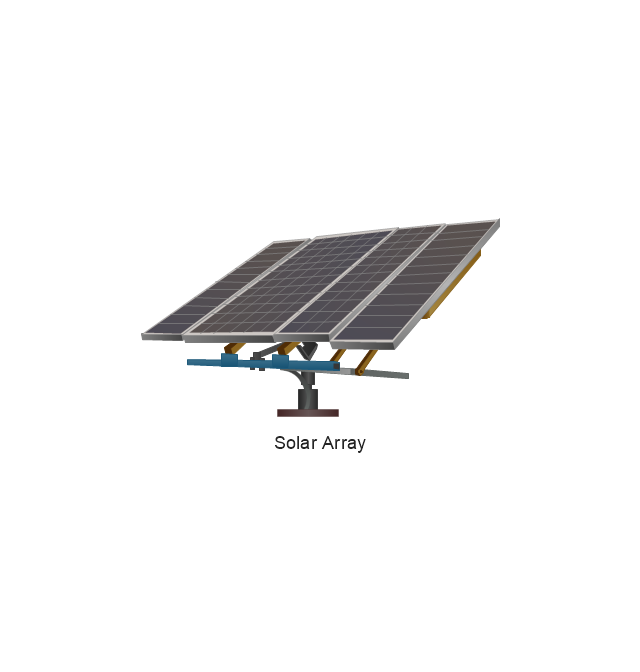
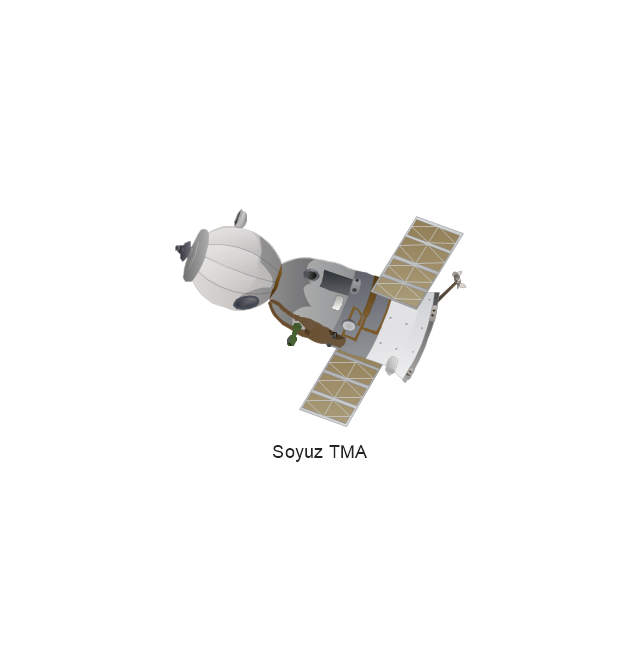
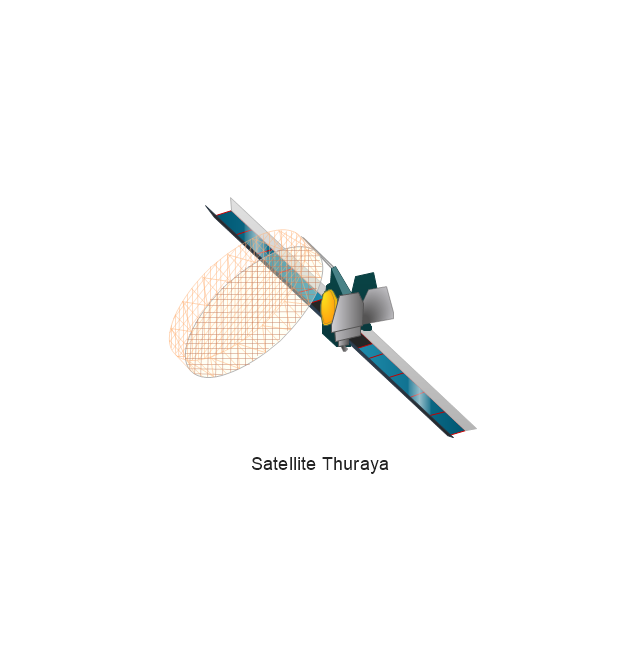
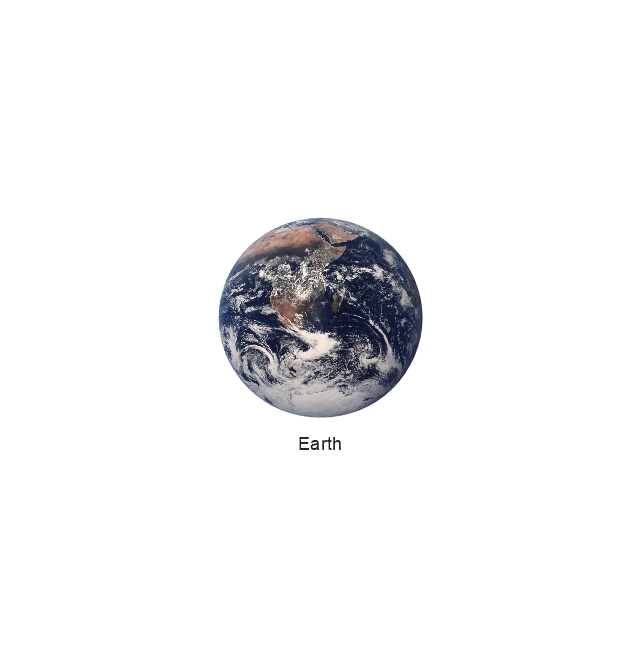
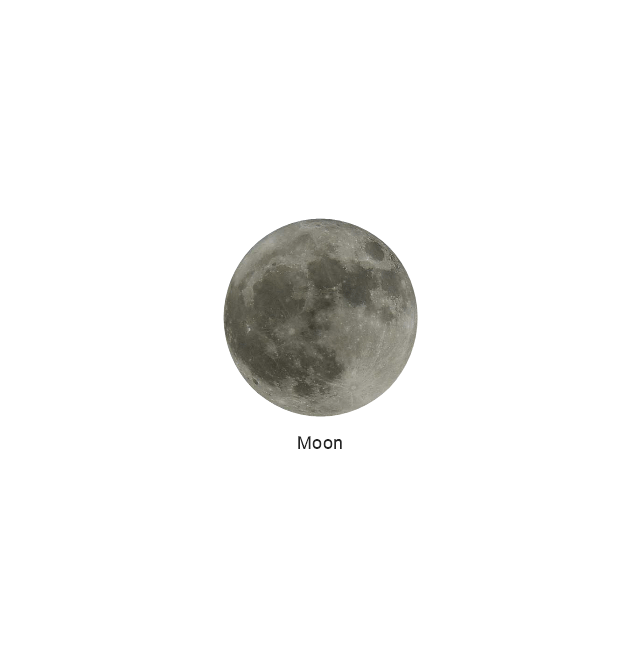
Use vector clipart library Aerospace to illustrate your documents, infographics, presentations and websites with images of space vehicles and objects using ConceptDraw PRO diagramming and vector drawing software.
"A spacecraft is a vehicle, vessel or machine designed to fly in outer space. Spacecraft are used for a variety of purposes, including communications, earth observation, meteorology, navigation, planetary exploration and transportation of humans and cargo.
On a sub-orbital spaceflight, a spacecraft enters space and then returns to the surface, without having gone into an orbit. For orbital spaceflights, spacecraft enter closed orbits around the Earth or around other celestial bodies. Spacecraft used for human spaceflight carry people on board as crew or passengers from start or on orbit (space stations) only, while those used for robotic space missions operate either autonomously or telerobotically. Robotic spacecraft used to support scientific research are space probes. Robotic spacecraft that remain in orbit around a planetary body are artificial satellites." [Spacecraft. Wikipedia]
The vector stencils library Aerospace is included in the Aerospace and Transport solution from Illustration area of ConceptDraw Solution Park.
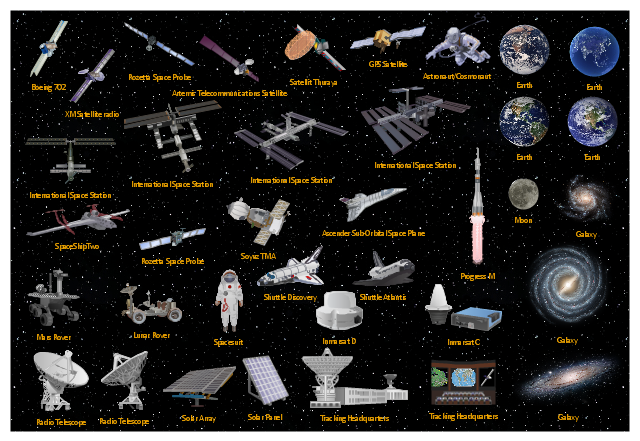
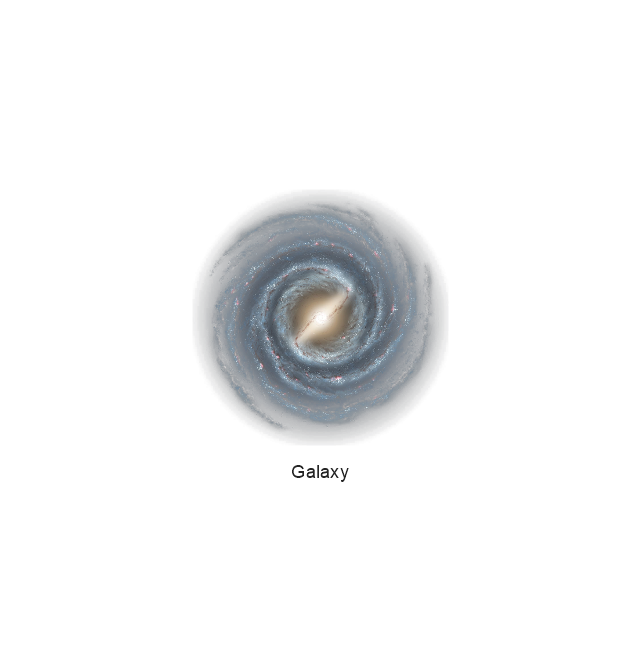
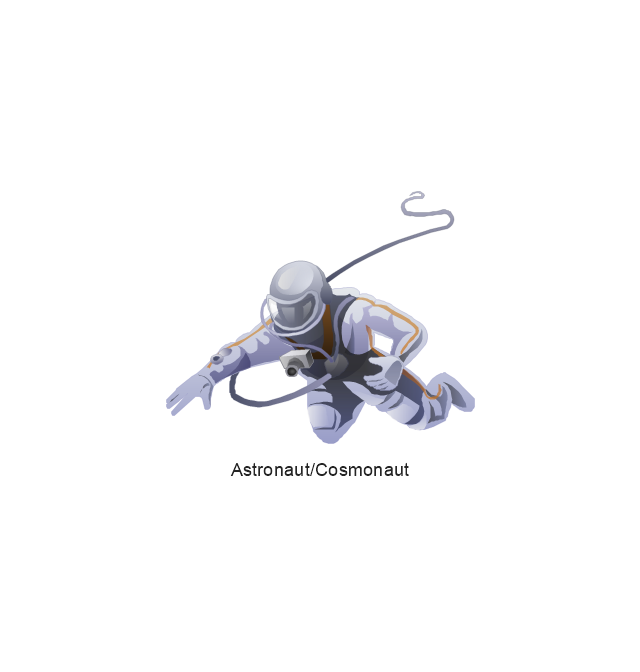
Aerospace illustration template contains vector clipart of space objects: planets and galaxies, satellites and space stations, rockets and shuttles, planet rovers and radio telescopes, etc.
Use it to draw spacecraft illustrations.
"A spacecraft (or spaceship) is a vehicle, vessel or machine designed to fly in outer space. Spacecraft are used for a variety of purposes, including communications, earth observation, meteorology, navigation, planetary exploration and transportation of humans and cargo.
On a sub-orbital spaceflight, a spacecraft enters space and then returns to the surface, without having gone into an orbit. For orbital spaceflights, spacecraft enter closed orbits around the Earth or around other celestial bodies. Spacecraft used for human spaceflight carry people on board as crew or passengers from start or on orbit (space stations) only, while those used for robotic space missions operate either autonomously or telerobotically. Robotic spacecraft used to support scientific research are space probes. Robotic spacecraft that remain in orbit around a planetary body are artificial satellites.
Orbital spacecraft may be recoverable or not. By method of reentry to Earth they may be divided in non-winged space capsules and winged spaceplanes." [Spacecraft. Wikipedia]
The Aerospace illustration template is included in the Aerospace and Transport solution from Illustration area of ConceptDraw Solution Park.
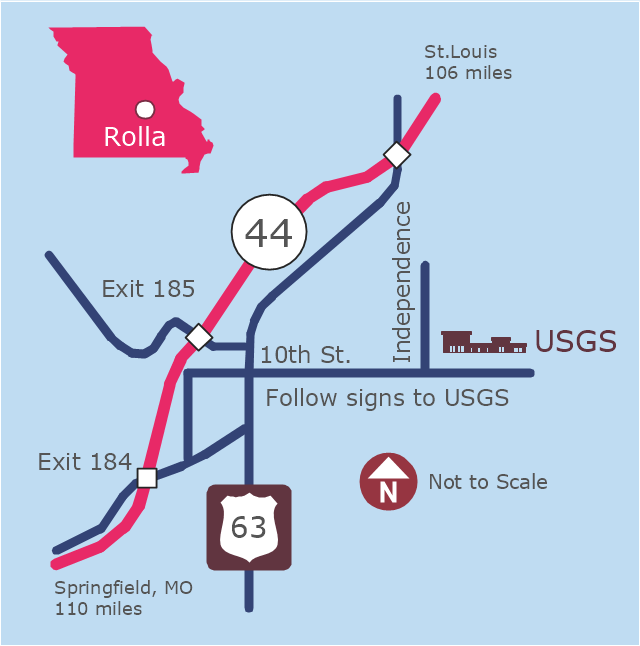
This example was created on the base of the locator map from the website of the Rolla USGS Center. "Rolla USGS Center.
The Rolla USGS is home to the National Geospatial Technical Operations Center, the Missouri Water Science Center, the National Spatial Data Infrastructure Partnership Office Liaisons, and the Rolla Science Information Services office. Employees at this location provide customers with geospatial, geographic, water, biologic and geologic products; science; data; and research, along with offering partnerships and contracting opportunities for local, state, federal, and private entities.
The National Geospatial Technical Operations Center (NGTOC) is a production, research, and data management facility for maps and digital cartographic data products. The work of the NGTOC supports planning and development activities; construction projects; scientific studies; resource management; and environmental monitoring activities, nationwide, at every level of government, academia, and the private sector. The NGTOC in Rolla, along with the other NGTOC site in Denver, plays a key operational role in supporting The National Map, US Topo, The National Atlas™ and all associated products and services, including national coverage of digital orthoimagery, digital elevation data, the National Hydrography Dataset, geographic names, public domain transportation, structures, and governmental units data, and topographic maps. Staff in the Center of Excellence for Geospatial Information Science (CEGIS) are also located in the NGTOC. ... Rolla Missouri Location Map The Rolla USGS Center is located in Rolla, Missouri. Rolla, the county seat of Phelps County, is an attractive mixture of rural and urban life. It is the home of several high-technology businesses and Federal agencies, including the U.S. Geological Survey and the U.S. Forest Service. Missouri University of Science and Technology, a nationally recognized leader in science and technology, has educated students in Rolla for more than 140 years.
Rolla is located at the crossroads of I-44, US 63 and Missouri Highway 72 and is a popular stop on Historic Route 66. Jefferson City, the state capital, is 62 miles to the north, St. Louis lies 106 miles northeast and Springfield is 110 miles southwest." [mcmcweb.er.usgs.gov]
The example "Rolla USGS Center locator map" was created using the ConceptDraw PRO diagramming and vector drawing software extended with the Directional Maps solution from the Maps area of ConceptDraw Solution Park.
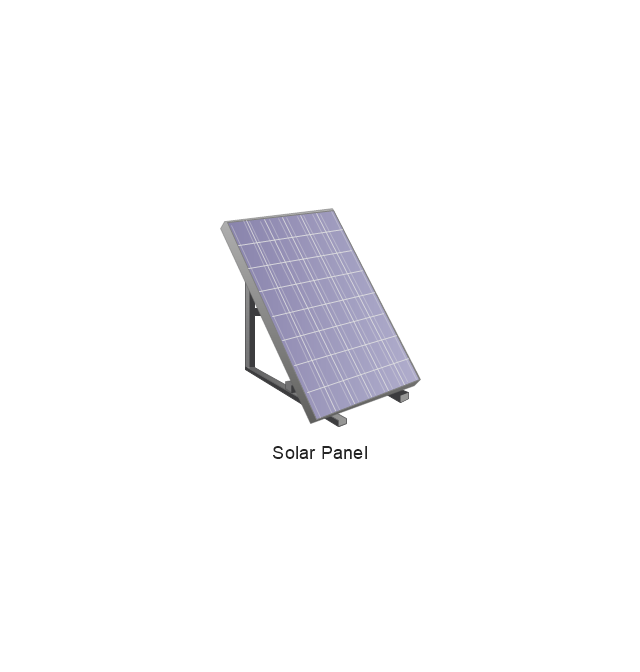
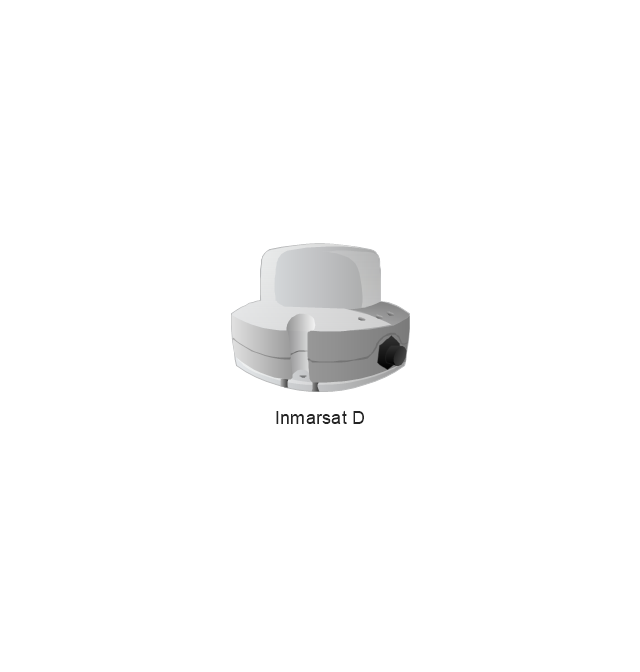
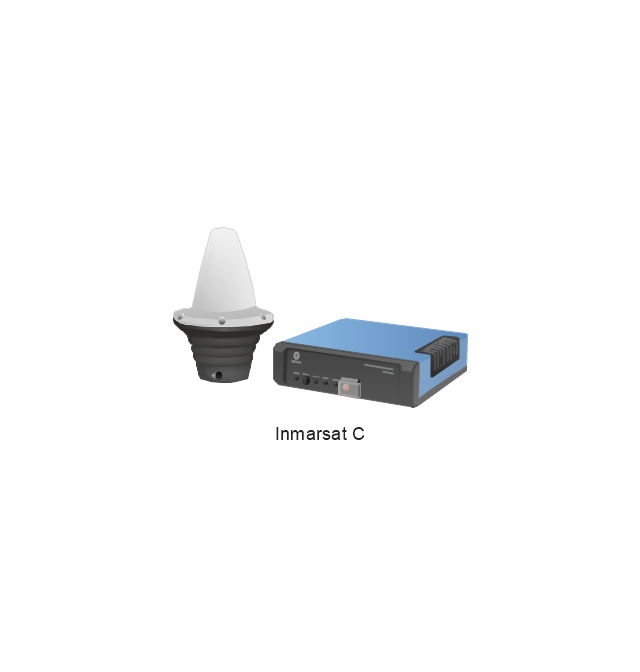
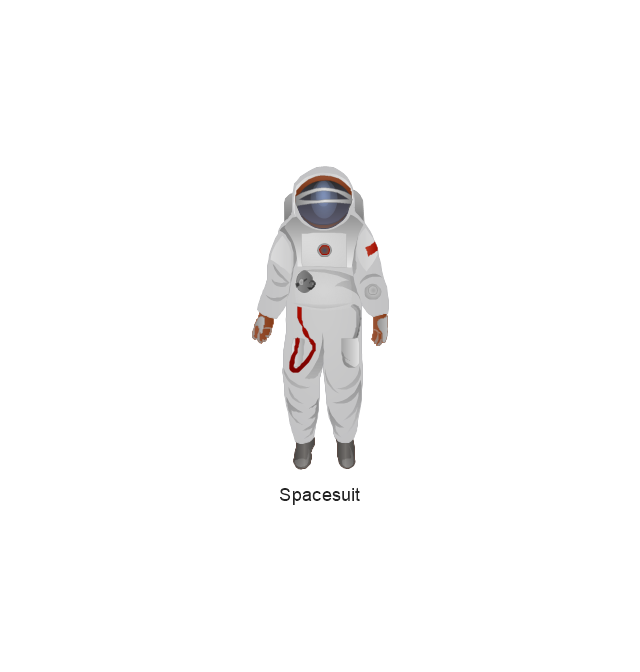
The vector stencils library "Aerospace" contains 38 clip art images for creating aerospace illustrations, presentation slides, infographics and webpages using the ConceptDraw PRO diagramming and vector drawing software.
"Aerospace describes the human effort in science, engineering and business to fly in the atmosphere of Earth (aeronautics) and surrounding space (astronautics). Aerospace organisations research, design, manufacture, operate, or maintain aircraft and/ or spacecraft. Aerospace activity is very diverse, with a multitude of commercial, industrial and military applications.
Aerospace is not the same as airspace, which is the physical air space directly above a location on the ground." [Aerospace. Wikipedia]
The vector stencils library "Aerospace" is included in the Aerospace and Transport solution from the Illustrations area of ConceptDraw Solution Park.
www.conceptdraw.com/ solution-park/ illustrations-aerospace-transport
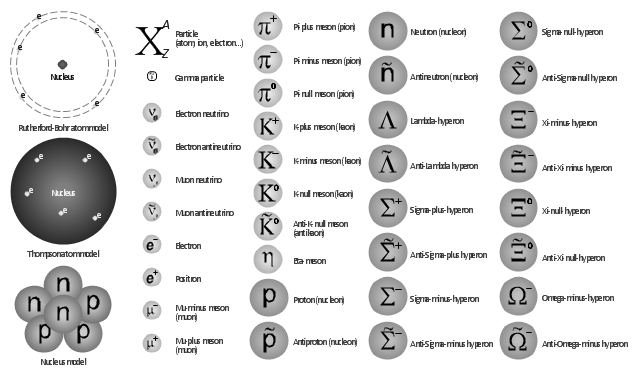
The vector shapes library "Nuclear physics" contains 39 symbol icons of elementary particles for drawing diagrams of nuclear reactions and experiments in nuclear physics.
"Nuclear physics is the field of physics that studies the constituents and interactions of atomic nuclei. The most commonly known applications of nuclear physics are nuclear power generation and nuclear weapons technology, but the research has provided application in many fields, including those in nuclear medicine and magnetic resonance imaging, ion implantation in materials engineering, and radiocarbon dating in geology and archaeology.
The field of particle physics evolved out of nuclear physics and is typically taught in close association with nuclear physics." [Nuclear physics. Wikipedia]
The example "Design elements - Nuclear physics" was created using the ConceptDraw PRO diagramming and vector drawing software extended with the Physics solution from the Science and Education area of ConceptDraw Solution Park.
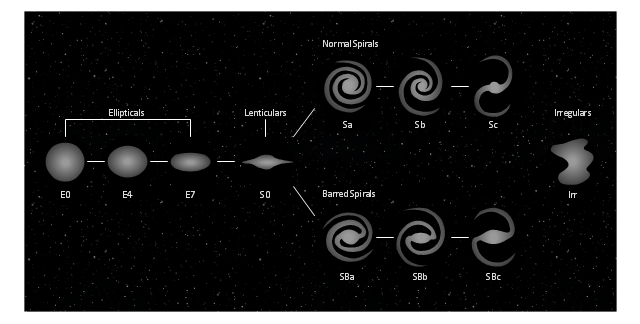
This tuning-fork style diagram of the Hubble sequence was created on the base of the Wikimedia Commons file: Hubble sequence photo.png. [commons.wikimedia.org/ wiki/ File:Hubble_ sequence_ photo.png]
"The Hubble sequence is a morphological classification scheme for galaxies invented by Edwin Hubble in 1936. It is often known colloquially as the Hubble tuning fork diagram because of the shape in which it is traditionally represented.
Hubble’s scheme divides regular galaxies into 3 broad classes - ellipticals, lenticulars and spirals - based on their visual appearance (originally on photographic plates). A fourth class contains galaxies with an irregular appearance. To this day, the Hubble sequence is the most commonly used system for classifying galaxies, both in professional astronomical research and in amateur astronomy." [Hubble sequence. Wikipedia]
The astronomical diagram example "Tuning-fork style diagram of the Hubble sequence" was created using the ConceptDraw PRO diagramming and vector drawing software extended with the Astronomy solution from the Science and Education area of ConceptDraw Solution Park.
- Research cycle - Circle diagram | Export from ConceptDraw PRO ...
- Research cycle - Circle diagram | Political map of Central America ...
- Mission Control Clipart Png
- Vector Backgrounds Png
- Research cycle - Circle diagram | DroidDia PRO unlocker | Porter ...
- Research cycle - Circle diagram | 3 Circle Venn Diagram. Venn ...
- Presentation Vector Png
- Presentation design elements - Vector clipart library | Presentation ...
- Presentation design elements - Vector clipart library | Plus And ...
- Business feedback loop | Research cycle - Circle diagram | Life ...
- Business People Vector Png
- Hand Vector Art Png
- Colorful Circle Png
- Galaxy Planets Png Image
- Clipart Transportation Illustration Vector Png Clipart
- People Clipart Png
- Vector Growth Png
- Arrows - Vector clipart library | Presentation design elements ...
- Presentation design elements - Vector clipart library | Seating Plans ...
- Presentation design elements - Vector clipart library | HR arrows ...

