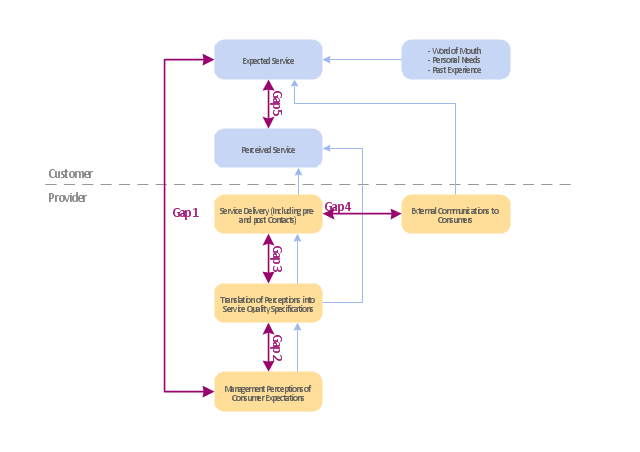
"Dimensions of service quality.
A customer's expectation of a particular service is determined by factors such as recommendations, personal needs and past experiences. The expected service and the perceived service sometimes may not be equal, thus leaving a gap. The service quality model or the ‘GAP model’ developed by a group of authors- Parasuraman, Zeithaml and Berry at Texas and North Carolina in 1985 , highlights the main requirements for delivering high service quality. It identifies five ‘gaps’ that cause unsuccessful delivery. Customers generally have a tendency to compare the service they 'experience' with the service they 'expect' . If the experience does not match the expectation , there arises a gap. Ten determinants that may influence the appearance of a gap were described by Parasuraman, Zeithaml and Berry. in the SERVQUAL model: reliability, responsiveness, competence, access, courtesy, communication, credibility, security, understanding the customer and tangibles.
Later, the determinants were reduced to five: tangibles; reliability; responsiveness; service assurance and empathy in the so called RATER model." [Service quality. Wikipedia]
The block diagram example "Gap model of service quality" was created using the ConceptDraw PRO diagramming and vector drawing software extended with the Block Diagrams solution from the area "What is a Diagram" of ConceptDraw Solution Park.
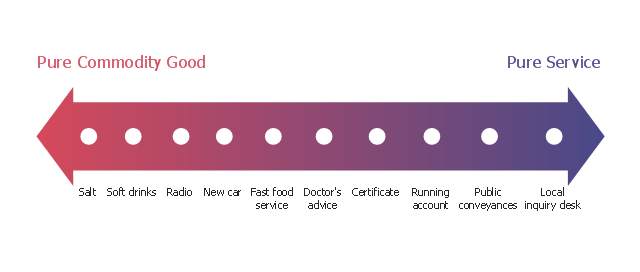
"The dichotomy between physical goods and intangible services is an oversimplification; these are not discrete categories. Most business theorists see a continuum with pure service at one endpoint and pure commodity goods at the other endpoint. Most products fall between these two extremes. Goods are normally structural and can be transferred in an instant while services are delivered over a period of time. Goods can be returned while a service once delivered cannot. Goods are not always tangible and may be virtual." [Goods and services. Wikipedia]
The example "Service-goods continuum diagram" was created using the ConceptDraw PRO diagramming and vector drawing software extended with the Marketing Diagrams solution from the Marketing area of ConceptDraw Solution Park.
The example "Service-goods continuum diagram" was created using the ConceptDraw PRO diagramming and vector drawing software extended with the Marketing Diagrams solution from the Marketing area of ConceptDraw Solution Park.
"Telecommunication is communication at a distance by technological means, particularly through electrical signals or electromagnetic waves. ...
Electrical and electromagnetic telecommunication technologies include telegraph, telephone, and teleprinter, networks, radio, microwave transmission, fiber optics, communications satellites and the Internet." [Telecommunication. Wikipedia]
"A telecommunications service provider or TSP is a type of communications service provider that has traditionally provided telephone and similar services. This category includes incumbent local exchange carriers, competitive local exchange carriers, and mobile wireless communication companies. ...
While some people use the terms "telecom service provider" and "communications service provider" interchangeably, the term TSP generally excludes Internet service providers (ISPs), cable companies, satellite TV, and managed service providers. ...
TSPs provide access to telephone and related communications services." [Telecommunications service provider. Wikipedia]
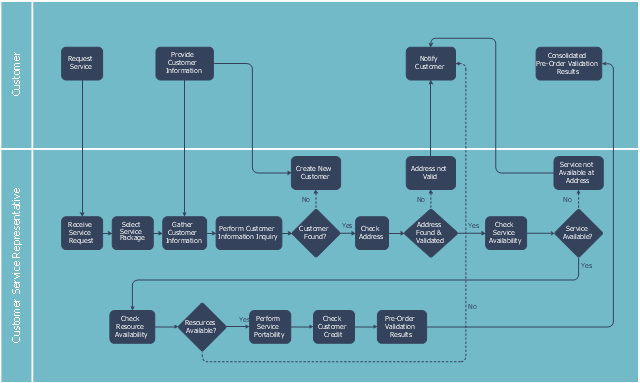
The cross-functional flowchart example "Providing telecom services" was created using the ConceptDraw PRO diagramming and vector drawing software extended with the Cross-Functional Flowcharts solution from the Business Processes area of ConceptDraw Solution Park.
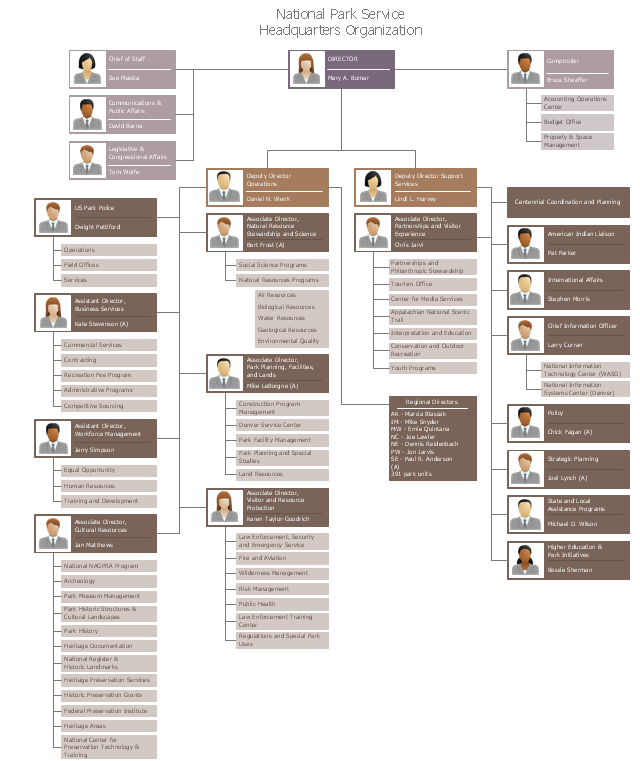
This organization chart of the National Park Service was redesigned from the Wikimedia Commons file: WASO Org Chart.JPG. [commons.wikimedia.org/ wiki/ File:WASO_ Org_ Chart.JPG]
"The National Park Service in the United States is a Bureau of the Department of the Interior with its headquarters located in Washington, D.C. The bureau consist of numerous support offices and seven regional offices, which oversee park operations within their geographic area." [Organization of the National Park Service. Wikipedia]
The org chart sample "National Park Service" was created using the ConceptDraw PRO diagramming and vector drawing software extended with the 25 Typical Organizational Charts solution from the Management area of ConceptDraw Solution Park.
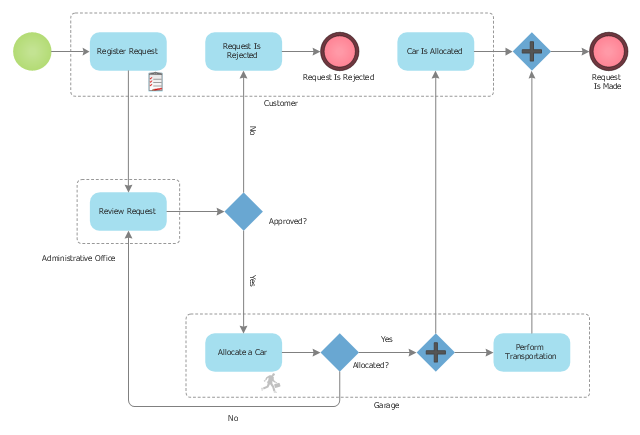
"A business process or business method is a collection of related, structured activities or tasks that produce a specific service or product (serve a particular goal) for a particular customer or customers. It often can be visualized with a flowchart as a sequence of activities with interleaving decision points or with a Process Matrix as a sequence of activities with relevance rules based on data in the process. ...
There are three types of business processes:
(1) Management processes, the processes that govern the operation of a system. Typical management processes include "corporate governance" and "strategic management".
(2) Operational processes, processes that constitute the core business and create the primary value stream. Typical operational processes are purchasing, manufacturing, advertising and marketing, and sales.
(3) Supporting processes, which support the core processes. Examples include accounting, recruitment, call center, technical support. ...
The ... improvement areas are equally applicable to policies, processes and detailed procedures (sub-processes/ tasks). There is a cascading effect of improvements made at a higher level on those made at a lower level.
For instance, if a recommendation to replace a given policy with a better one is made with proper justification and accepted in principle by business process owners, then corresponding changes in the consequent processes and procedures will follow naturally in order to enable implementation of the policies" [Business process. Wikipedia]
The BPMN 1.2 (Business Process Model and Notation) diagram example "Taxi service order procedure" was created using the ConceptDraw PRO diagramming and vector drawing software extended with the Business Process Diagram solution from the Business Processes area of ConceptDraw Solution Park.
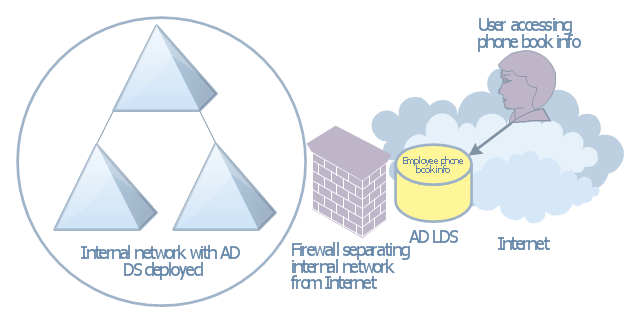
This AD diagram example was created based on the picture "AD LDS as a phone book service" from the book "Active Directory for Dummies".
"Directory services are a great way of providing information that can be fre-
quently retrieved and searched on in a hierarchical way. ... Well, there’s no reason that you can’t create a directory service that’s actually a phone book. Imagine that you need to make a searchable phone directory of your organization available on the Internet. ... This isn’t a difficult task, but it has security repercussions. If you’ve already deployed AD DS and you have the employees’ phone numbers available in that directory, it might not be a good idea to expose your AD DS environment to the Internet for security reasons. Using AD LDS is a great alternative because it can be deployed separately from AD DS and it’s designed to simply provide the information retrieval service that you need without the complications involved with Kerberos authentication and group policies." [Steve Clines and Marcia Loughry, Active Directory® For Dummies®, 2nd Edition. 2008]
The Active Directory diagram example "AD LDS as a phone book service" was created using the ConceptDraw PRO diagramming and vector drawing software extended with the Active Directory Diagrams solution from the Computer and Networks area of ConceptDraw Solution Park.
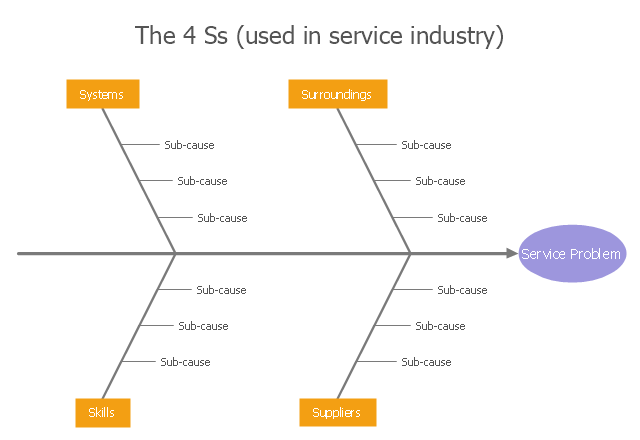
"Causes in the diagram are often categorized, such as to ...
The 5 Ss (used in service industry):
(1) Samples;
(2) Scheme;
(3) Synchronous;
(4) Skin;
(5) Search." [Ishikawa diagram. Wikipedia]
This service 4 Ss Ishikawa diagram (cause and effect diagram) template is included in the Fishbone Diagram solution from the Management area of ConceptDraw Solution Park.
- Service -goods continuum diagram | How To create Diagrams for ...
- Fishbone Diagram Example For Service Industry
- Service -goods continuum diagram | Product Service Continuum ...
- Copying Service Process Flowchart. Flowchart Examples
- Block diagram - Gap model of service quality | Process Flowchart ...
- Taxi service - Workflow diagram | Workflow Process Example | Taxi ...
- Process Flowchart | Copying Service Process Flowchart. Flowchart ...
- Service 8 Ps fishbone diagram - Template | Fishbone Diagram ...
- How To create Diagrams for Amazon Web Services architecture ...
- Diagramming tool - Amazon Web Services and Cloud Computing ...
- Amazon Web Services Diagrams diagramming tool for architecture ...
- Service Request Workflow Diagram
- Process Flowchart | Hotel Service Process | Copying Service ...
- Cicso Intelligent Service Gateway Isg
- Activity Diagram For Car Service App
- Fishbone Diagrams | Service 4 Ss fishbone diagram - Template ...
- Block diagram - Gap model of service quality | Block Diagram ...
- Customer Service Workflow Diagram
- Block diagram - Gap model of service quality | Model Based ...
- Service -goods continuum diagram | Marketing diagrams - Vector ...
