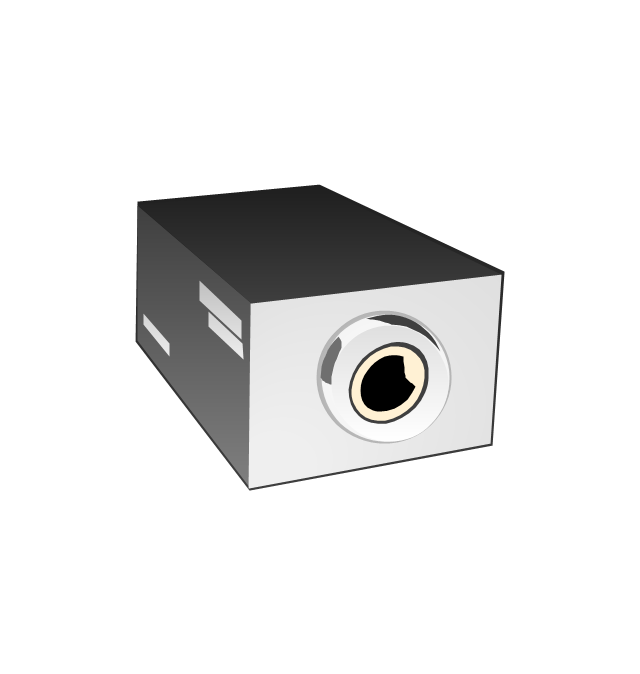
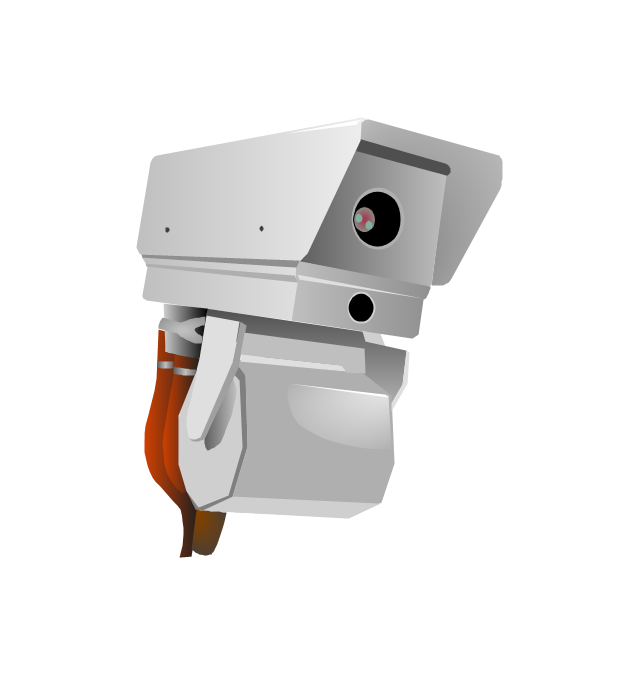
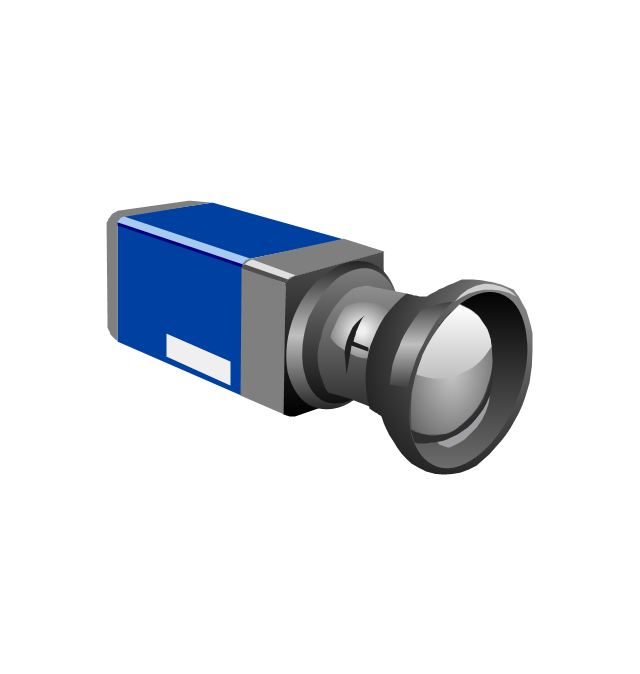
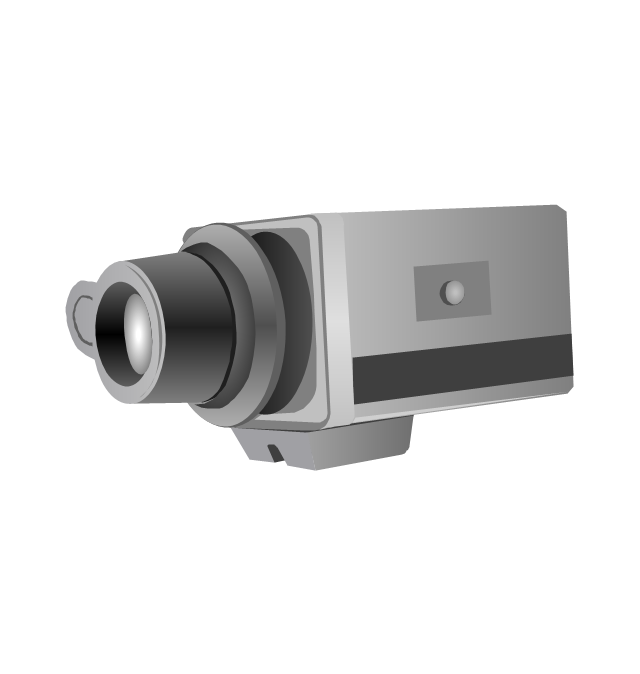
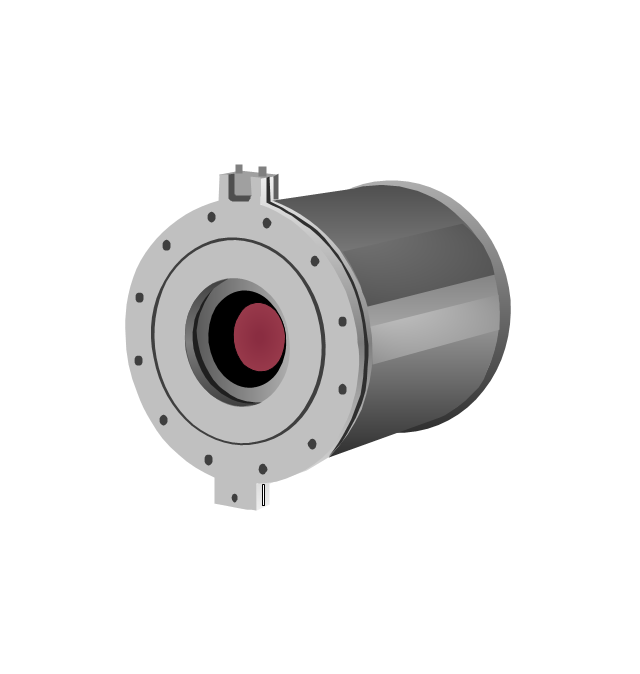
The vector stencils library "Cable TV" contains 64 symbols of cable TV network equipment.
Use these shapes for drawing CATV system design floor plans, network topology diagrams, wiring diagrams and cabling layout schemes in the ConceptDraw PRO diagramming and vector drawing software.
The vector stencils library "Cable TV" is included in the Electric and Telecom Plans solution from the Building Plans area of ConceptDraw Solution Park.
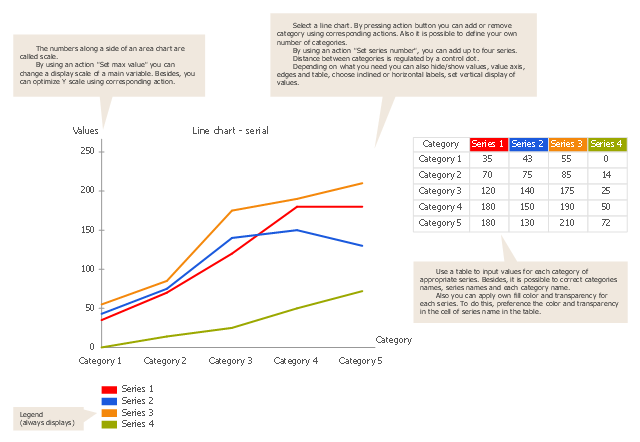
Use this template to design your line graphs.
"A time series is a sequence of data points, measured typically at successive points in time spaced at uniform time intervals. ... Time series are very frequently plotted via line charts. Time series are used in statistics, signal processing, pattern recognition, econometrics, mathematical finance, weather forecasting, earthquake prediction, electroencephalography, control engineering, astronomy, and communications engineering. Time series analysis comprises methods for analyzing time series data in order to extract meaningful statistics and other characteristics of the data. Time series forecasting is the use of a model to predict future values based on previously observed values. While regression analysis is often employed in such a way as to test theories that the current values of one or more independent time series affect the current value of another time series, this type of analysis of time series is not called "time series analysis", which focuses on comparing values of time series at different points in time. Time series data have a natural temporal ordering." [Time series. Wikipedia]
The line graph template for the ConceptDraw PRO diagramming and vector drawing software is included in the Line Graphs solution from the Graphs and Charts area of ConceptDraw Solution Park.
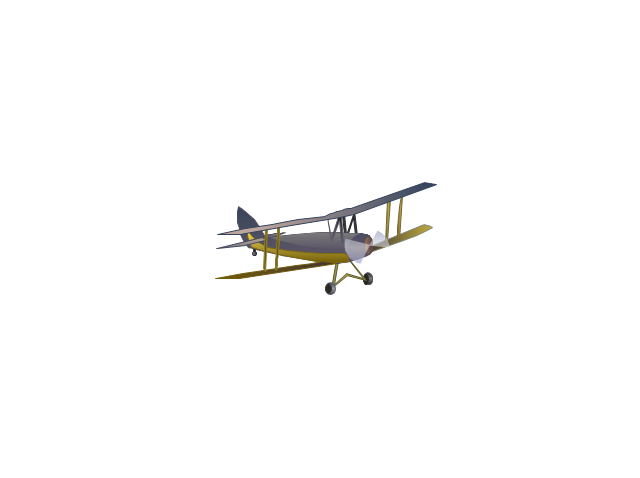
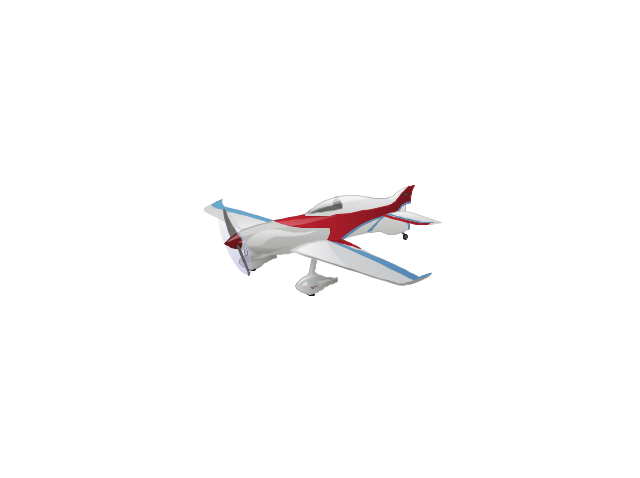
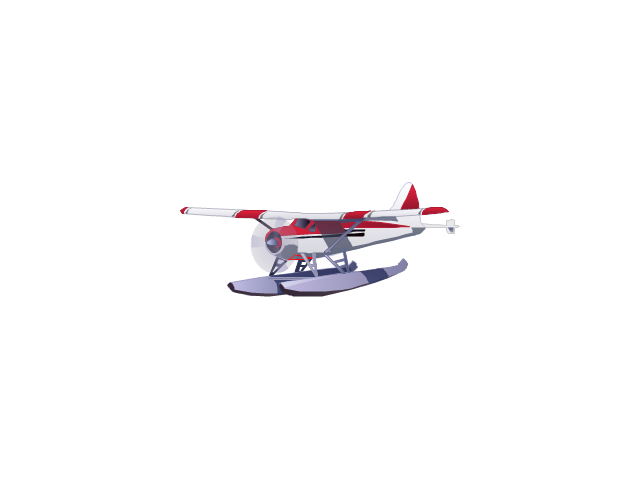
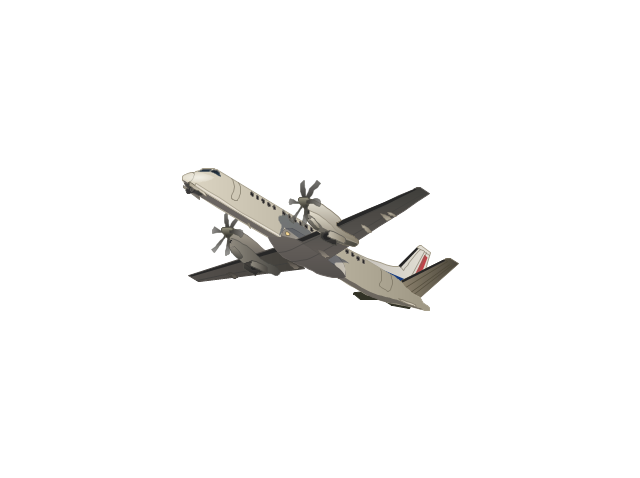
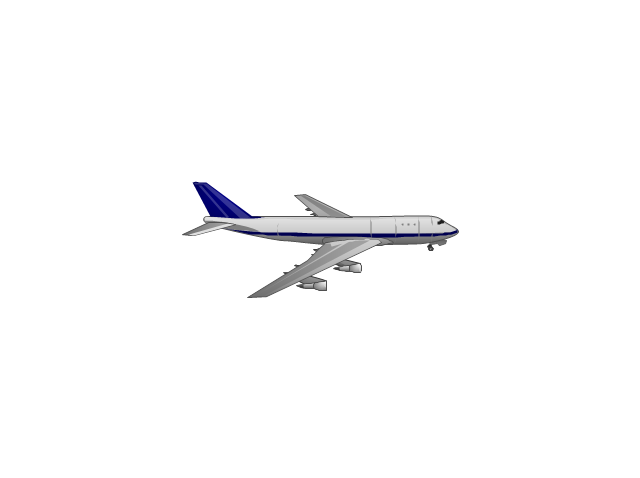
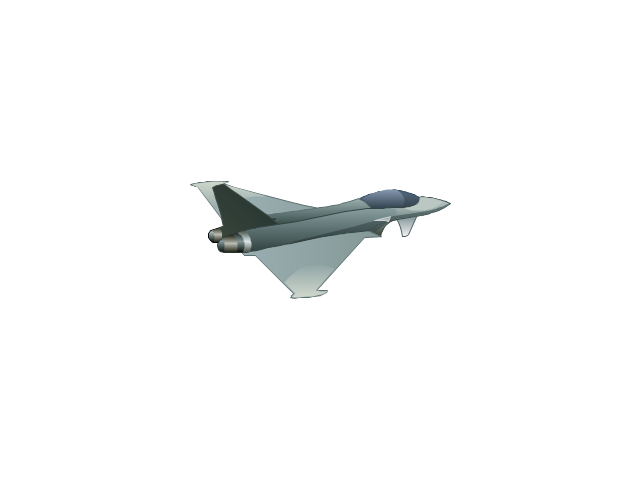
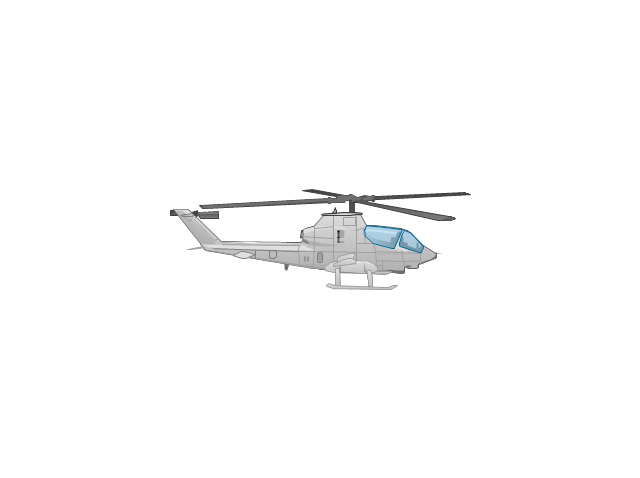
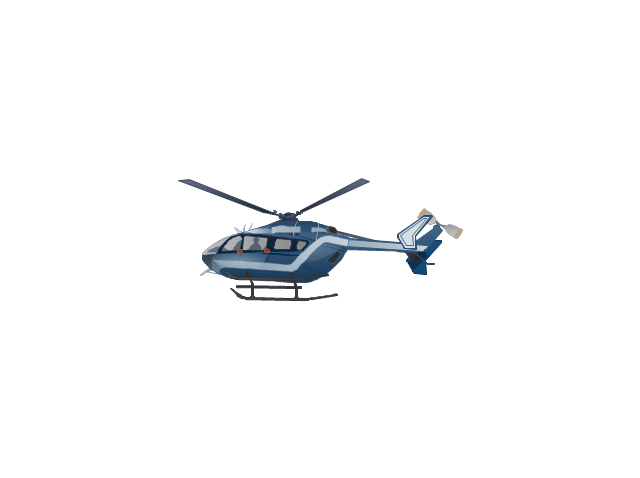
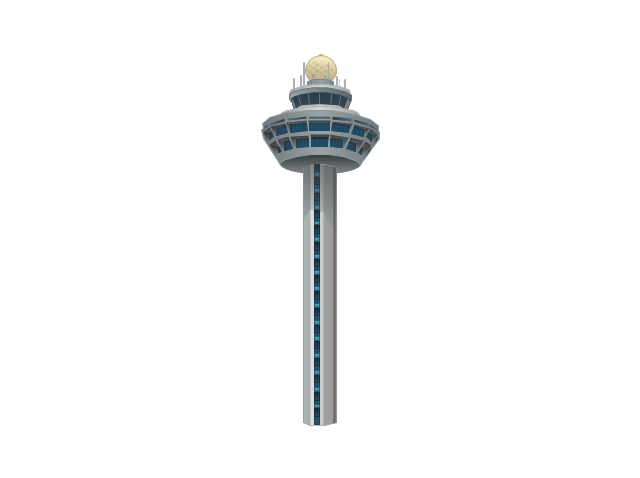
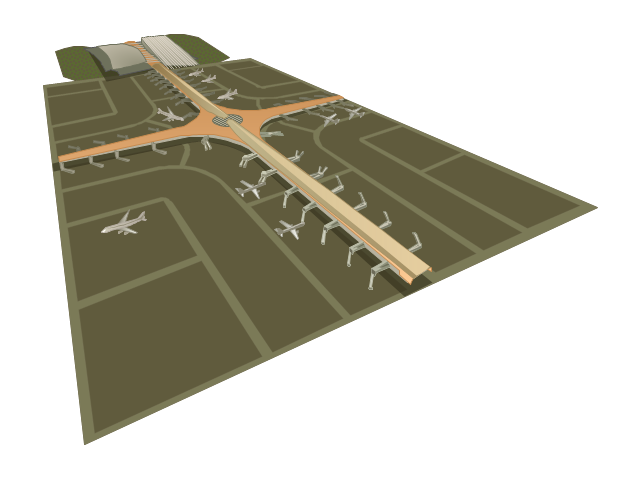
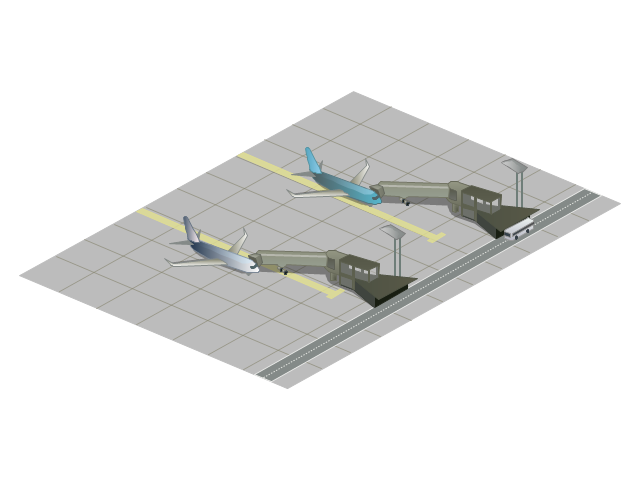
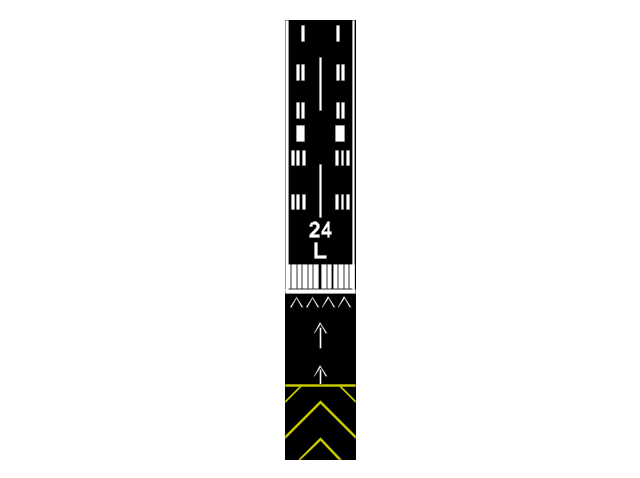
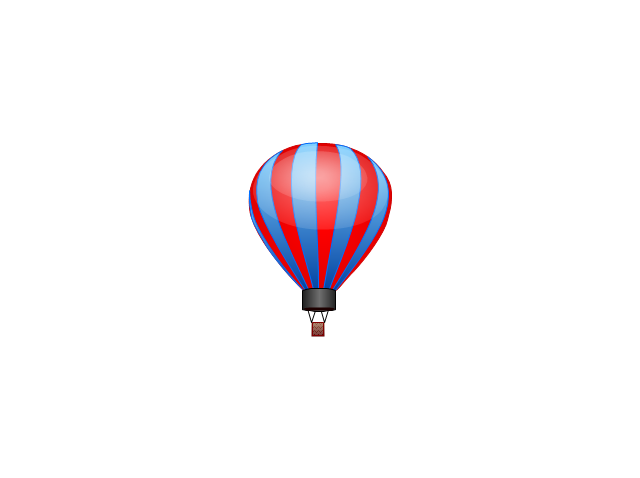
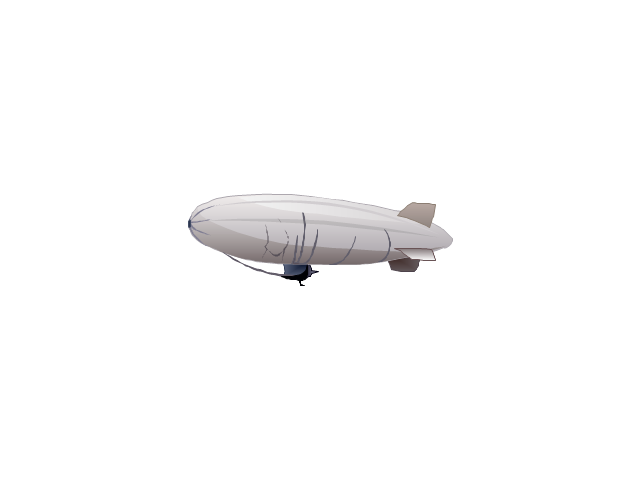
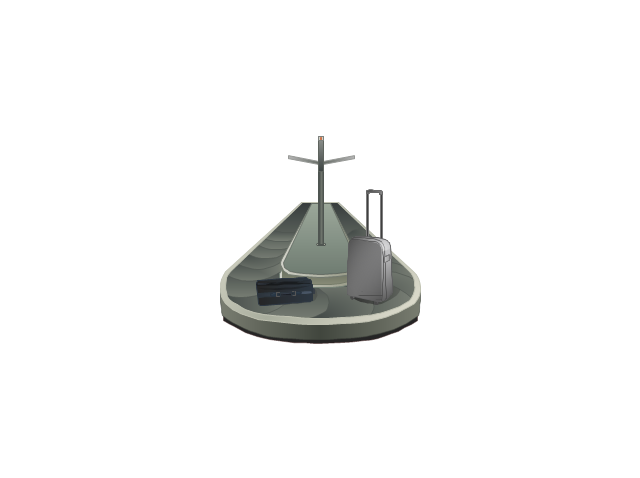
The vector stencils library "Aircraft" contains 19 clip art images for creating aviation illustrations, presentation slides, infographics and webpages using the ConceptDraw PRO diagramming and vector drawing software.
"An aircraft is a machine that is able to fly by gaining support from the air, or, in general, the atmosphere of a planet. It counters the force of gravity by using either static lift or by using the dynamic lift of an airfoil, or in a few cases the downward thrust from jet engines.
The human activity that surrounds aircraft is called aviation. Crewed aircraft are flown by an onboard pilot, but unmanned aerial vehicles may be remotely controlled or self-controlled by onboard computers. Aircraft may be classified by different criteria, such as lift type, propulsion, usage and others." [Aircraft. Wikipedia]
The vector stencils library "Aircraft" is included in the Aerospace and Transport solution from the Illustrations area of ConceptDraw Solution Park.
www.conceptdraw.com/ solution-park/ illustrations-aerospace-transport
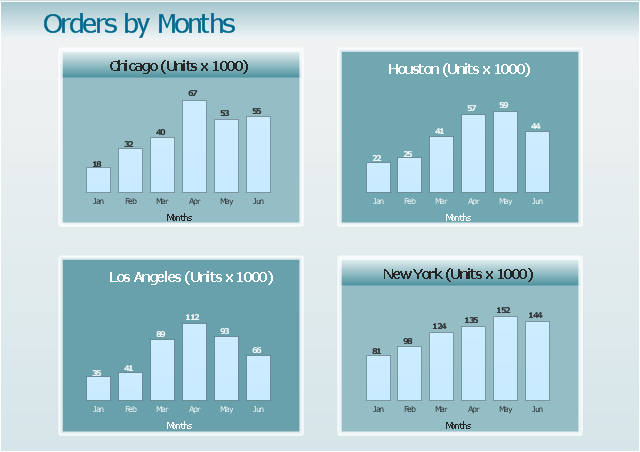
"A time series is a sequence of data points, measured typically at successive points in time spaced at uniform time intervals. ... Time series are very frequently plotted via line charts. Time series are used in statistics, signal processing, pattern recognition, econometrics, mathematical finance, weather forecasting, earthquake prediction, electroencephalography, control engineering, astronomy, and communications engineering.
Time series analysis comprises methods for analyzing time series data in order to extract meaningful statistics and other characteristics of the data. Time series forecasting is the use of a model to predict future values based on previously observed values." [Time series. Wikipedia]
The example "Orders by months - Time series dashboard" was created using the ConceptDraw PRO diagramming and vector drawing software extended with the Time Series Dashboard solution from the area "What is a Dashboard" of ConceptDraw Solution Park.
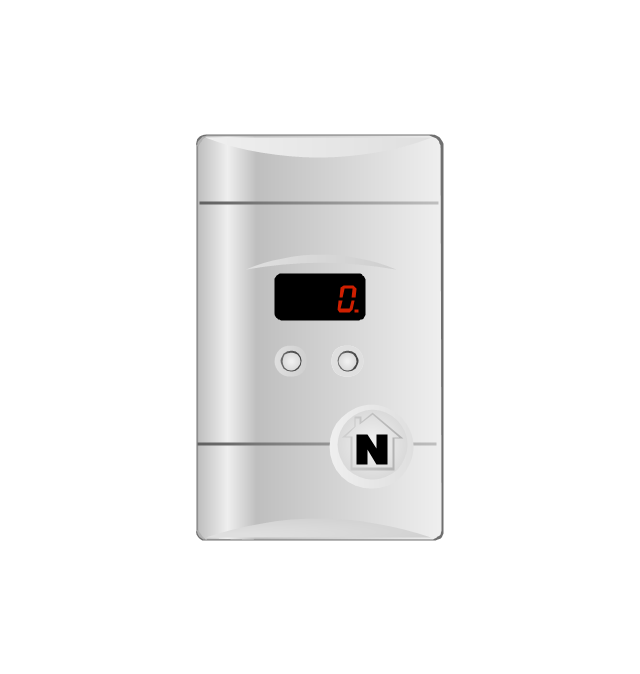
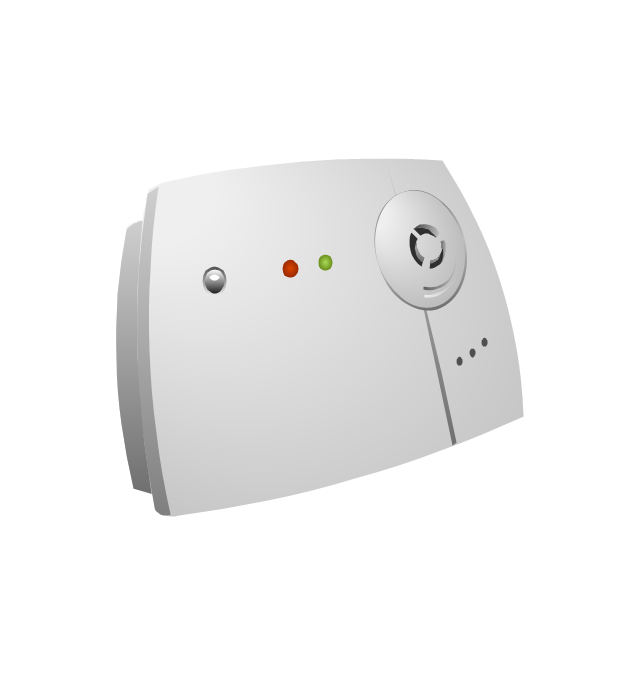
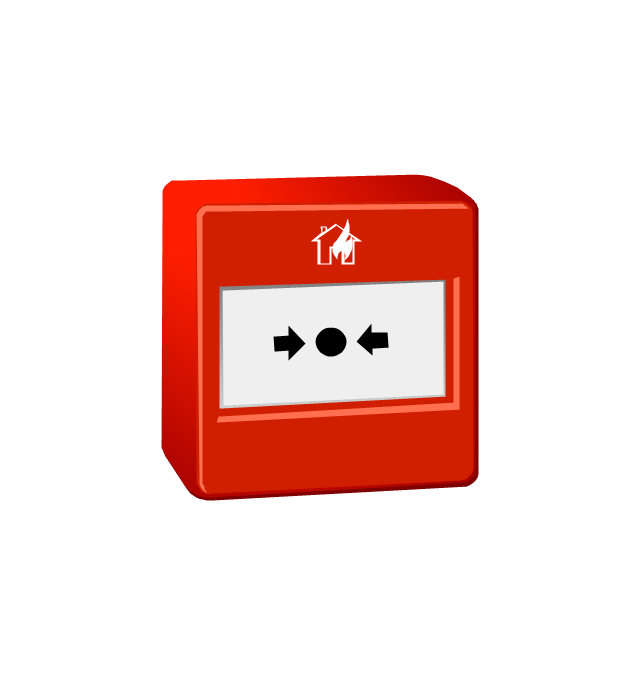
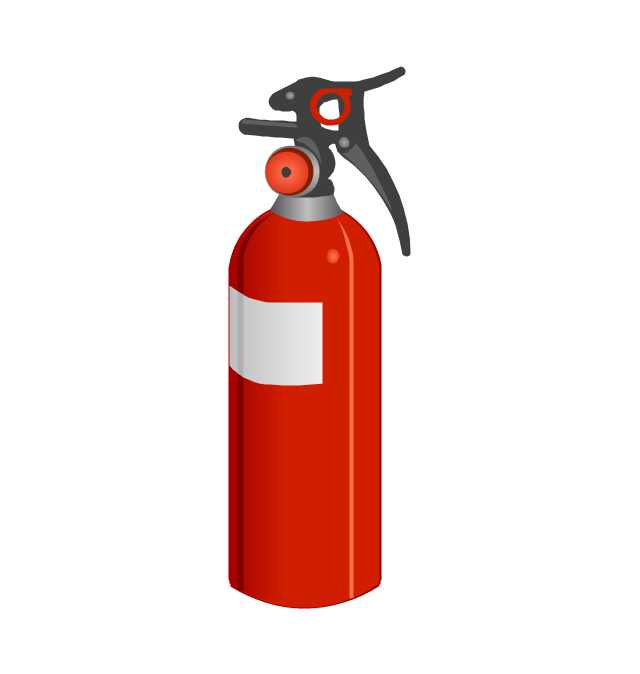
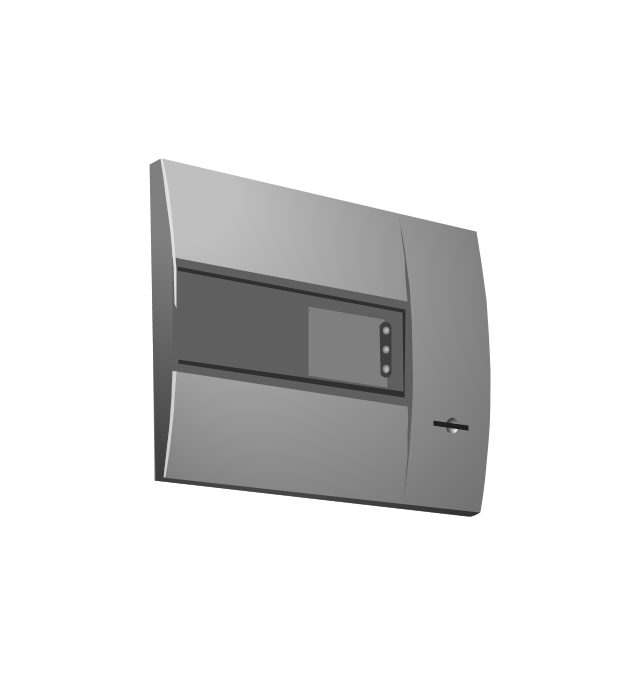
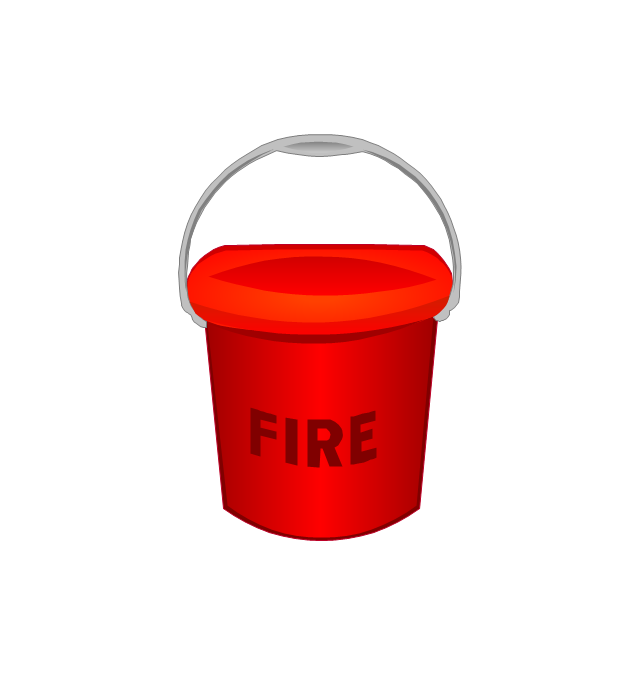
The vector stencils library "Fire safety equipment" contains 19 clipart images of fire safety equipment which you can easy use in your presentations and illustrations.
"Fire safety refers to precautions that are taken to prevent or reduce the likelihood of a fire that may result in death, injury, or property damage, alert those in a structure to the presence of an uncontrolled fire in the event one occurs, better enable those threatened by fire to survive in and evacuate from affected areas, or to reduce the damage caused by a fire. Fire safety measures include those that are planned during the construction of a building or implemented in structures that are already standing, and those that are taught to occupants of the building.
Threats to fire safety are referred to as fire hazards. A fire hazard may include a situation that increases the likelihood a fire may start or may impede escape in the event a fire occurs." [Fire safety. Wikipedia]
The clip art example "Fire safety equipment - Vector stencils library" was created in the ConceptDraw PRO diagramming and vector drawing software using the Presentation Clipart solution from the Illustration area of ConceptDraw Solution Park.
www.conceptdraw.com/ solution-park/ illustrations-presentation-clipart
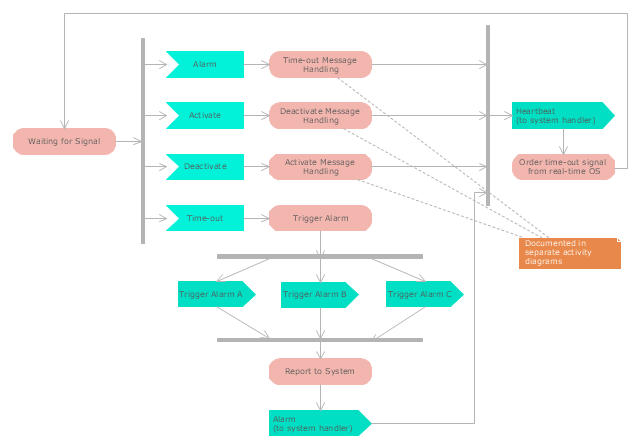
"Alarm triggers.
The individual triggers for a car alarm vary widely, depending on the make and model of the vehicle, and the brand and model of the alarm itself (for aftermarket alarms). Since aftermarket alarms are designed to be universal (i.e., compatible with all 12 volt negative ground electrical systems as opposed to one carmaker's vehicles), these commonly have trigger inputs that the installer/ vehicle owner chooses not to connect, which additionally determines what will set the alarm off." [Car alarm. Wikipedia]
The UML activity diagram example " Alarm trigger processing" was created using the ConceptDraw PRO diagramming and vector drawing software extended with the Rapid UML solution from the Software Development area of ConceptDraw Solution Park.
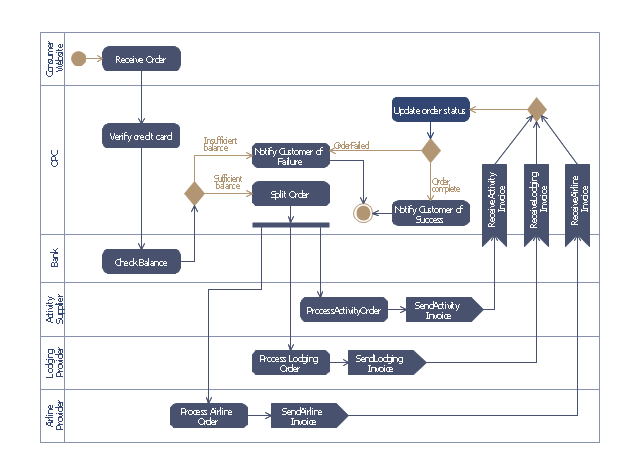
This purchase order processing UML activity diagram was created on the base of activity diagram from the software architecture documentation wiki of the Software Engineering Institute (SEI) of Carnegie Mellon University (CMU).
[wiki.sei.cmu.edu/ sad/ index.php/ Image:PurchaseOrderActivityDiagram.png]
"A purchase order (PO) is a commercial document and first official offer issued by a buyer to a seller, indicating types, quantities, and agreed prices for products or services. Acceptance of a purchase order by a seller forms a contract between the buyer and seller, so no contract exists until the purchase order is accepted. It is used to control the purchasing of products and services from external suppliers.
Creating a purchase order is typically the first step of the purchase to pay process in an ERP system." [Purchase order. Wikipedia]
This purchase order processing UML activity diagram example was created using the ConceptDraw PRO diagramming and vector drawing software extended with the ATM UML Diagrams solution from the Software Development area of ConceptDraw Solution Park.
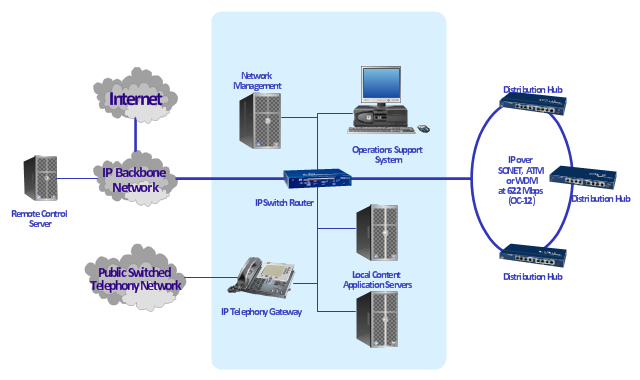
"A cable television headend is a master facility for receiving television signals for processing and distribution over a CATV system. The headend facility is normally unstaffed and surrounded by some type of security fencing and is typically a building or large shed housing electronic equipment used to receive and re-transmit video over the local cable infrastructure. One can also find head ends in power line communication (PLC) substations and Internet communications networks." [Cable television headend. Wikipedia]
This regional cable head-end diagram example was created using the ConceptDraw PRO diagramming and vector drawing software extended with the Computer and Networks solution from the Computer and Networks area of ConceptDraw Solution Park.
This regional cable head-end diagram example was created using the ConceptDraw PRO diagramming and vector drawing software extended with the Computer and Networks solution from the Computer and Networks area of ConceptDraw Solution Park.
The vector stencils library "Audio" contains 91 audio, sound and music icons. Use it to design your audio, video and multimedia illustrations, presentations, web pages and infographics with ConceptDraw PRO diagramming and vector drawing software.
"Digital audio refers to technology that can be used to record, store, generate, manipulate, and reproduce sound using audio signals encoded in digital form. Following significant advances in digital audio technology during the 1970s, it rapidly replaced analog audio technology in most areas of sound production, sound engineering and telecommunications. Sound is converted to an analog electrical signal by a microphone, then an analog-to-digital converter (ADC), typically using pulse-code modulation, is used to convert it to a digital signal. A digital-to-analog converter performs the reverse process, converting a digital signal back into an analog signal, which can be converted to an audible sound by a loudspeaker. Digital audio systems may include compression, storage, processing and transmission components. Conversion to a digital format allows convenient manipulation, storage, transmission and retrieval of an audio signal." [Digital audio. Wikipedia]
The vector stencils library "Audio" is included in the Audio, Video, Media solution from the Illustration area of ConceptDraw Solution Park.
The vector stencils library "Telecom" contains 20 telecommunication icons. Use it to design your IT and telecom illustrations and infographics with ConceptDraw PRO diagramming and vector drawing software.
"Telecommunication is the transmission of signs, signals, writings, images and sounds or intelligence of any nature by wire, radio, optical or other electromagnetic systems, as defined by the International Telecommunication Union (ITU).
Telecommunication occurs when the exchange of information between communication participants includes the use of technology. It is transmitted either electrically over physical media, such as cables, or via electromagnetic radiation. Such transmission paths are often divided into communication channels which afford the advantages of multiplexing. ...
Modern technologies for long-distance communication usually involve electrical and electromagnetic technologies, such as telegraph, telephone, and teleprinter, networks, radio, microwave transmission, fiber optics, and communications satellites." [Telecommunication. Wikipedia]
The telecommunication icon set example "Design elements - Telecom" is included in the Computers and Communications solution from the Illustration area of ConceptDraw Solution Park.
The vector stencils library "Cybersecurity" contains 24 cybersecurity icons.
Use it to design your computer and telecom illustrations and infographics with ConceptDraw PRO diagramming and vector drawing software.
The vector stencils library "Cybersecurity" is included in the Computers and Communications solution from the Illustration area of ConceptDraw Solution Park.
Use it to design your computer and telecom illustrations and infographics with ConceptDraw PRO diagramming and vector drawing software.
The vector stencils library "Cybersecurity" is included in the Computers and Communications solution from the Illustration area of ConceptDraw Solution Park.
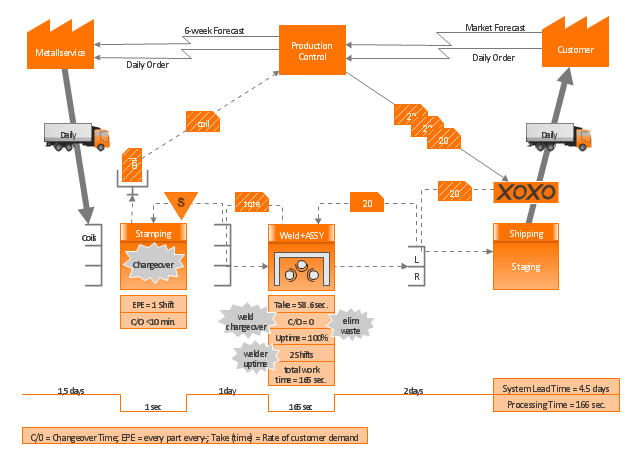
"Value Stream Map (VSM)
1. A tool used to improve a process by identifying added value and eliminating waste.
2. A process map that follows the value creation process.
A. “strap yourself to the product (or service) and see where you go”
3. A process map with data added.
A. Times: processing, wait, cycle.
B. Quality: number of rejects.
C. Inventory.
D. Resources.
1) Number of people.
2) Space.
3) Distance traveled.
E. Whatever else is useful for analyzing the process." [ocw.mit.edu/ courses/ aeronautics-and-astronautics/ 16-660j-introduction-to-lean-six-sigma-methods-january-iap-2012/ lecture-notes/ MIT16_ 660JIAP12_ 1-6.pdf]
This sample VSM flowchart shows the value stream in a manufacturing, production control and shipping processes.
This value stream mapping diagram example was created using the ConceptDraw PRO diagramming and vector drawing software extended with the Value Stream Mapping solution from the Quality area of ConceptDraw Solution Park.
 Electrical Engineering
This solution extends ConceptDraw PRO v.9.5 (or later) with electrical engineering samples, electrical schematic symbols, electrical diagram symbols, templates and libraries of design elements, to help you design electrical schematics, digital and analog
 Aerospace and Transport
This solution extends ConceptDraw PRO software with templates, samples and library of vector clipart for drawing the Aerospace and Transport Illustrations. It contains clipart of aerospace objects and transportation vehicles, office buildings and anci
 Network Layout Floor Plans
Network Layout Floor Plans solution extends ConceptDraw PRO software functionality with powerful tools for quick and efficient documentation the network equipment and displaying its location on the professionally designed Network Layout Floor Plans. Never before creation of Network Layout Floor Plans, Network Communication Plans, Network Topologies Plans and Network Topology Maps was not so easy, convenient and fast as with predesigned templates, samples, examples and comprehensive set of vector design elements included to the Network Layout Floor Plans solution. All listed types of plans will be a good support for the future correct cabling and installation of network equipment.
- Headend ( Signal Processing )
- Line graph template - The number of tourists visiting the resort town ...
- Design elements - Cable TV (CATV) | Regional cable head-end ...
- Line Graphs | Line Graph Charting Software | Line graph template ...
- Workflow diagram - Weather forecast | How can you illustrate the ...
- Aircraft - Vector stencils library
- Fire safety equipment - Vector stencils library
- Cisco Optical. Cisco icons, shapes, stencils and symbols | Cisco ...
- Cisco Optical. Cisco icons, shapes, stencils and symbols | Cisco ...
- Cisco Optical. Cisco icons, shapes, stencils and symbols | Cisco ...
- Design elements - Cable TV (CATV) | Cable TV - Vector stencils ...
- Regional cable head-end diagram | Cable TV - Vector stencils ...
- Cable TV - Vector stencils library | Telecommunication networks ...
- Design elements - Power sources | Amplifier - Circuit diagram ...
- How To use House Electrical Plan Software | Design elements ...
- Design elements - Cable TV (CATV)
- Cable TV - Vector stencils library | Design elements - Valves ...
- How To use House Electrical Plan Software | Electrical and Telecom ...
- Line Chart Templates
- Cable TV - Vector stencils library


-cable-tv---vector-stencils-library.png--diagram-flowchart-example.png)


-cable-tv---vector-stencils-library.png--diagram-flowchart-example.png)


-cable-tv---vector-stencils-library.png--diagram-flowchart-example.png)


