 Soccer
The Soccer (Football) Solution extends ConceptDraw PRO v9.5 (or later) software with samples, templates, and libraries of vector objects for drawing soccer (football) diagrams, plays schemas, and illustrations. It can be used to make professional looking
HelpDesk
How to Make Soccer Position Diagram Using ConceptDraw PRO
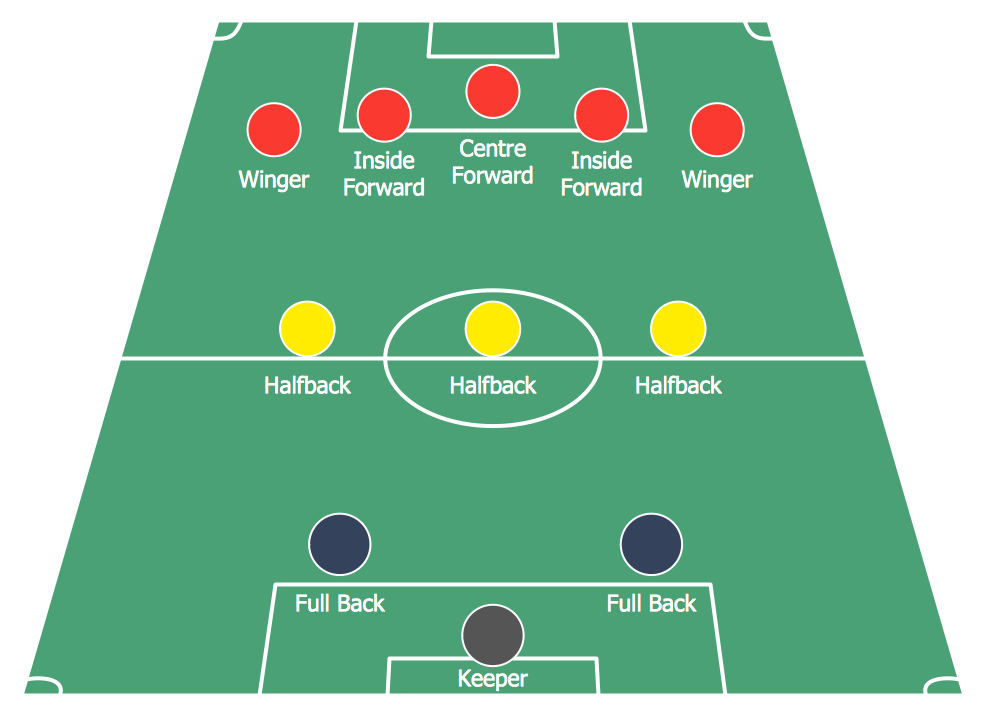
The soccer field has the form of a large rectangle, covered with grass. Dimensions of soccer fields may vary slightly, depending on the level of the game, but all fields have some common characteristics. Soccer players may take different positions. Each soccer position has its own name, and implies certain player functions. Every soccer position has a very specific name and task: Goalkeeper, Defenders, Midfielders and Forwards. During preparation for the game coach met a challenge: how to explain each player's position and his role in the game. The difficulty is the fact that in the course of the game players will often move on the field and do not stay in one place. Football field diagram with dimensions and marking, and positions - it is an important tool for the coach. ConceptDraw PRO helps both coach and players to understand exactly their roles during the particular game. The ability to create Soccer diagrams is contained in the ConceptDraw Soccer solution. The solution providesSoccer (Football) Formation
Using diagrams is the easiest way to explain the soccer formations. The Soccer solution from the Sport area of ConceptDraw Solution Park is designed as a tool that helps you produce the soccer diagrams in a few minutes. The predesigned samples of the Soccer solution for ConceptDraw PRO depict the most popular formation diagrams.
 ConceptDraw Solution Park
ConceptDraw Solution Park collects graphic extensions, examples and learning materials
Basketball Court Dimensions
Basketball is team play with a ball a special court. The goal is to throw a ball into one of the baskets, which are mounted to a backboard at a certain height on the edges of the court.
 Business Process Diagrams
The Business Process Diagram Solution extends ConceptDraw PRO v10 BPMN software with its RapidDraw interface, templates, samples, and libraries based on the BPMN 1.2 and BPMN 2.0 standards. This powerful solution permits you to visualize easily both simple and complex processes, as well as design business models. The Business Process Diagram solution allows one to quickly develop and document in detail any business processes at any stage of a project’s planning and implementation.
HelpDesk
Software for Flowchart Diagrams
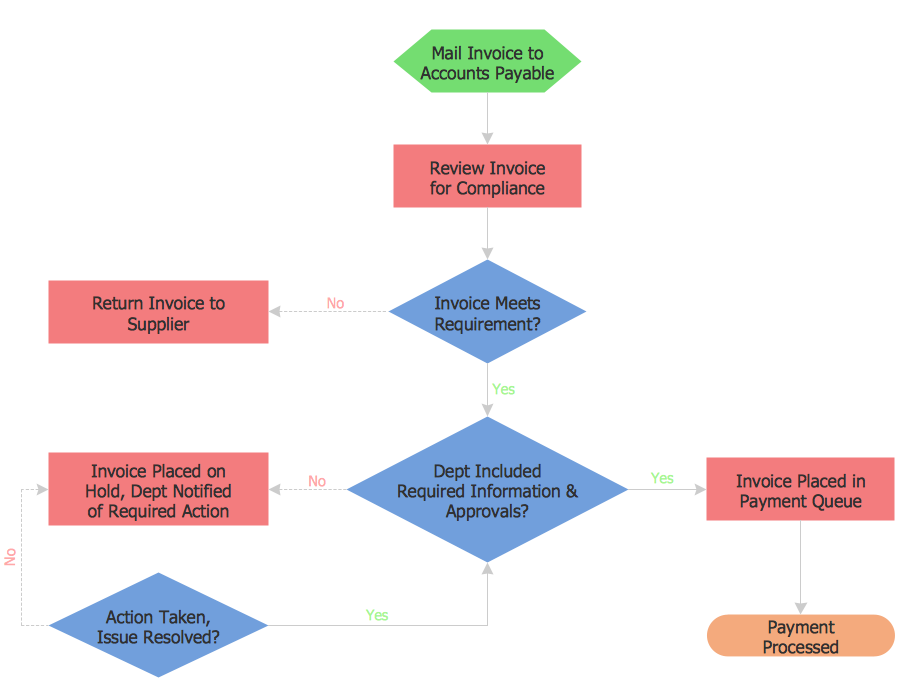
There are many types of flowcharts among them are work flow diagram, data flow diagram, business flow diagram and other very complex flowcharts. Thus to draw flowchart it is better to use computer program – a software for flowchart diagrams creation. The best flowchart software - is ConceptDraw PRO. With the help of ConceptDraw visual solutions, you can quickly and effortlessly portray even the most complex business process flow. ConceptDraw Flowchart solutions deliver a special set of vector stencils that contains all standard symbols of flowchart notation, and a large number of special symbols intended for business-oriented flowcharts.HelpDesk
How to Change Measurement Units in ConceptDraw Drawing
There are different units of measurement that can be used for length dimensions. When making scaled drawing we can't keep in mind just meters, centimeters, and milimeters ; we also need remember about yards, feets and inches . This is because the United States applies its own system of measurement units, while the rest of the world employs metric measurement units. ConceptDraw PRO enables choosing the most suitable units of measurement with just one click.HelpDesk
How to Create a SIPOC Diagram Using ConceptDraw PRO
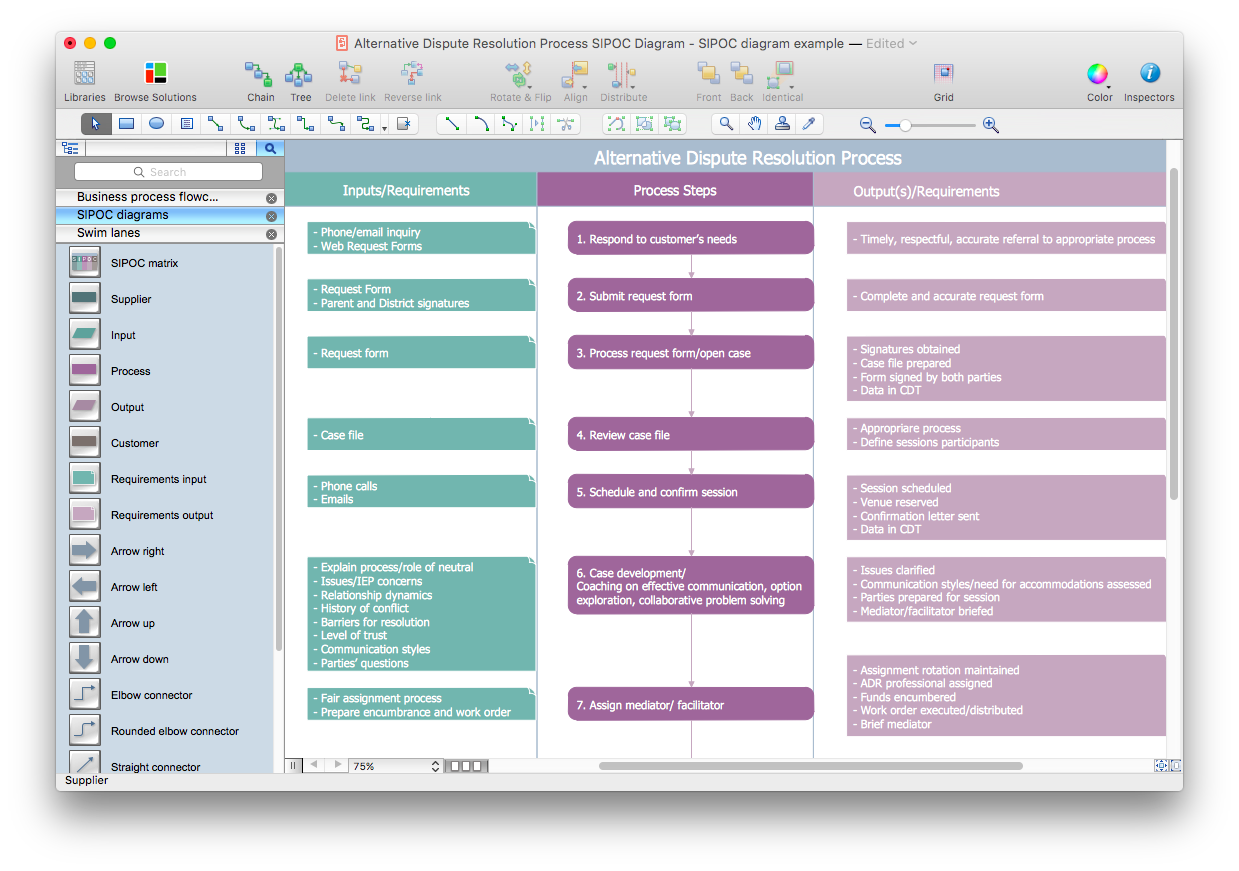
SIPOC (suppliers, inputs, process, outputs, customers) diagram is focused on the quality of a business process inputs and outputs. SIPOC diagram has a form of a segmented table that gives comprehensive outline for each category. SIPOC diagram depicts the start and end of a process, and the relationships between a company and its suppliers. SIPOC diagram is an important part of the Six Sigma methodology. With its Business Process Mapping solution, ConceptDraw PRO offers a power set of process mapping tools to empower quality management within an organization.HelpDesk
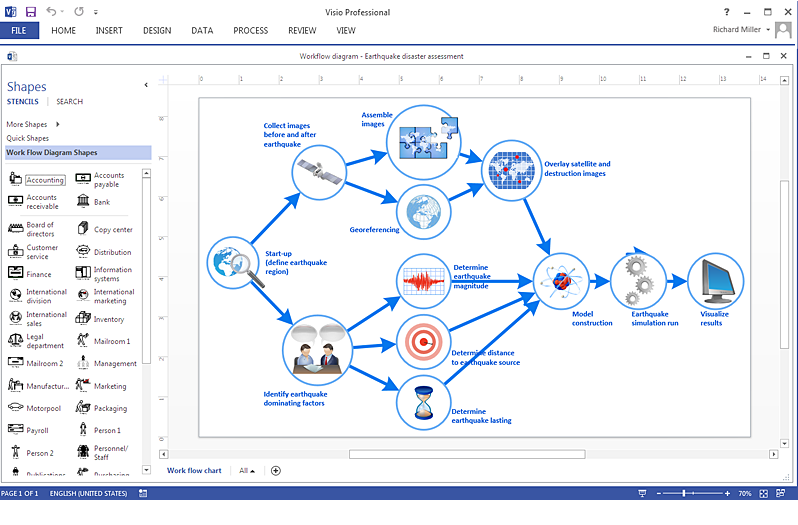
How To Create a MS Visio Workflow Diagram Using ConceptDraw PRO
A workflow diagram shows a working process as a set of related events that follow each other in a particular order.They are usually created as flowcharts, with shapes that represent steps in the process connected by arrows that indicate the next step. Making a business process diagram involves many elements that can be managed using ConceptDraw PRO. The ability to design workflow diagrams is delivered by the Workflow Diagrams solution. ConceptDraw PRO allows you to easily create workflow diagrams and then make a MS Visio file from your diagrams. Using ConceptDraw PRO, you can export your workflow diagrams to MS Visio VSDX and VDX files.HelpDesk
How to Create a Fishbone (Ishikawa) Diagram Quickly
A Fishbone (Ishikawa) diagram is also called cause-and-effect diagram. Fishbone diagram is often used in business to determine the cause of some problem. The diagram illustrates the main causes and sub-causes leading to an event. The main goal of the Fishbone diagram is to illustrate in a graphical way the relationship between a given outcome and all the factors that influence this outcome. The complete diagram resembles a fish skeleton as its name implies. The ability to create a Fishbone Diagram is supported by the Fishbone Diagram solution. Use ConceptDraw MINDMAP for structuring data and then ConceptDraw PRO for generating a Fishbone Diagram from mind map structure.HelpDesk
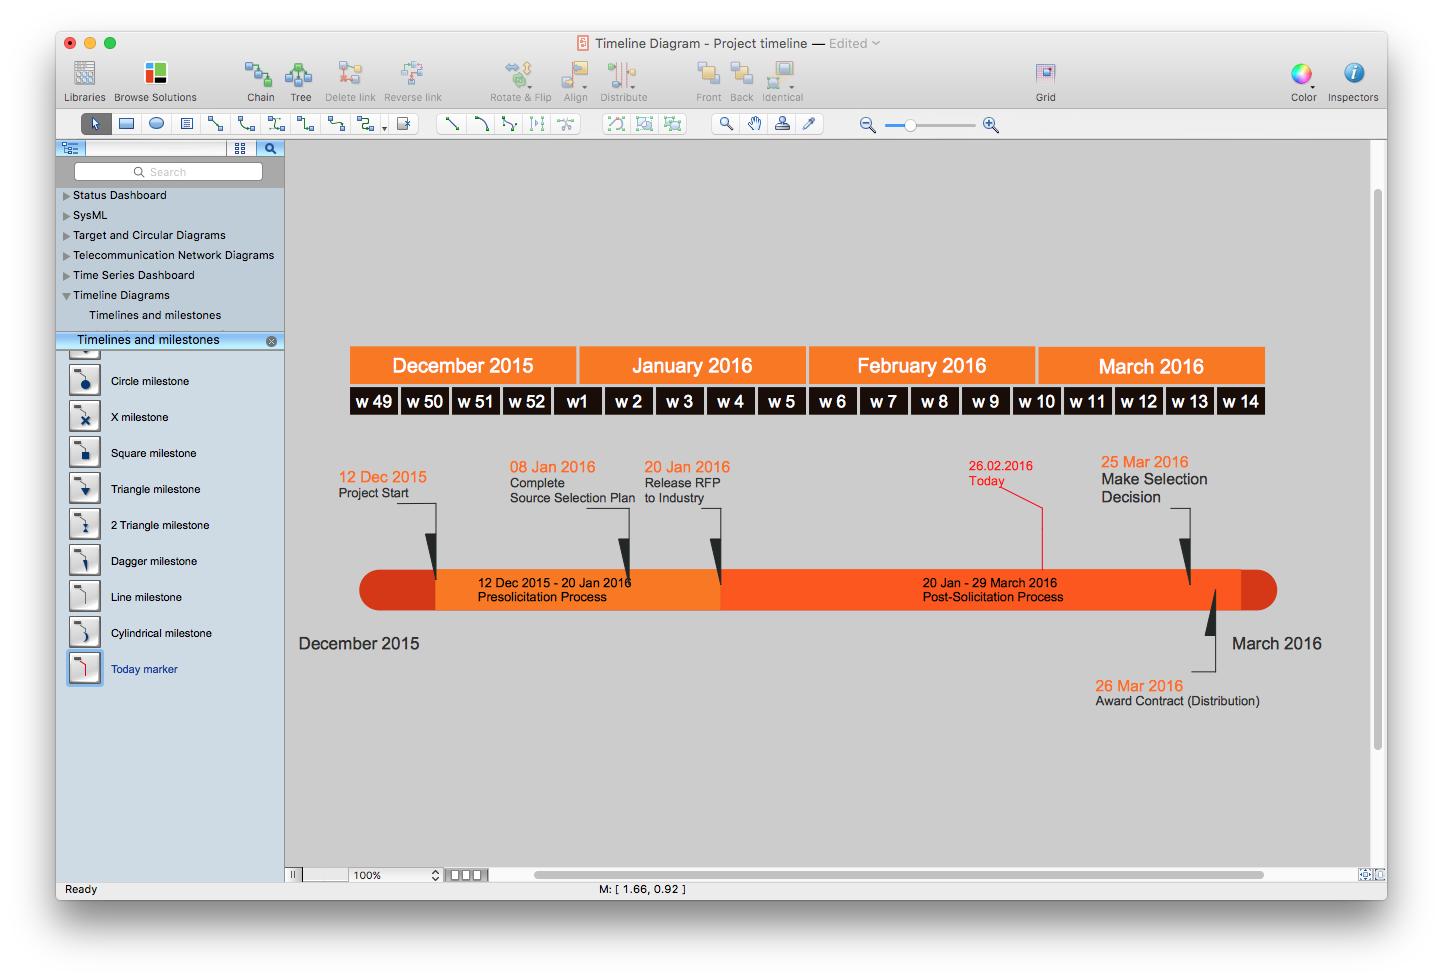
How to Create a Timeline Diagram in ConceptDraw PRO
A Timeline is a chart which displays a project plan schedule in chronological order. A Timeline is used in project management to depict project milestones and visualize project phases, and show project progress. The graphic form of a timeline makes it easy to understand critical project milestones, such as the progress of a project schedule. Timelines are particularly useful for project scheduling or project management when accompanied with a Gantt chart. It captures the main of what the project will accomplish and how it will be done. making a project timeline is one of the most important skills a project manager needs have. Making comprehensive, accurate timelines allows you getting every project off in the best way. ConceptDraw PRO allows you to draw a timeline charts using special library.HelpDesk
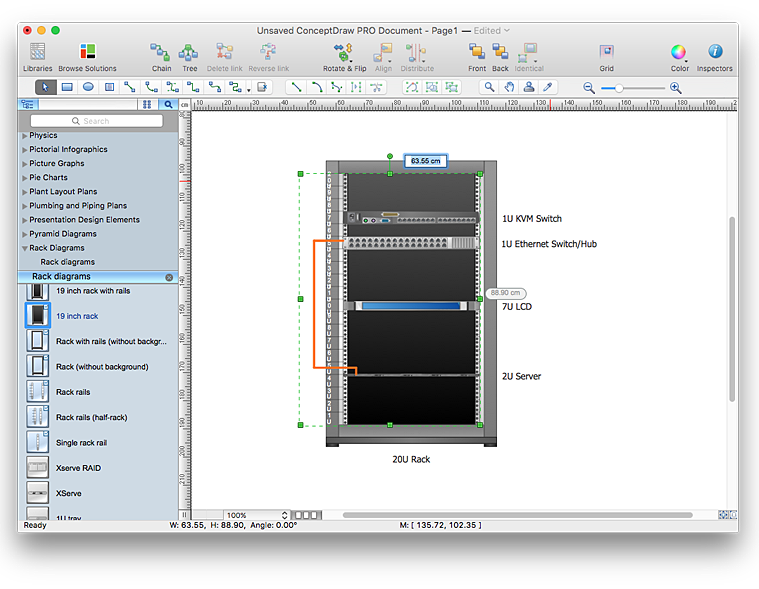
How to Resize Objects in ConceptDraw PRO
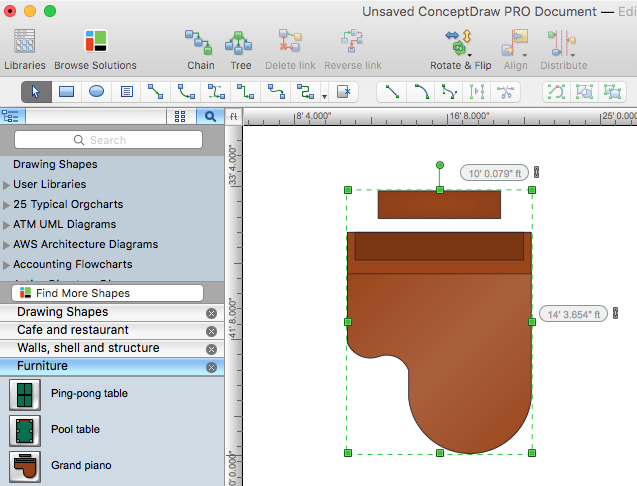
When creating diagram using ConceptDraw PRO, you can select, move, resize and rotate objects. After selecting an object (or objects) in a document, you can change it position, resize it or move an object to the desired position. The sizes of objects in ConceptDraw PRO can be changed by simple dragging, or you can set a particular size of any object. Using ConceptDraw PRO, you can re-size an object on the page using the absolute measurements instead of a mouse. You can make quick work of designing complex drawing using a combination of different-sized items.HelpDesk
How to Create the Custom Diagram Template on Mac
ConceptDraw PRO enables you to place your own templates. You can create diagram with ConceptDraw PRO using your custom Template. You can set up your Template as a default ConceptDraw PRO start page. A template diagram is a drawing that serves as a starting point for a new graphic document. When you open a template, it is pre-formatted in some way. For example, you might use template that is formatted as an organizational chart. The template would likely have a workspace and a corresponding object libraries. When you save a file created with a template, you are usually prompted to save a copy of the file, so that you don't save over the template. Templates can either come with a proper solution or can be created by the user. If you find yourself creating similar documents over and over again, it might be a good idea to save one of them as a template. Then you won't have to format your documents each time you want to make a new one. Just open the template and start from there.- Diagram Of A Standard Football Pitch
- Soccer (Football) Formation | Soccer | The Diagram Of A Standard ...
- Shotgun Formation (Offense) Diagram | Soccer (Football) Formation ...
- Soccer (Football) Formation | Soccer (Football) Positions | Soccer ...
- Soccer (Football) Diagram Software | Soccer (Football) Formation ...
- Diagram Of A Standard Football Field
- Diagram Of Standard Football Pitch
- Soccer (Football) Positions | Soccer (Football) Field Templates ...
- Soccer (Football) Field Templates | Football fields - Vector stencils ...
- Drawn Standard Soccer Pitch Dimensions
- Soccer | PM Response | Aerospace and Transport | Uml Activity ...
- IDEF0 standard with ConceptDraw PRO | PM Response | Soccer ...
- Ice Hockey Rink Dimensions | Ice Hockey Offside Diagram | Soccer ...
- Ice Hockey Rink Dimensions | Soccer (Football) Formation | Ice ...
- Vertical association football pitch - Template | Soccer (Football ...
- Vertical association football pitch - Template | Soccer (Football ...
- Plan Of A Standard Football Field
- Association football ( soccer ) field dimensions | Soccer (Football ...
- Soccer (Football) Formation | Basketball Court Diagram and ...
- Sport Field Plans | Football pitch metric | Soccer (Football ...

