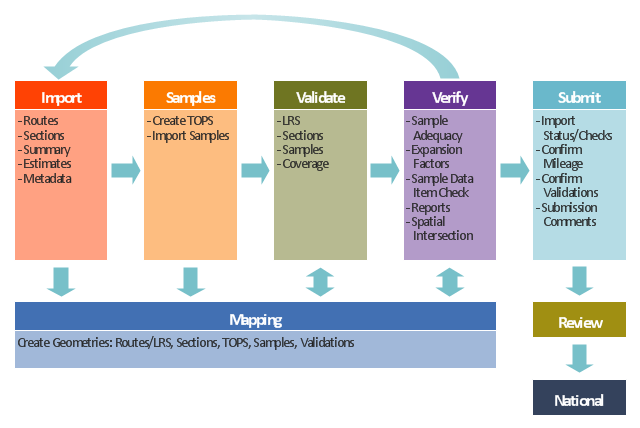
This TQM diagram example was redesigned from the illustration of the Highway Performance Monitoring System (HPMS) Field Manual from the website of the Federal Highway Administration (FHWA).
[fhwa.dot.gov/ policyinformation/ hpms/ fieldmanual/ chapter7.cfm]
"Highway Performance Monitoring System (HPMS).
The HPMS is a national level highway information system that includes data on the extent, condition, performance, use and operating characteristics of the nation's highways. The HPMS contains administrative and extent of system information on all public roads, while information on other characteristics is represented in HPMS as a mix of universe and sample data for arterial and collector functional systems. Limited information on travel and paved miles is included in summary form for the lowest functional systems.
HPMS was developed in 1978 as a continuing database, replacing the special biennial condition studies that had been conducted since 1965. The HPMS has been modified several times since its inception. Changes have been made to reflect changes in the highway systems, legislation, and national priorities, to reflect new technology, and to consolidate or streamline reporting requirements." [fhwa.dot.gov/ policyinformation/ hpms.cfm]
The TQM flowchart example "Software workflow diagram" was created using the ConceptDraw PRO diagramming and vector drawing software extended with the Total Quality Management (TQM) Diagrams solution from the Quality area of ConceptDraw Solution Park.
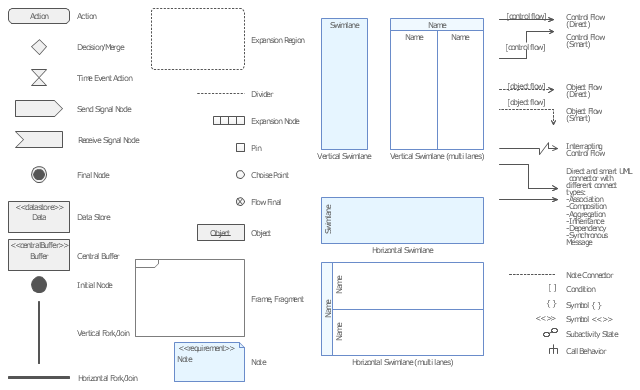
The vector stencils library "UML activity diagrams" contains 37 symbols for the ConceptDraw PRO diagramming and vector drawing software.
"Activity diagrams are constructed from a limited number of shapes, connected with arrows. The most important shape types:
(1) rounded rectangles represent actions;
(2) diamonds represent decisions;
(3) bars represent the start (split) or end (join) of concurrent activities;
(4) a black circle represents the start (initial state) of the workflow;
(5) an encircled black circle represents the end (final state).
Arrows run from the start towards the end and represent the order in which activities happen.
Hence they can be regarded as a form of flowchart. Typical flowchart techniques lack constructs for expressing concurrency. However, the join and split symbols in activity diagrams only resolve this for simple cases; the meaning of the model is not clear when they are arbitrarily combined with decisions or loops." [Activity diagram. Wikipedia]
The example "Design elements - UML activity diagrams" is included in the Rapid UML solution from the Software Development area of ConceptDraw Solution Park.
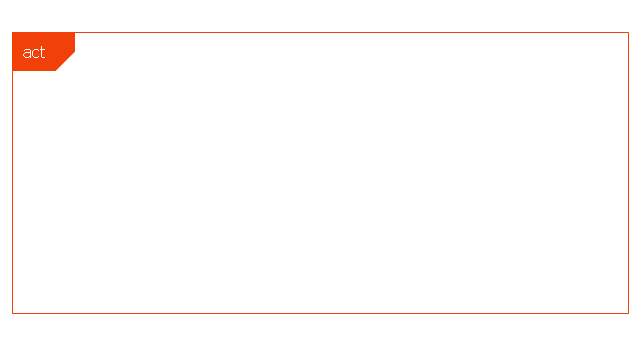
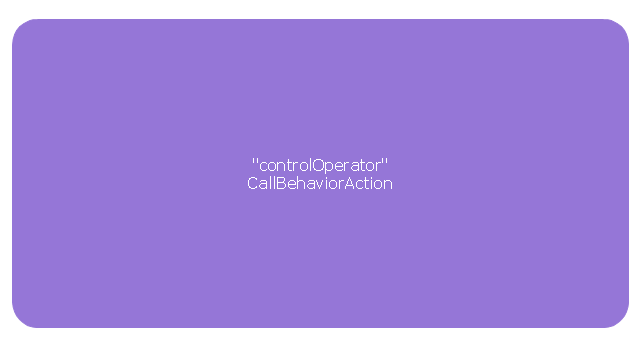
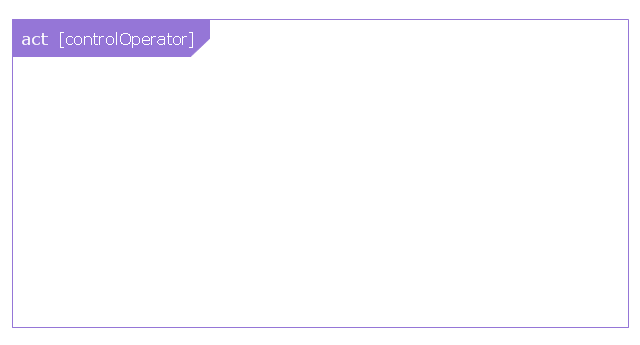
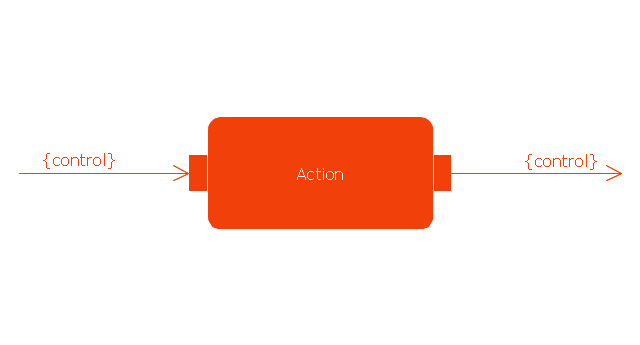
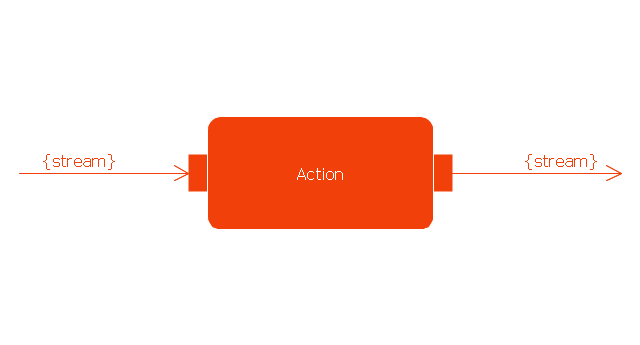
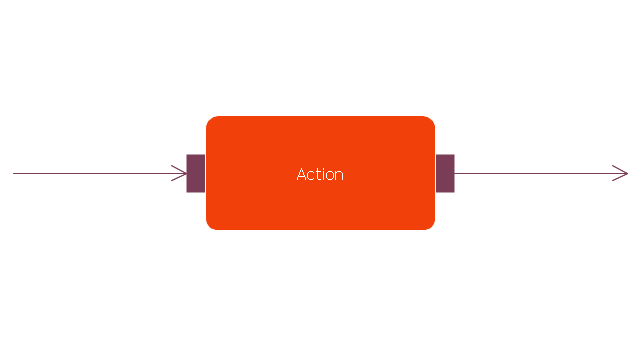
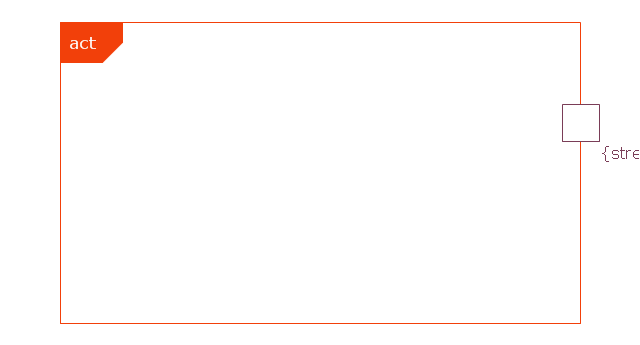
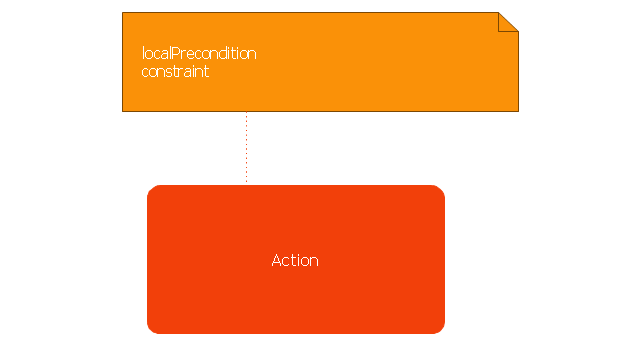
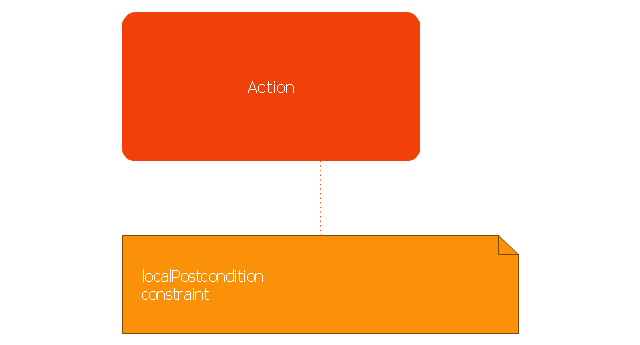
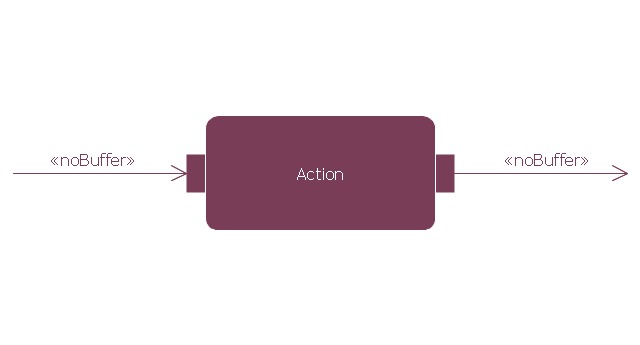
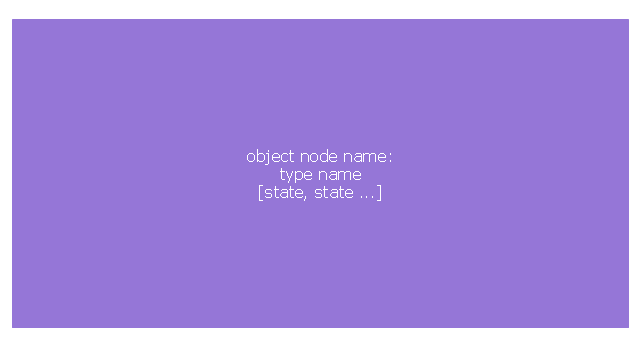
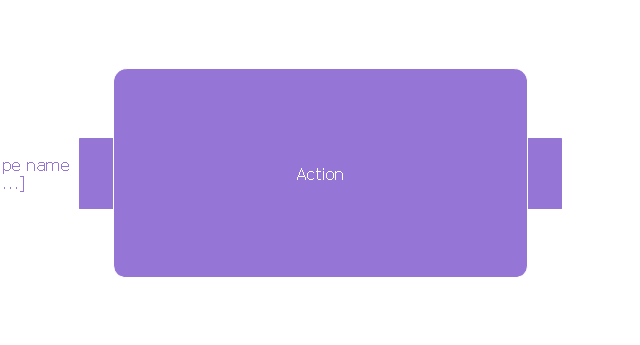
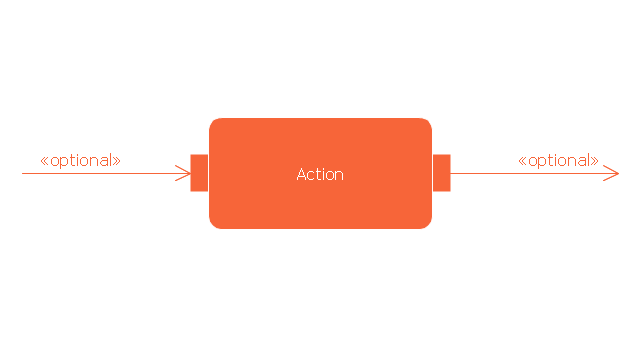
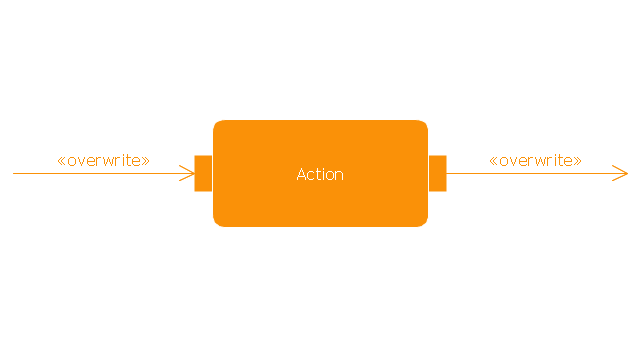
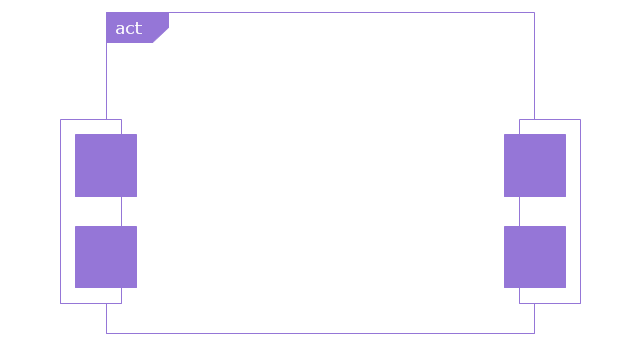
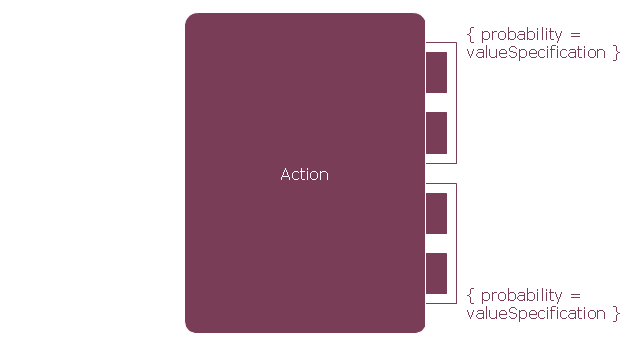
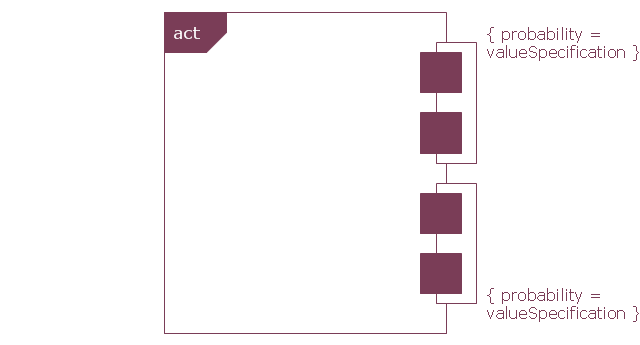
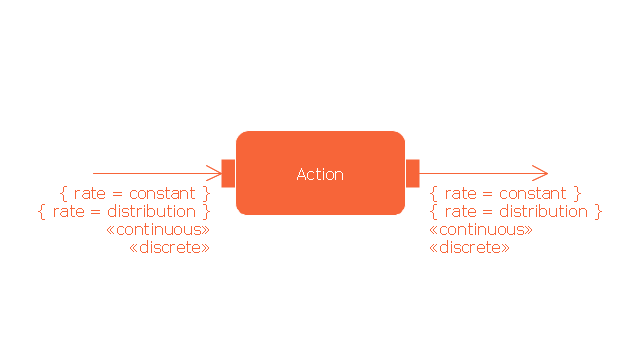
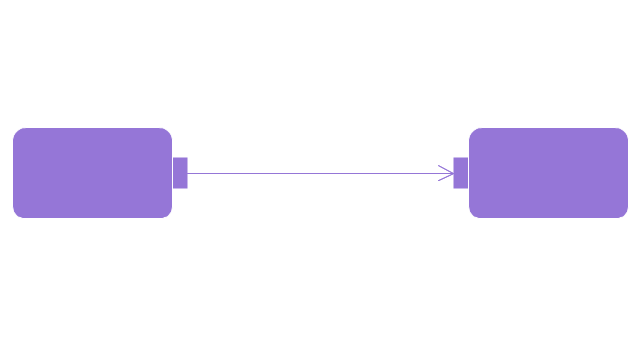
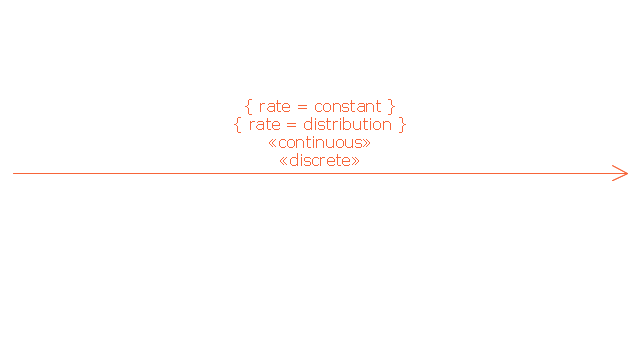
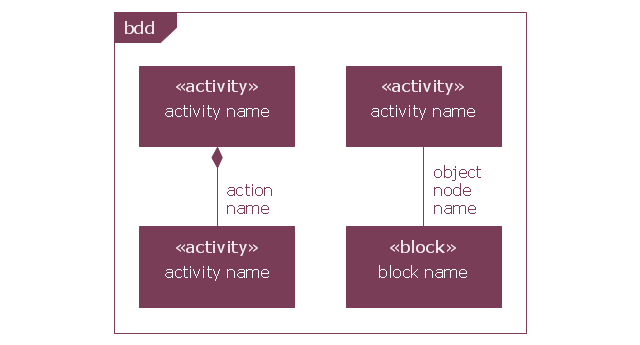
This vector stencils library contains 47 SysML activity diagram symbols.
Use it to design your SysML activity diagrams using ConceptDraw PRO diagramming and vector drawing software.
"Activity diagrams are constructed from a limited number of shapes, connected with arrows. The most important shape types:
- rounded rectangles represent actions;
- diamonds represent decisions;
- bars represent the start (split) or end (join) of concurrent activities;
- a black circle represents the start (initial state) of the workflow;
- an encircled black circle represents the end (final state).
Arrows run from the start towards the end and represent the order in which activities happen." [Activity diagram. Wikipedia]
The vector stencils library "Activity diagram" is included in the SysML solution from the Software Development area of ConceptDraw Solution Park.
LLNL Flow Charts
These flow charts help scientists analysts and other decision makers to visualize the complex interrelationships involved in managing our nation x2019.
 Business Productivity Area
Business Productivity Solutions extend ConceptDraw products with tools for making presentations, conducting meetings, preparing documents, brainstorming, or building new strategies.
- UML Activity Diagram | Diagramming Software for Design UML ...
- Diagramming Software for Design UML Activity Diagrams | UML ...
- Cross-Functional Flowchart (Swim Lanes) | Diagramming Software ...
- Diagram Of Activity Design
- Diagramming Software for Design Business Process Diagrams ...
- Diagramming Software for Design UML Activity Diagrams | UML ...
- TQM Diagram Example | TQM diagram example | Software workflow ...
- CCTV Network Diagram Software
- Network Diagram Software Home Area Network
- Swim Lane Diagrams | Cross-Functional Flowchart (Swim Lanes ...
- CCTV Surveillance System Diagram . CCTV Network Diagram ...
- Diagramming Software for Design Business Process Diagrams ...
- Diagram Creator | Software Diagram & UML Diagram Tool | Cubetto ...
- Network Diagram Software Home Area Network | Network Diagram ...
- Business process diagram BPMN 1.2 - Hiring process | Business ...
- Software and Database Design with ConceptDraw PRO | Examples ...
- Network Diagramming Software for Design Cisco Network Diagrams ...
- Local Area Network Diagram
- ConceptDraw PRO Network Diagram Tool | How To use House ...
- Design elements - Swimlanes BPMN1.2 | Business Process ...








.jpg)