Business diagrams & Org Charts with ConceptDraw DIAGRAM
The business diagrams are in great demand, they describe the business processes, business tasks and activities which are executed to achieve specific organizational and business goals, increase productivity, reduce costs and errors. They let research and better understand the business processes. ConceptDraw DIAGRAM is a powerful professional cross-platform business graphics and business flowcharting tool which contains hundreds of built-in collections of task-specific vector stencils and templates. They will help you to visualize and structure information, create various Business flowcharts, maps and diagrams with minimal efforts, and add them to your documents and presentations to make them successful. Among them are Data flow diagrams, Organization charts, Business process workflow diagrams, Audit flowcharts, Cause and Effect diagrams, IDEF business process diagrams, Cross-functional flowcharts, PERT charts, Timeline diagrams, Calendars, Marketing diagrams, Pyramids, Target diagrams, Venn diagrams, Comparison charts, Analysis charts, Dashboards, and many more. Being a cross-platform application, ConceptDraw DIAGRAM is very secure, handy, free of bloatware and one of the best alternatives to Visio for Mac users.
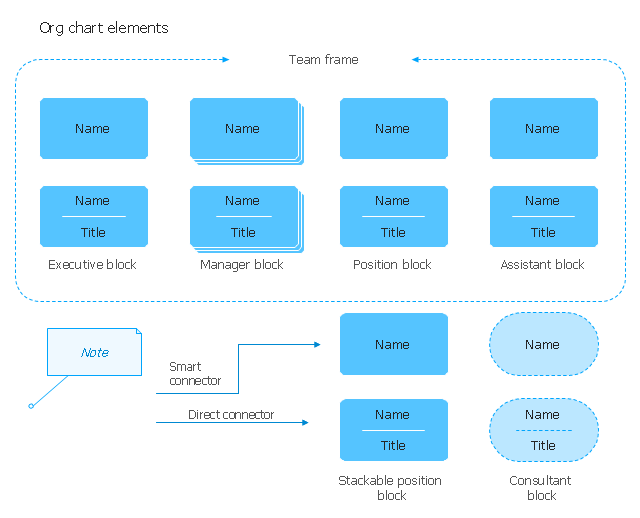
The vector stencils library "Organizational chart" contains 17 symbols for drawing organizational charts using the ConceptDraw PRO diagramming and vector drawing software.
"An organizational chart (often called organization chart, org chart, organigram(me), or organogram(me)) is a diagram that shows the structure of an organization and the relationships and relative ranks of its parts and positions/ jobs. The term is also used for similar diagrams, for example ones showing the different elements of a field of knowledge or a group of languages." [Organizational chart. Wikipedia]
The example "Design elements - Organizational chart" is included in the Organizational Charts solution from the Management area of ConceptDraw Solution Park.
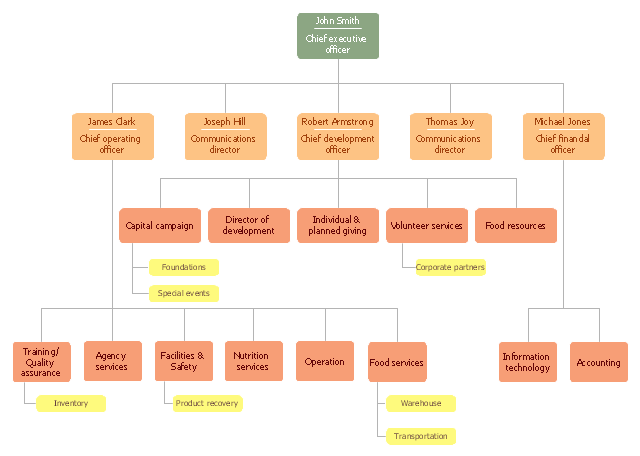
"A food bank or foodbank is a non-profit, charitable organization that distributes food to those who have difficulty purchasing enough food to avoid hunger.
In the United States and Australia, food banks usually operate on the "warehouse" model. They act as food storage and distribution depots for smaller front line agencies; and usually do not themselves give out food directly to the hungry. After the food is collected, sorted, and reviewed for quality, these food banks distribute it to non-profit community or government agencies, including food pantries, food closets, soup kitchens, homeless shelters, orphanages, and schools.
Outside North America and Australia, the "front line" model is often found. Such food banks give out most or all of their food directly to the end users. For both models, the largest sources of food include for-profit growers, manufacturers, distributors and retailers who in the normal course of business have excess food that they cannot sell. Some foodbanks receive a substantial proportion of their food from individual donors, including their volunteer workers. There is considerable overlap with food salvage, food rescue and gleaning, although not with freeganism or dumpster-diving." [Food bank. Wikipedia]
The organization chart example "Foodbank" was created using the ConceptDraw PRO diagramming and vector drawing software extended with the Organizational Charts solution from the Management area of ConceptDraw Solution Park.
Diagram Software - The Best Choice for Diagramming
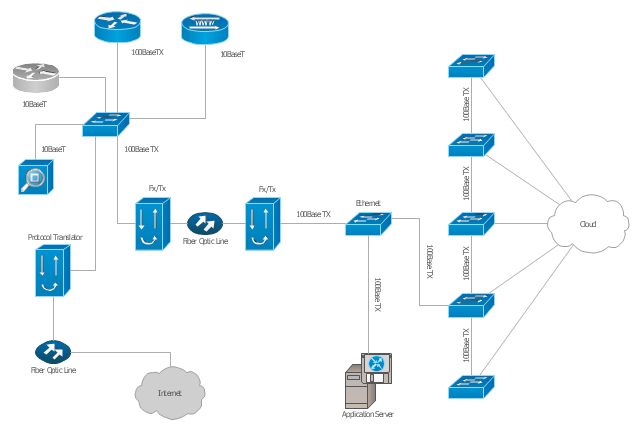
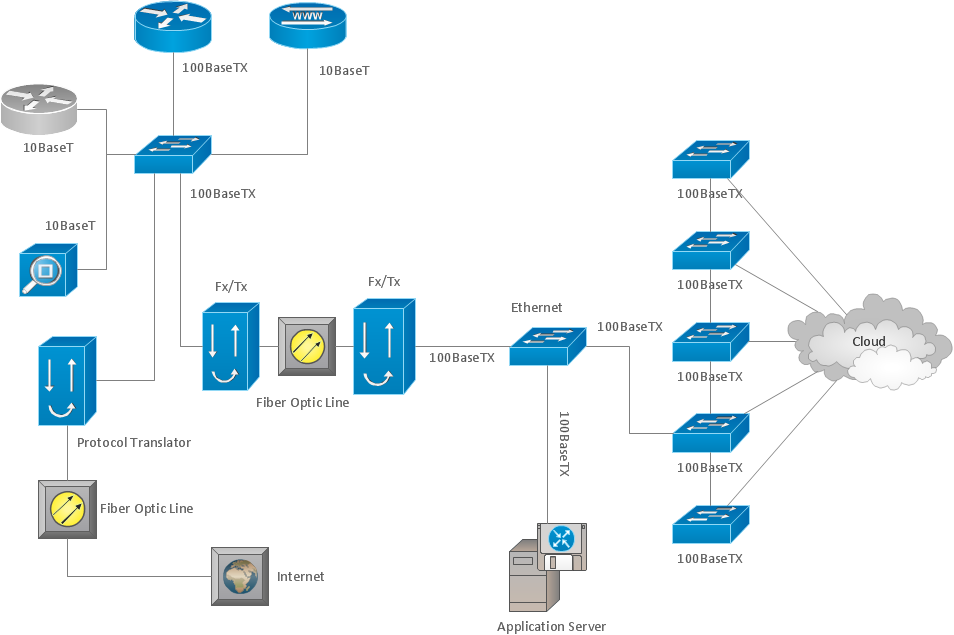
For vector shapes and connector tools for quick and easy drawing diagrams for business, technology, science and education - The best choice for Diagramming is ConceptDraw DIAGRAM."A computer network diagram is a schematic depicting the nodes and connections amongst nodes in a computer network or, more generally, any telecommunications network. ...
Depending on whether the diagram is intended for formal or informal use, certain details may be lacking and must be determined from context. ...
At different scales diagrams may represent various levels of network granularity. At the LAN level, individual nodes may represent individual physical devices, such as hubs or file servers, while at the WAN level, individual nodes may represent entire cities. In addition, when the scope of a diagram crosses the common LAN/ MAN/ WAN boundaries, representative hypothetical devices may be depicted instead of showing all actually existing nodes." [Computer network diagram. Wikipedia]
The Cisco computer network diagram example "Network organization chart" was created using the ConceptDraw PRO diagramming and vector drawing software extended with the Cisco Network Diagrams solution from the Computer and Networks area of ConceptDraw Solution Park.
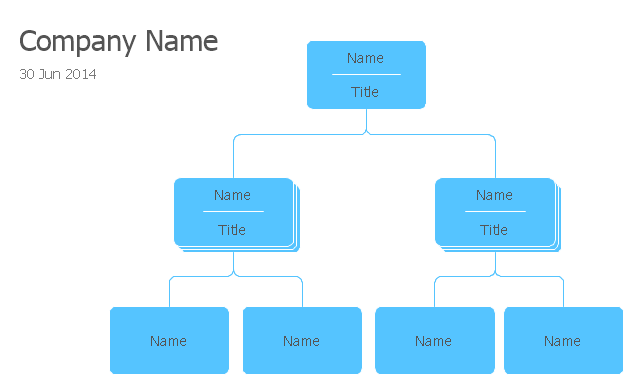
"The organization chart is a diagram showing graphically the relation of one official to another, or others, of a company. It is also used to show the relation of one department to another, or others, or of one function of an organization to another, or others. This chart is valuable in that it enables one to visualize a complete organization, by means of the picture it presents.
A company's organizational chart typically illustrates relations between people within an organization. Such relations might include managers to sub-workers, directors to managing directors, chief executive officer to various departments, and so forth. When an organization chart grows too large it can be split into smaller charts for separate departments within the organization." [Organizational chart. Wikipedia]
This organizational chart template for the ConceptDraw PRO diagramming and vector drawing software is included in the Organizational Charts solution from the Management area of ConceptDraw Solution Park.
Business and Software Diagrams
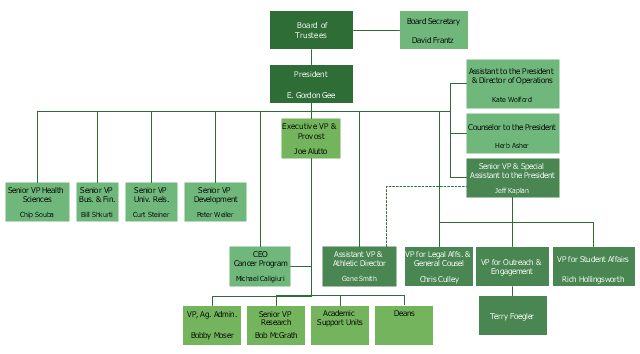
ConceptDraw DIAGRAM Software is a cross-platform flowcharting tool with extended HTML capabilities. It contains more than 10 000 pre-created objects and many templates, available for PC and Macintosh. Creating great designs and diagrams involves having the right drawing software. ConceptDraw is the business diagram software of choice for business professionals who need to quickly and easily visualize, explore, and communicate information.This example is based on the organizational chart from the Ohio State University website. [osu.edu/ vpsearch/ images/ University_ Org_ Chart.png]
"The Ohio State University, a multi-campus land grant institution with an international presence, is a world-class public research university and the leading comprehensive teaching and research institution in the state, Ohio's flagship university. Ohio State provides a distinctive educational experience for students and pursues cutting-edge interdisciplinary research that brings together scholars from diverse disciplines to solve key problems in society.
One of the University's core values is to "ignite a lifelong love of learning" in students. Ohio State students benefit from a scholarly environment in which research inspires and informs teaching.
The Vice President for Student Life provides vision, leadership, and strategic direction to the Office of Student Life, a comprehensive unit dedicated to supporting the educational mission of the University and promoting the best possible overall experience for the diverse student body of approximately 60,000. The Office of Student Life supports every aspect of Ohio State students experience. Its scope includes housing, campus dining, disability services, the multicultural center, counseling and health services, student organizations and leadership development, and other related operations." [osu.edu/ vpsearch/ ]
The organizational chart example "University leadership" was created using the ConceptDraw PRO diagramming and vector drawing software extended with the Organizational Charts solution from the Management area of ConceptDraw Solution Park.
- Organizational chart software
- Org chart - University | ConceptDraw PRO - Organizational chart ...
- Business Diagram Software | Org chart - University | Business ...
- ConceptDraw PRO - Organizational chart software | Organizational ...
- ConceptDraw PRO - Organizational chart software | Organizational ...
- Organizational Structure | Business Processes | ConceptDraw PRO ...
- Organizational chart software
- ConceptDraw PRO - Organizational chart software | Business ...
- Business diagrams & Org Charts with ConceptDraw PRO | Flowchart ...
- How to Draw an Organization Chart | Business Diagram Software ...
- How to Draw an Organization Chart | The Best Drawing Program for ...
- Business diagrams & Org Charts with ... - Conceptdraw.com
- How to Draw an Organization Chart | Organizational Structure ...
- How to Draw an Organization Chart | Pie Chart Examples and ...
- How to Draw an Organization Chart | ConceptDraw PRO ...
- How to Draw an Organization Chart | ConceptDraw PRO ...
- Business diagrams & Org Charts with ConceptDraw PRO
- Business diagrams & Org Charts with ConceptDraw PRO
- Organizational Charts | ConceptDraw PRO - Organizational chart ...
- Organizational Structure Total Quality Management

