Presentations in Educational Process
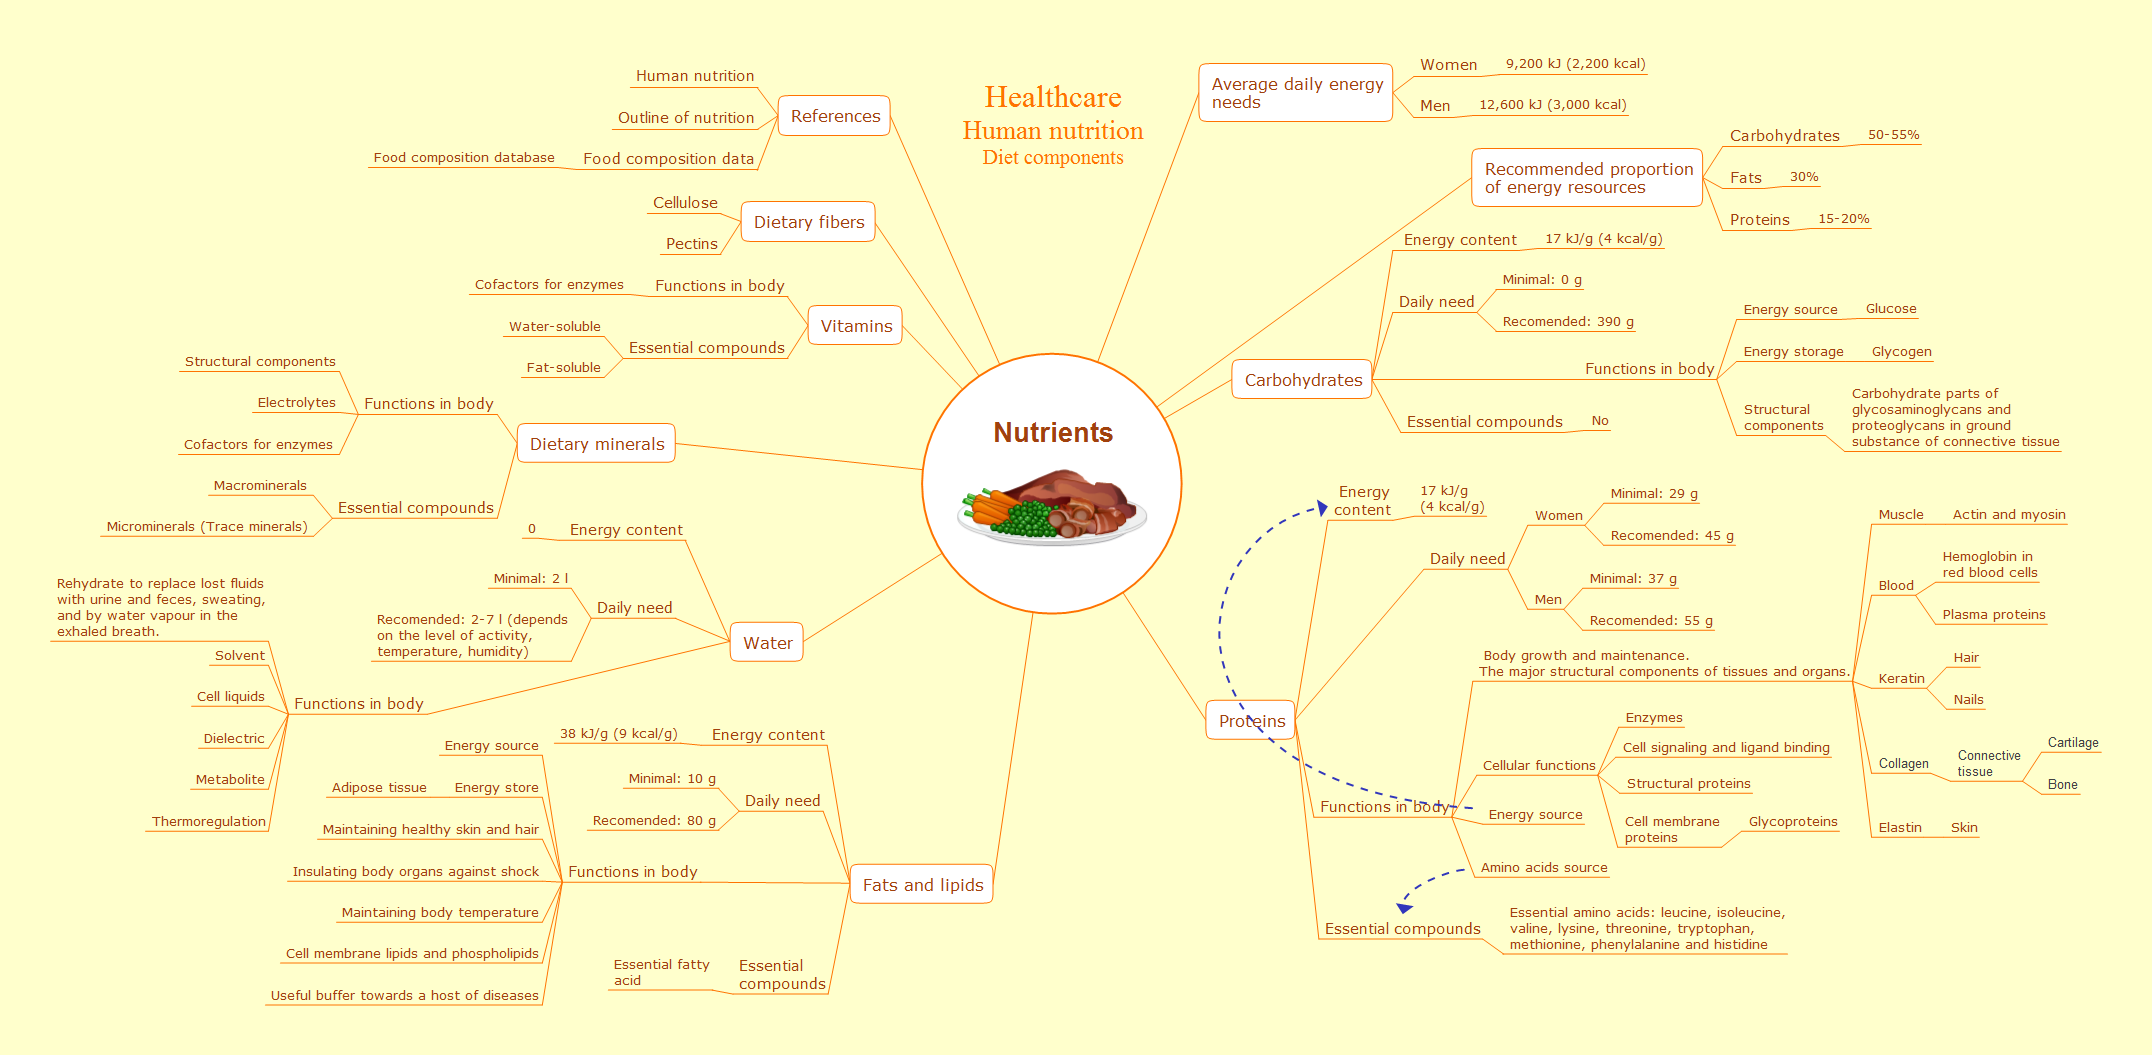
Using mind mapping in education is very popular way to make your lecture materials more structural and clear both for you and for students. At remote learning session your students also can make notes or type questions to the current slides without interrupting slide show.
Basketball Plays Software
Basketball is a popular sport played by two teams of five players with a ball. The game takes place on a rectangular court. The team goal is to score a ball into the basket of the opponent team. The team with the most points wins the game.ConceptDraw PRO diagramming and vector drawing software extended with Basketball solution from the Sport area of ConceptDraw Solution Park is a very useful tool for designing the basketball-related diagrams of any complexity.
Soccer (Football) Diagram Software
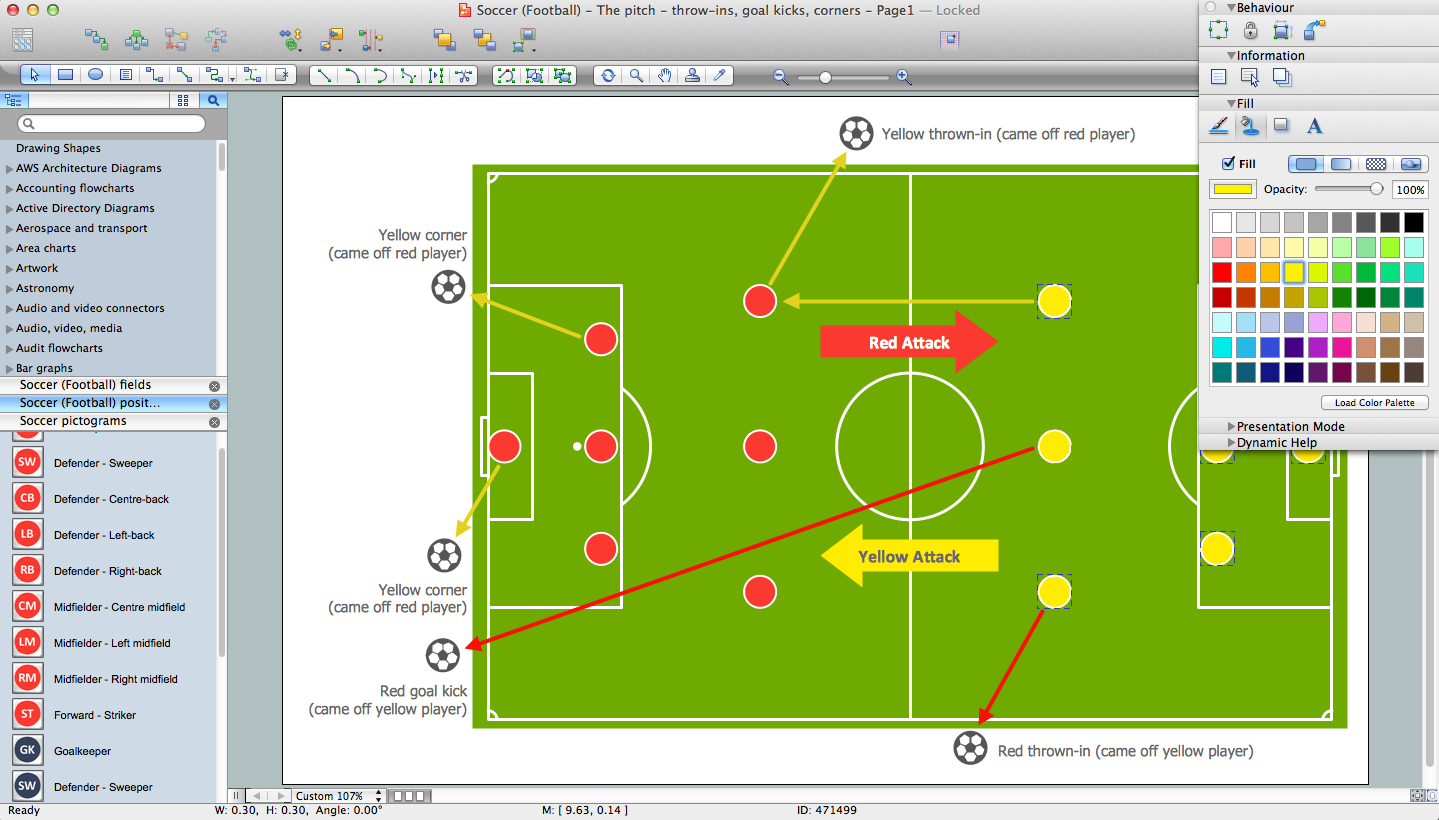
Explaining the soccer strategies and techniques is practically impossible without drawing a diagram. ConceptDraw PRO diagramming and vector drawing software extended with Soccer solution from the Sport area of ConceptDraw Solution Park is a very convenient and useful tool for designing the soccer-related diagrams.Travel Infographics
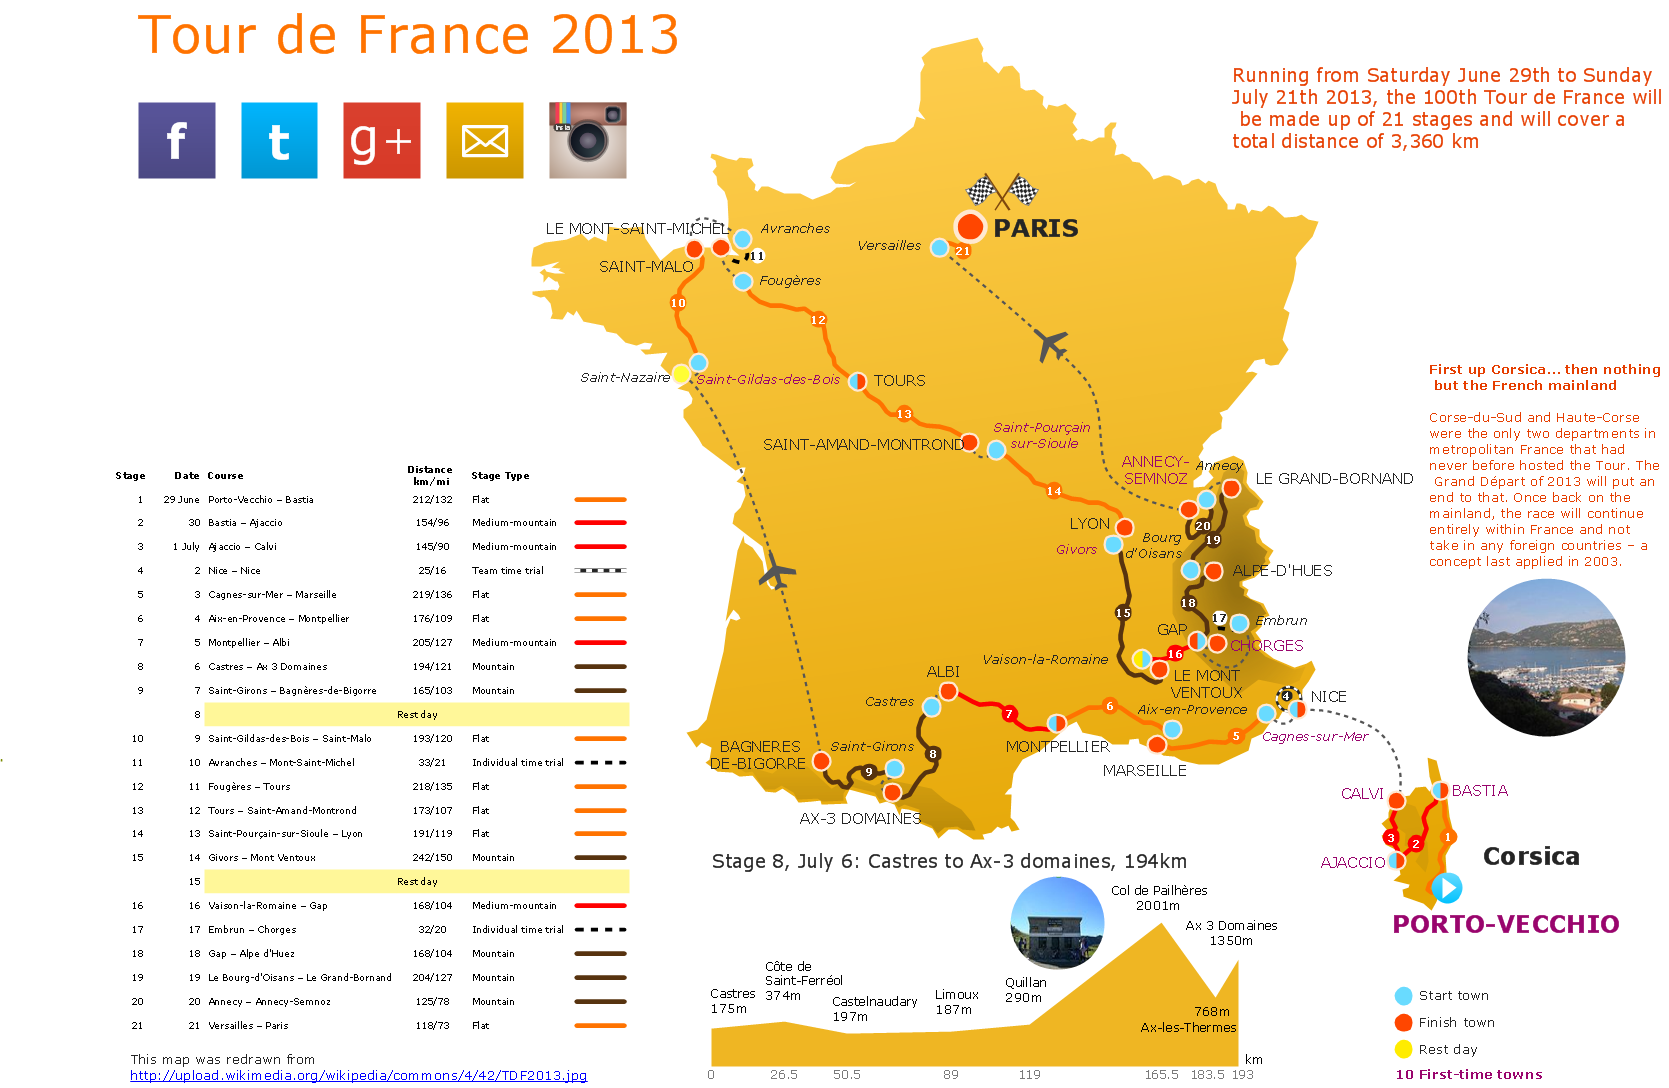
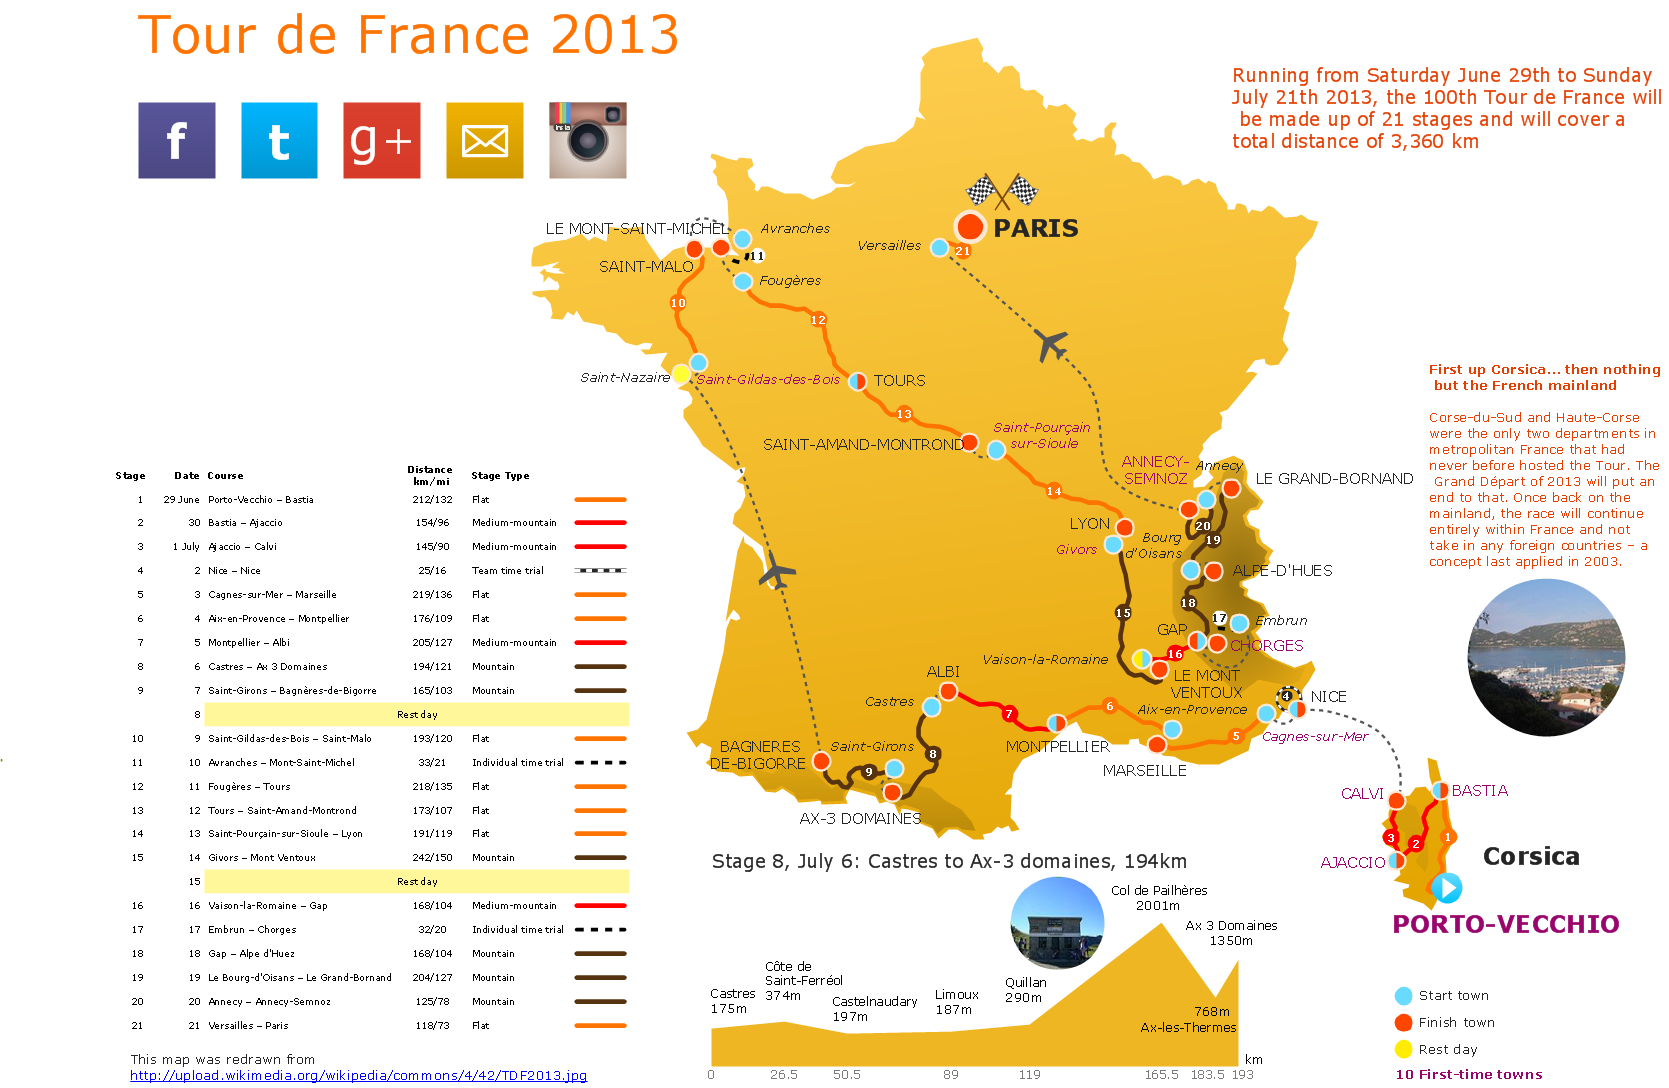
Creating Travel infographics is super-easy with ConceptDraw.Infographic Software
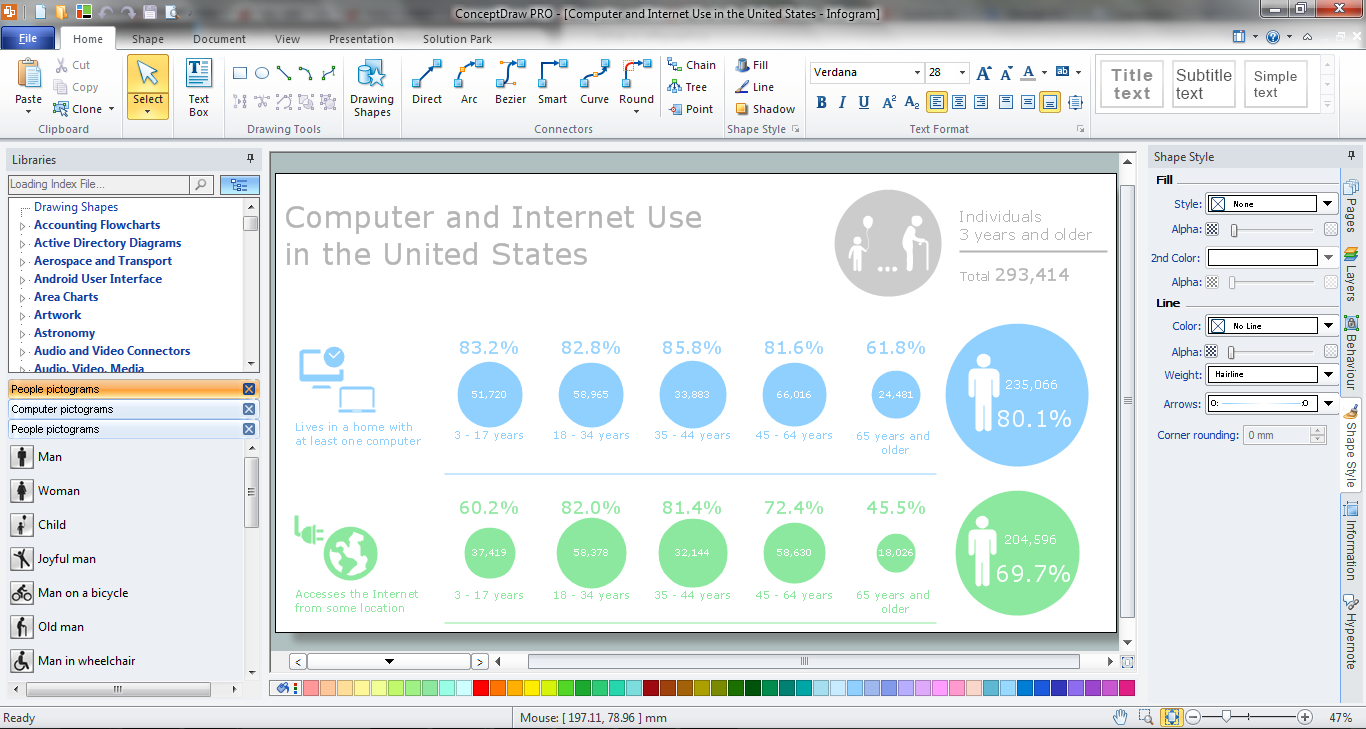
ConceptDraw PRO extended with Pictorial Infographics Solution from the “What are Infographics” Area is a powerful Infographic Software. Make sure in it right now!How to Create a Powerful Infographic When You do not Have a Designer
Create a powerful infographic, become inspired by the people with ConceptDraw.Spatial infographics Design Elements: Location Map
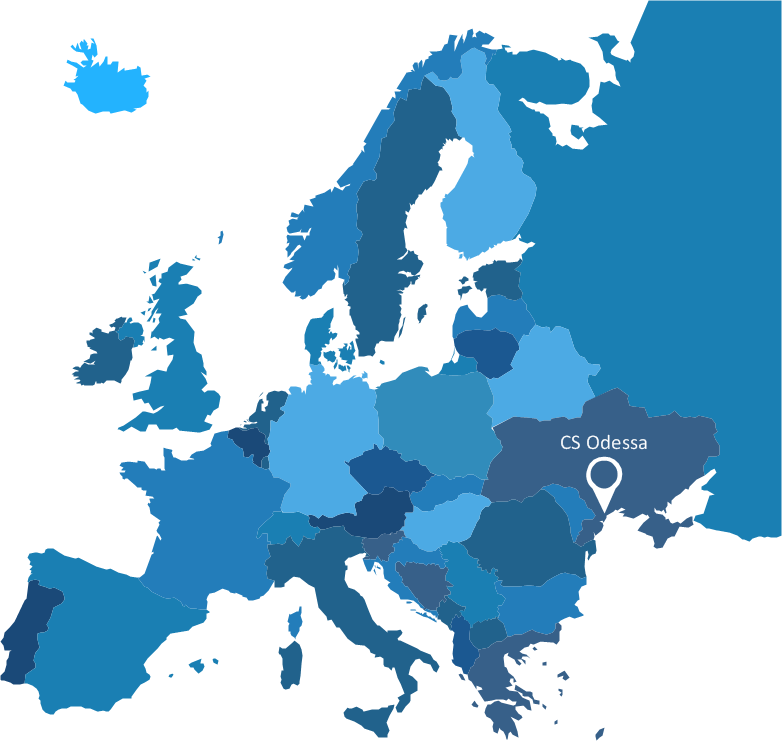
Infographic Design Elements for visually present various geographically distributed information.Typography Infographic Software
ConceptDraw PRO supplied with Typography Infographics Solution from the “What are Infographics” Area is a powerful typography infographic software that provides a set of useful typography infographics tools.Use the Typography Infographics Solution for ConceptDraw PRO typography infographic software to create your own professional looking Typography Infographics of any complexity quick, easy and effective, and then successfully use them in various fields.
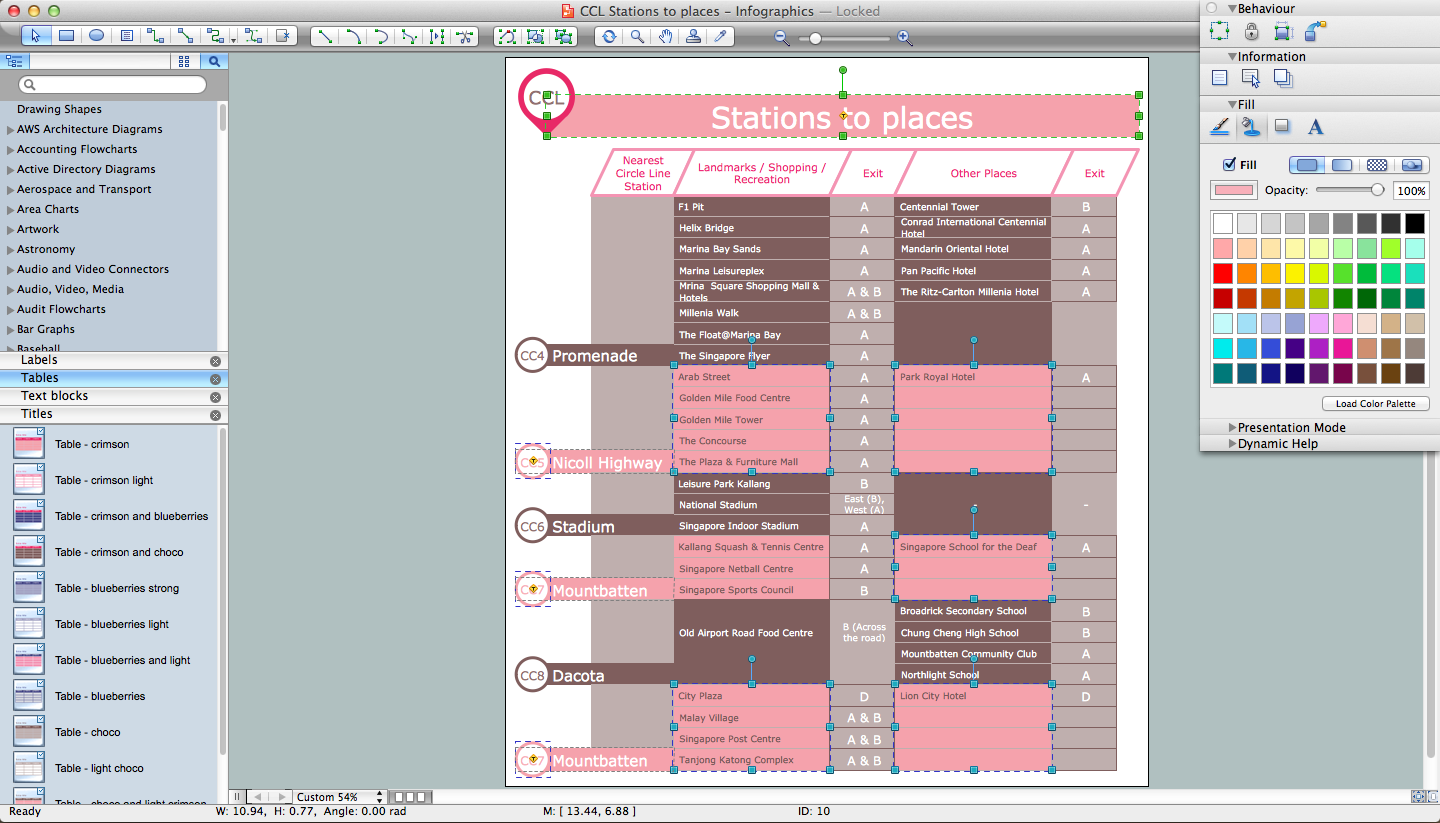
How tо Represent Information Graphically
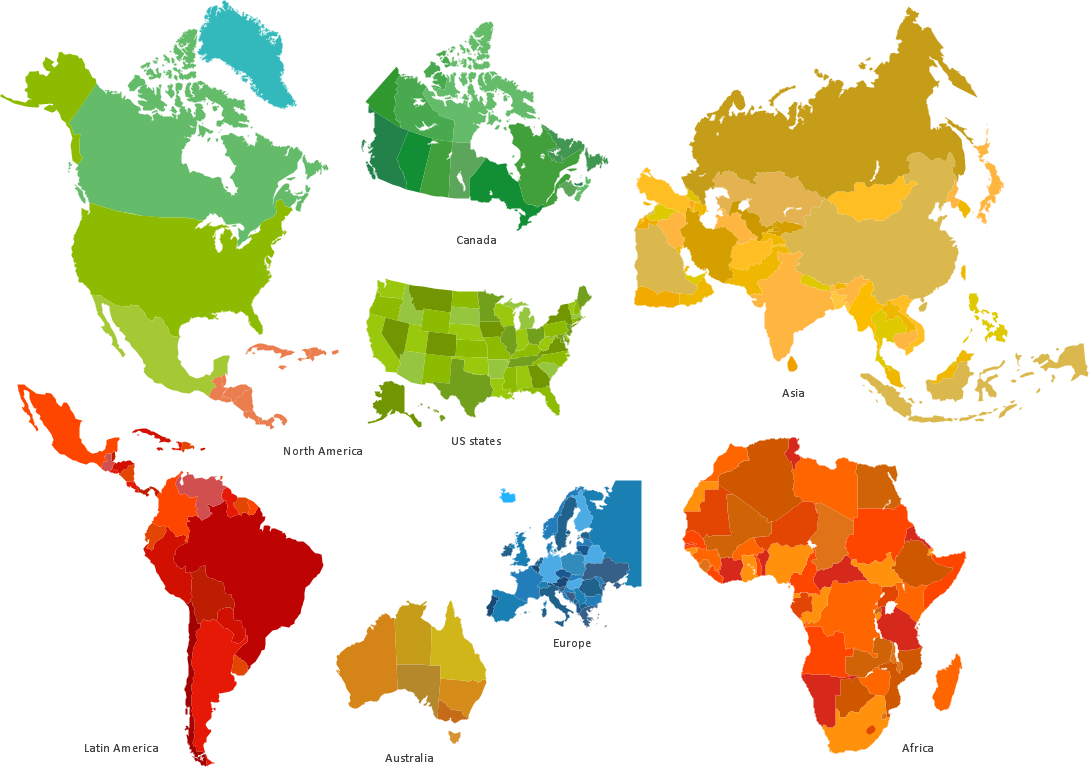
ConceptDraw Infographics is a great visual tool for communicating the large amounts of data and graphic visualization and representations of data and information.Spatial infographics Design Elements: Continental Map
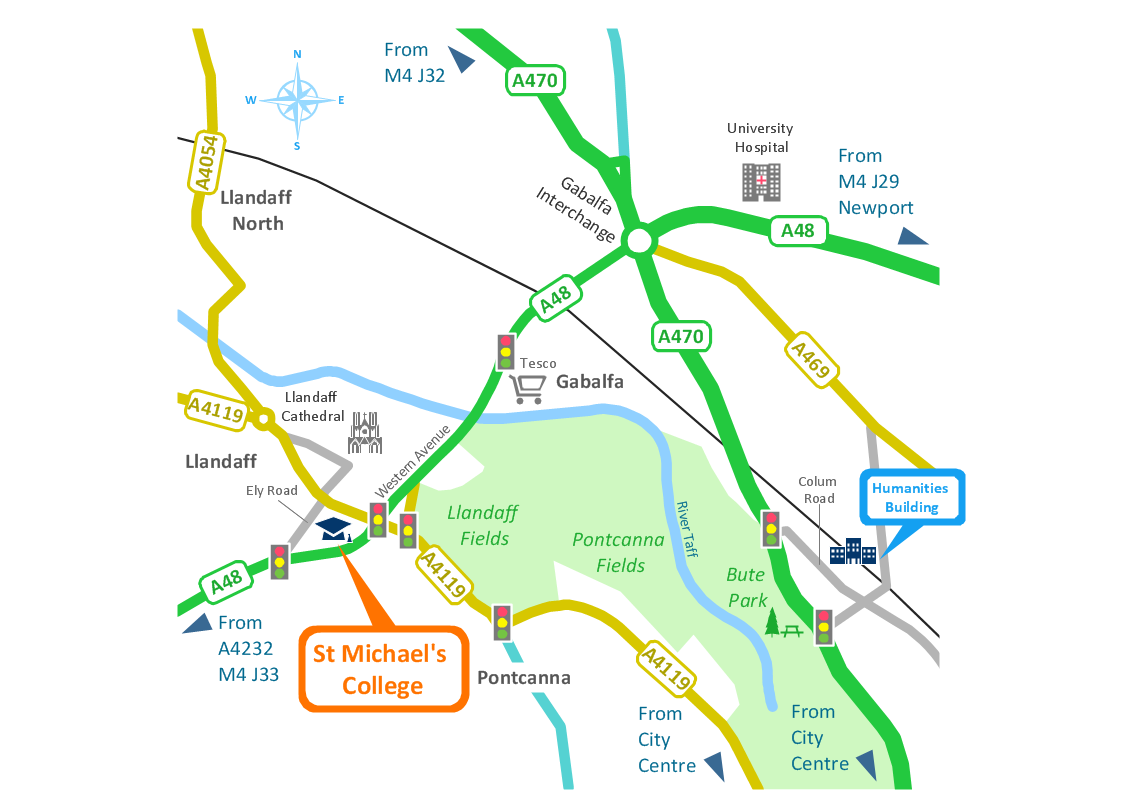
ConceptDraw PRO is a software for making infographics illustrations. You can work with various components to build really impressive and easy-to-understand infographics design.Spatial infographics Design Elements: Transport Map
Do you like infographics and data visualization? Creating infographics is super-easy with ConceptDraw.Infographics and Maps
ConceptDraw is a tool that produces colorful infographics.Transportation Infographics
ConceptDraw is a visualization Software for making transportation infographics. Infographics design vector elements and vector graphics which will surely help you in your design process.Baseball Diagram – Fielding Drill – Hit the Cutoff
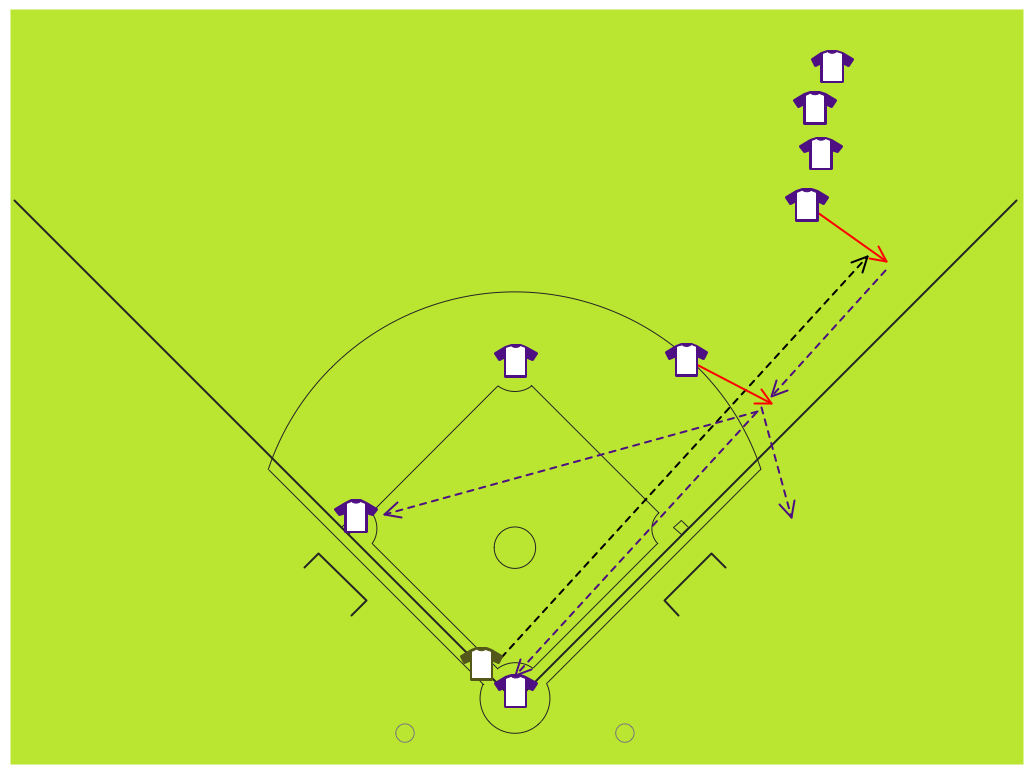
Baseball diagram is the simplest way to explain Baseball details. Plenty rules and terms may startle a newbie. Using visual method to explain the meaning of each term, play or strategy gives a clear understanding. ConceptDraw PRO software extended with the Baseball solution is an amazing tool for producing and presenting baseball diagrams.Tools for Creating Infographics and Visualizations
ConceptDraw lets you express your professional accomplishments in a simple, but compelling personal infographics and visualizations.Winter Sports Vector Clipart. Medal Map. Spatial Infographics
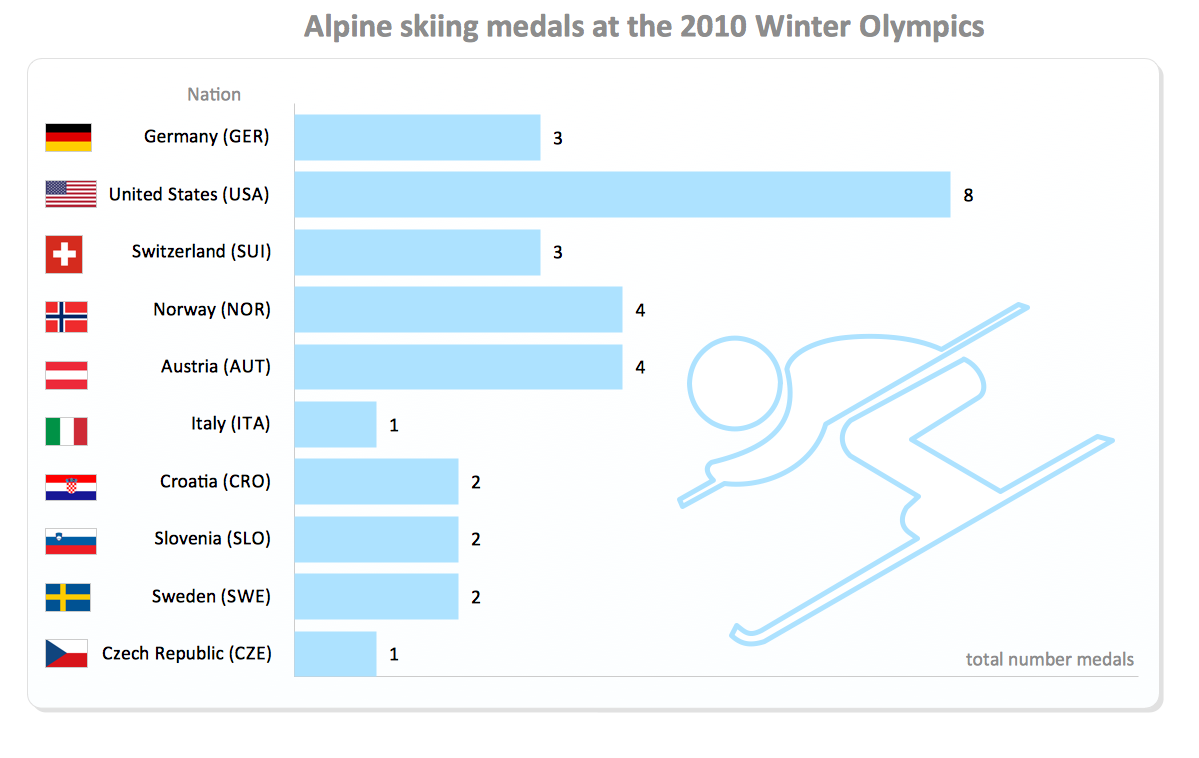
Tracking Olympic results in visual format is the most modern way to deliver statistics to a broad audience. This is a good example of an illustrated table you may easily modify, print, or publish on web from ConceptDraw Winter Sports solution .Winter Sports. Illustrations and Visualize Statistics
Visualizing sports statistics becomes as easy as never before with ConceptDraw PRO software extended with the Winter Sports solution. This solution delivers a complete set of winter sports illustrations, samples and templates you may use to visualize any kind of sports statistics in minutes.Spatial Infographics
Not everyone can make spatial infographics from scratch, ConceptDraw will help you to create your own infographics.Tools to Create Your Own Infographics
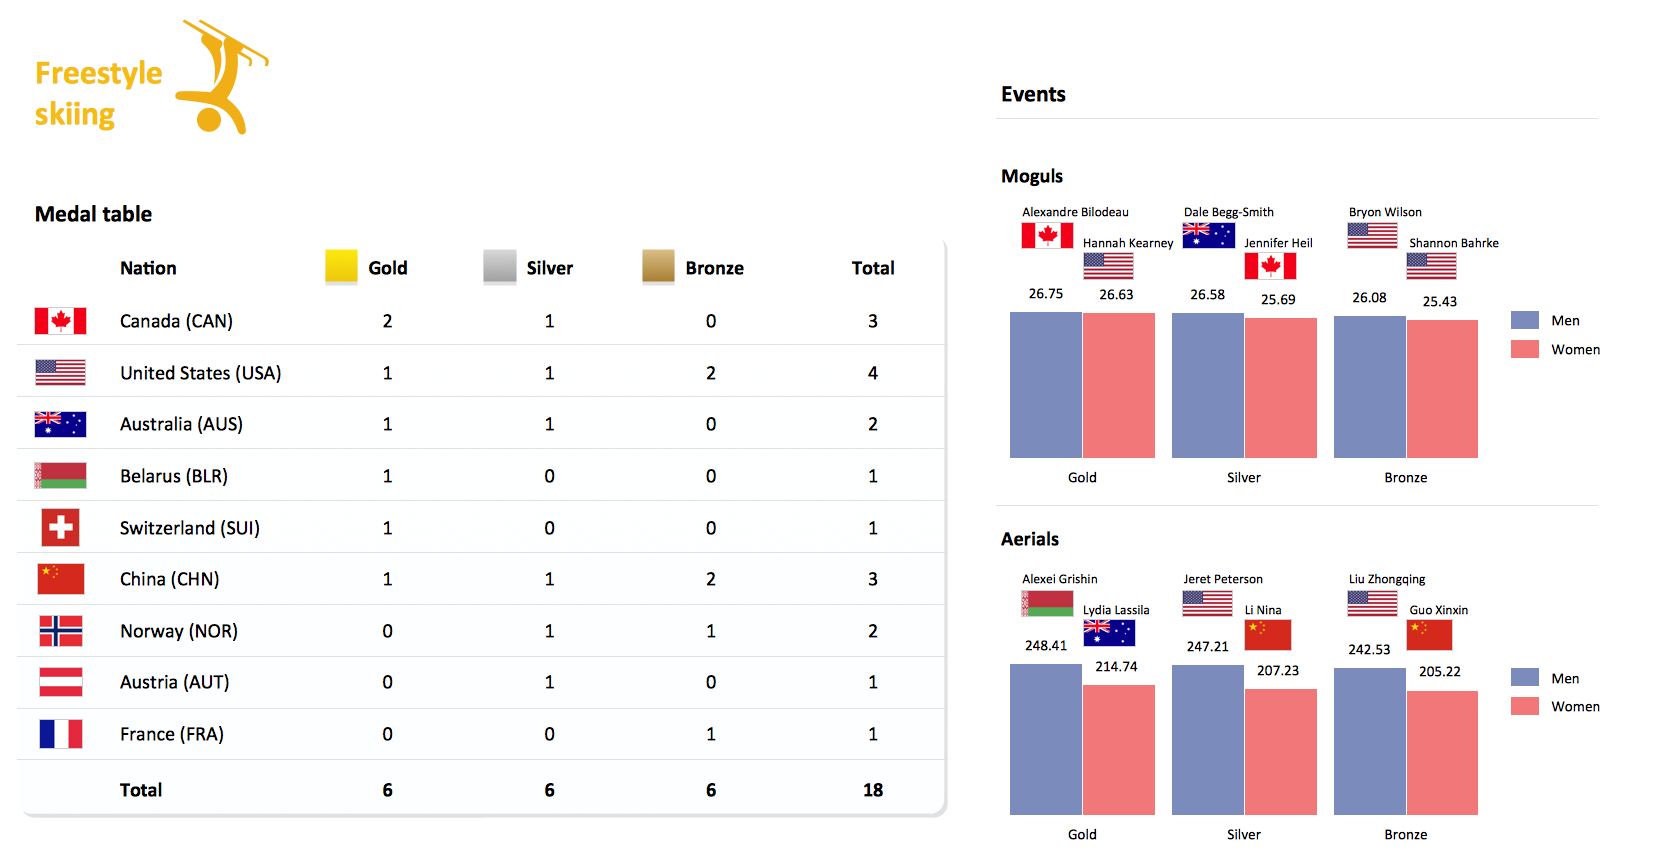
Over the past few centuries, data visualization has evolved so much that we use it every day in all areas of our lives. Many believe that infographic is an effective tool of storytelling, as well as analytics, and that it is able to overcome most of the language and educational barriers. Understanding the mechanisms of human perception will help you to understand how abstract forms and colors used in data visualization can transmit information more efficient than long paragraphs of text.Winter Sports. Olympic Games Illustrations. Medal Summary
Do you like infographics and data visualization? Creating infographics is super-easy with ConceptDraw.- Visual Presentations Made Easy with Diagramming Software
- Education | Entity-Relationship Diagram (ERD) | Development of ...
- Presentations in Educational Process | Education | How To Create ...
- How to show a mind map presentation via Skype | Group ...
- Workflow Diagram Examples | Workflow Diagrams | Workflow ...
- How To Create Presentation for Trainings and Learning process ...
- Skype - eLearning Learning | One formula of professional mind ...
- Physics | Biology | Language Learning | An Example Of A Solution In ...
- The Best Choice for Creating Diagram | Visual Presentations Made ...
- eLearning for Skype | Business Diagram Software | Skype as ...
- Concept Maps | Basic Diagramming | The Best Mac Software for ...
- ConceptDraw Arrows10 Technology | Business Graphics and ...
- How To Create Presentation for Trainings and Learning process ...
- Physics | Biology | Language Learning | Science Solution Examples
- Language Learning | Language School E- Learning | Unified ...
- Diagram Software
- How To Create Presentation for Trainings and Learning process ...
- Horizontal bar chart - The most spoken languages of the world ...
- Remote Learning Sessions - Webinars | Business Process Elements ...
- Universal Diagramming Area | Concept Maps | eLearning for Skype ...
