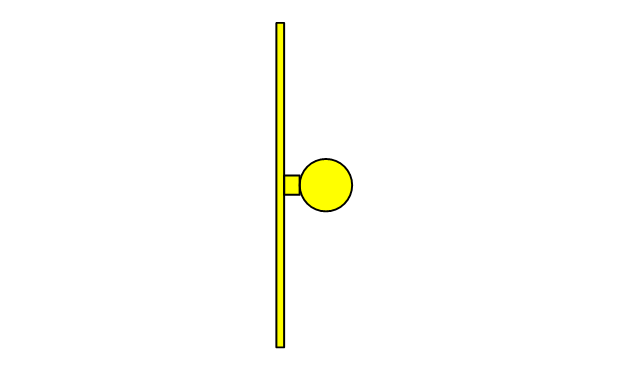
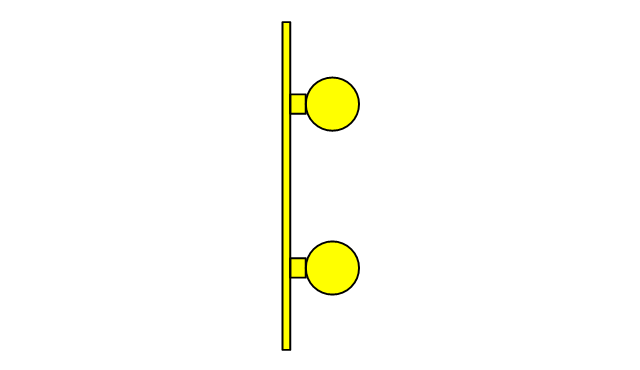
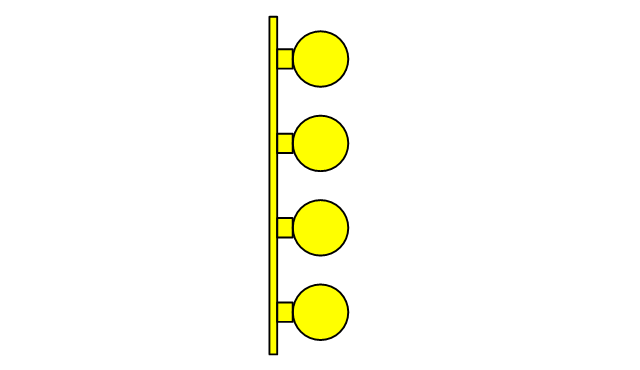
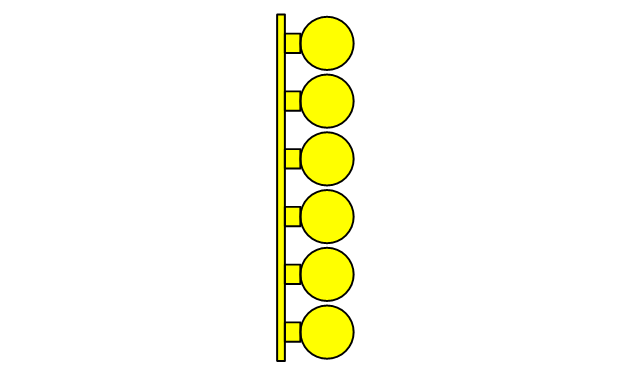
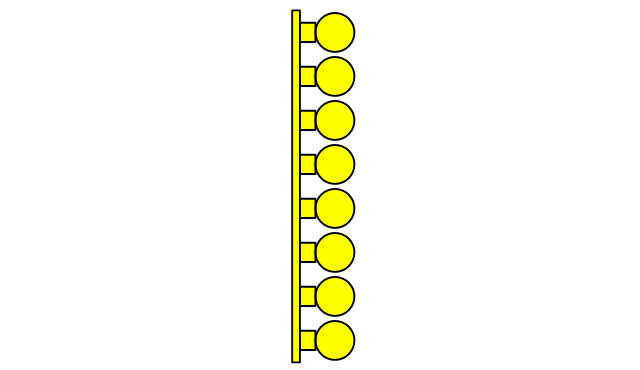
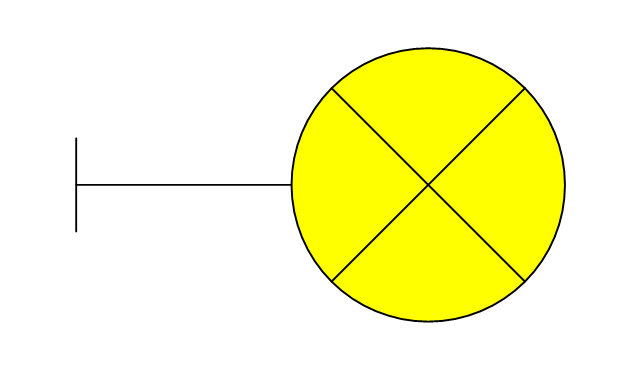
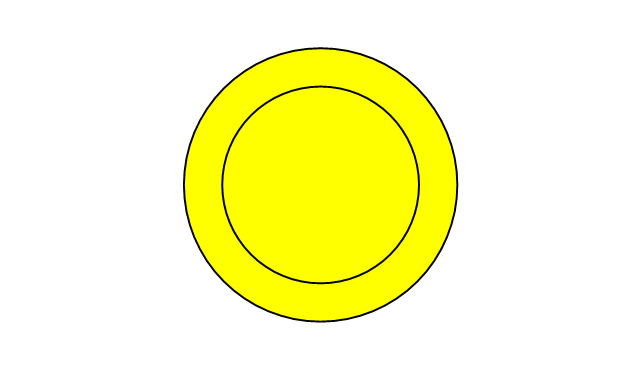
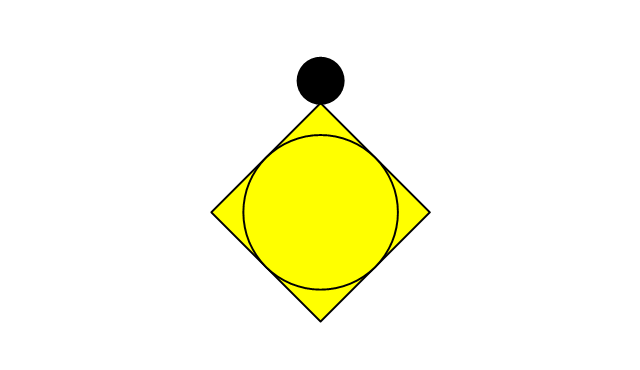
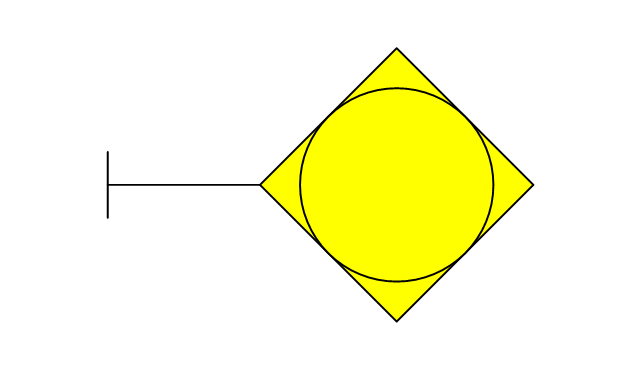
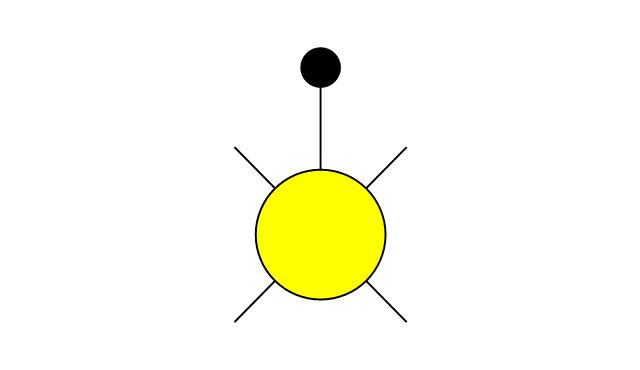
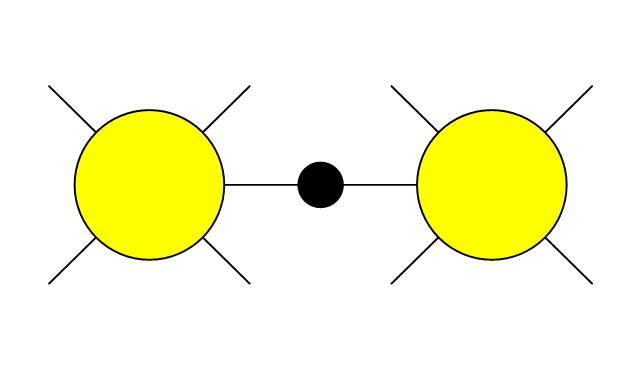
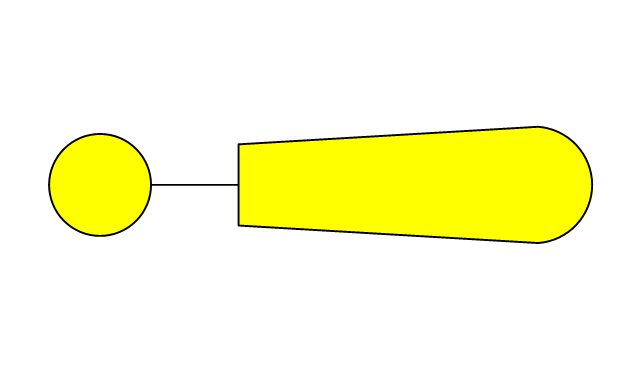
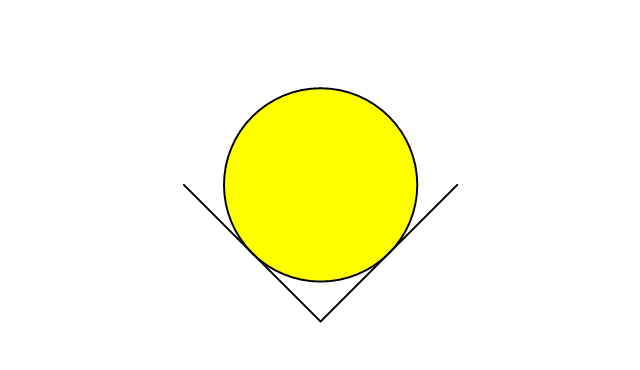
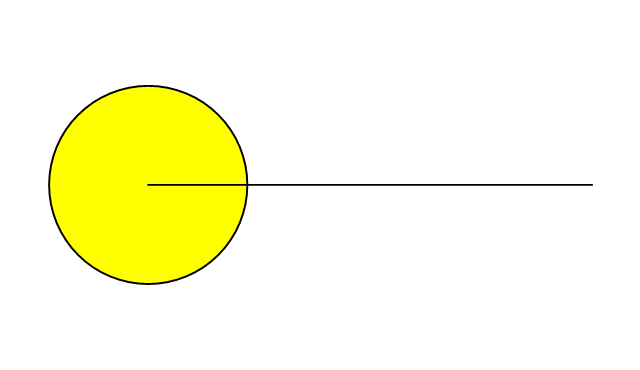
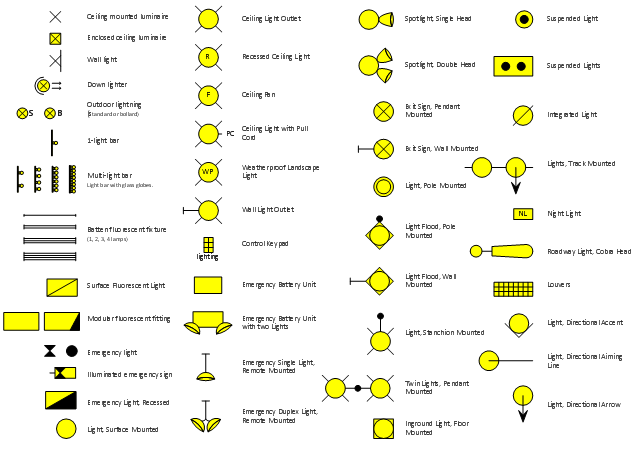
The vector stencils library "Lighting" contains 55 symbols of lighting devices and equipment.
Use these shapes for drawing lighting design floor plans, circuit schematic and wiring diagrams, cabling layouts, and reflected ceiling plans in the ConceptDraw PRO diagramming and vector drawing software.
The vector stencils library "Lighting" is included in the Electric and Telecom Plans solution from the Building Plans area of ConceptDraw Solution Park.
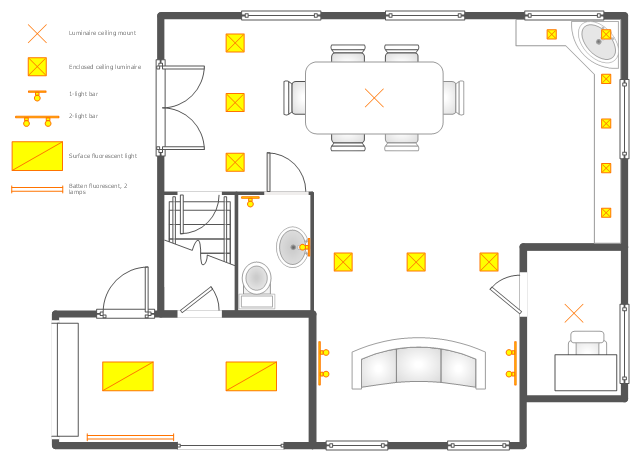
This reflected ceiling plan (RCP) sample depicts the ground floor lighting scheme.
"Downlighting is most common, with fixtures on or recessed in the ceiling casting light downward. This tends to be the most used method, used in both offices and homes. Although it is easy to design it has dramatic problems with glare and excess energy consumption due to large number of fittings. The introduction of LED lighting has greatly improved this by approx. 90% when compared to a halogen downlight or spotlight. LED lamps or bulbs are now available to retro fit in place of high energy consumption lamps.
" [Lighting. Wikipedia]
The lighting scheme example "Ground floor RCP" was created using the ConceptDraw DIAGRAM diagramming and vector drawing software extended with the Reflected Ceiling Plans solution from the Building Plans area of ConceptDraw Solution Park.
"Dashboards give signs about a business letting the user know something is wrong or something is right. ...
Balanced Scoreboards and Dashboards have been linked together as if they were interchangeable. However, although both visually display critical information, the difference is in the format: Scoreboards can open the quality of an operation while dashboards provide calculated direction. A balanced scoreboard has what they called a “prescriptive” format. It should always contain these components (Active Strategy) ...
(1) Perspectives – groupings of high level strategic areas.
(2) Objectives – verb-noun phrases pulled from a strategy plan.
(3) Measures – also called Metric or Key Performance Indicators (KPIs).
(4) Spotlight Indicators – red, yellow, or green symbols that provide an at-a-glance view of a measure’s performance.
Each of these sections ensures that a Balanced Scorecard is essentially connected to the businesses critical strategic needs.
The design of a dashboard is more loosely defined. Dashboards are usually a series of graphics, charts, gauges and other visual indicators that can be monitored and interpreted. Even when there is a strategic link, on a dashboard, it may not be noticed as such since objectives are not normally present on dashboards. However, dashboards can be customized to link their graphs and charts to strategic objectives." [Dashboard (business). Wikipedia]
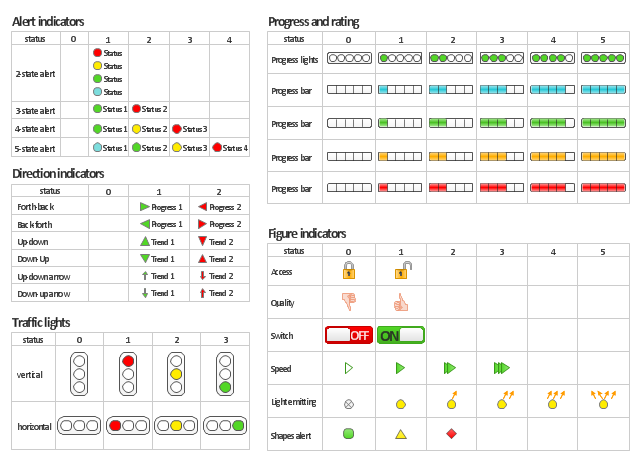
The vector stencils library "Status indicators" contains 41 visual status indicators for creating the business performance dashboards using the ConceptDraw PRO diagramming and vector drawing software.
Each status indicator can visualize one of 2-6 information states and have a caption.
Status indicators allow you quickly estimate, where your immediate decision and action is critical.
The example "Design elements - Status indicators" is included in the Status Dashboard solution from the area "What is a Dashboard" of ConceptDraw Solution Park.
Process Flow Chart
A Process Flow Chart is a type of flowchart which is mostly used in industrial, chemical and process engineering for illustrating high-level processes, major plant processes and not shows minor details. ConceptDraw DIAGRAM diagramming and vector drawing software extended with Flowcharts Solution from the "Diagrams" Area of ConceptDraw Solution Park is the best way to create Process Flow Chart and other types of flowcharts.Processing Flow Chart
Processing Flow Chart is a simplified sketch which is used in chemical and process engineering for illustrating general plant streams, major equipments and key control loops.ConceptDraw DIAGRAM enhanced with Flowcharts Solution from the "Diagrams" Area of ConceptDraw Solution Park is a powerful Processing Flow Chart software which will help save lots of your time.
The vector stencils library "Lighting" contains 55 symbols of lighting devices and equipment, light sources, lamps and light fixtures.
"Lighting or illumination is the deliberate use of light to achieve a practical or aesthetic effect. Lighting includes the use of both artificial light sources like lamps and light fixtures, as well as natural illumination by capturing daylight.
Indoor lighting is usually accomplished using light fixtures, and is a key part of interior design. Lighting can also be an intrinsic component of landscape projects." [Lighting. Wikipedia]
Use the design elements library "Lighting" for drawing lighting design floor plans, circuit schematic and wiring diagrams, cabling layouts, and reflected ceiling plans using the ConceptDraw PRO diagramming and vector drawing software.
The shapes library "Lighting" is included in the Electric and Telecom Plans solution from the Building Plans area of ConceptDraw Solution Park.
Process Flow Maps
What is a Process Flow Map? It is a chart which visually illustrates a business process and how its steps work together. Process Flow Maps help companies define problem areas, inefficient activities for the purpose of further increasing performance and profitability of businesses. ConceptDraw DIAGRAM diagramming and vector drawing software extended with Flowcharts solution from the "Diagrams" area of ConceptDraw Solution Park is efficient and productive software for fast and simple creating professional looking Process Flow Map.Process Flow Chart Examples
Process Flow Chart is a visual illustration of overall flow of activities in producing a product or service. How do you make a Process Flow Chart usually? Drawing process flow charts, diagrams and maps is quite complex and lengthy process, especially if you draw free-hand. But now thanks to the ConceptDraw DIAGRAM diagramming and vector drawing software extended with Flowcharts solution from the "Diagrams" area of ConceptDraw Solution Park this process became simple and fast. A confirmation of this can serve many Process Flow Chart examples included in Flowcharts solution.Dashboard
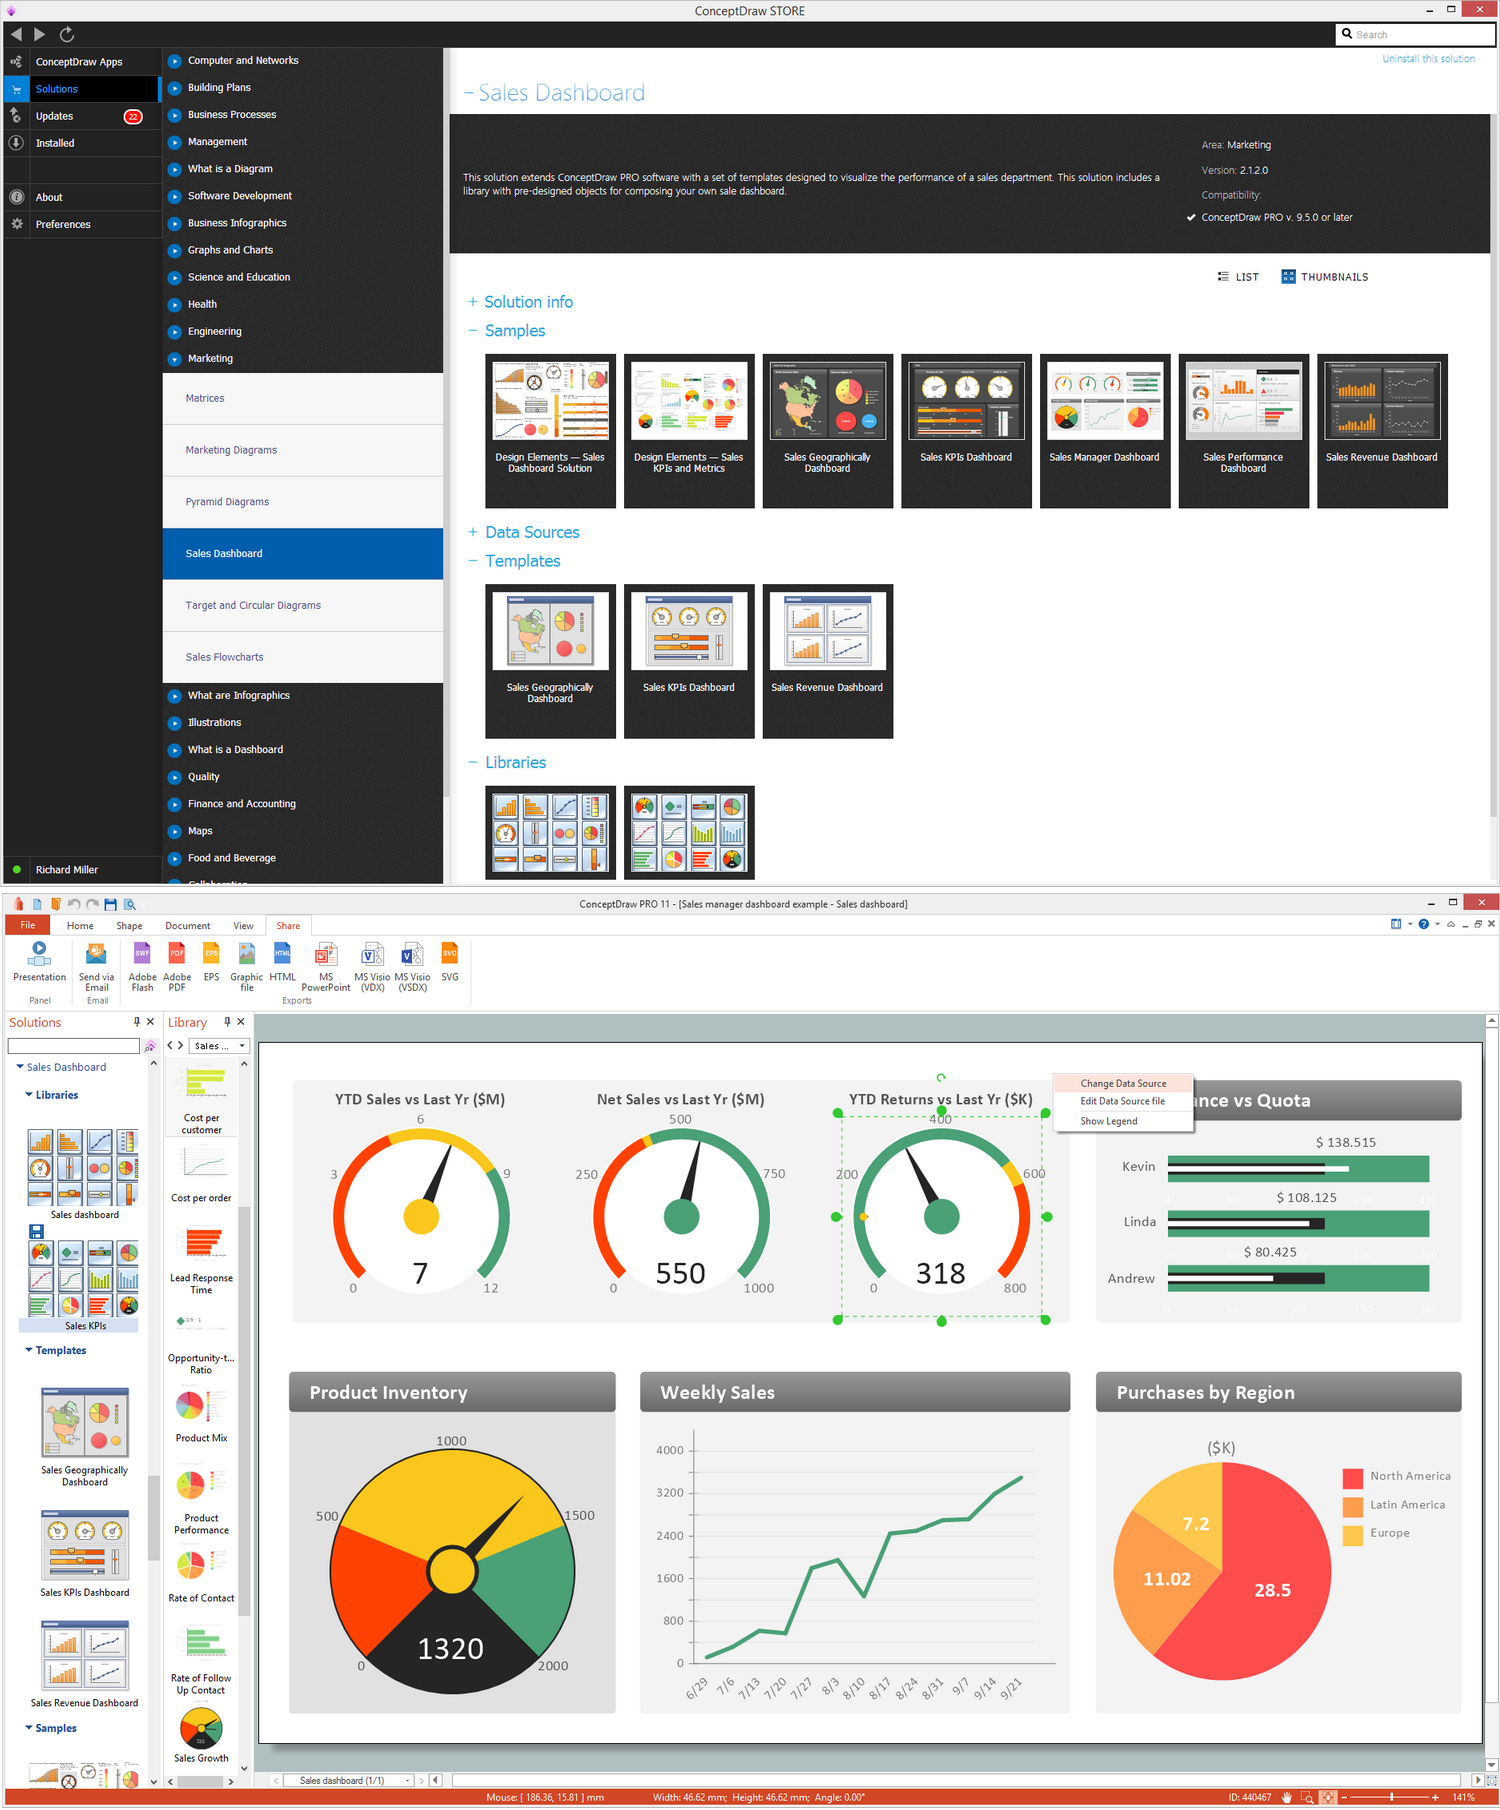
ConceptDraw DIAGRAM extended with Sales Dashboard solution from the Marketing area of ConceptDraw Solution Park is a perfect software for creating the live dashboard for the business data and progress visualization.- Spotlight Symbol Floor Plan
- Spotlight Plan Symbol
- Electrical Plan Spotlight
- Spotlight Electrical Symbol Diagram
- Spotlight Floor Plan Icon
- Circuit Symbol Of Spotlight
- Spotlight Plaster Ceiling Plan
- Lighting - Vector stencils library | Spotlight Symbol In Electrical
- Design elements - Lighting | How to Draw a Landscape Design Plan ...
- Spotlight
