HelpDesk
How to Create a Custom Filter in ConceptDraw PROJECT for Windows

HelpDesk
ConceptDraw PROJECT: Filter Tasks and Resources on Mac

HelpDesk
Embedded Filtering Capabilities in ConceptDraw PROJECT for Windows

How to Create Presentation of Your Project Gantt Chart

Construction Project Chart Examples

HelpDesk
How to Add conceptdraw.com Domain to Custom Safe Senders List

 Chemistry
This solution extends ConceptDraw PRO software with samples, template and libraries of vector stencils for drawing the Chemistry Illustrations for science and education.
Network Security Devices

Gantt Chart Software

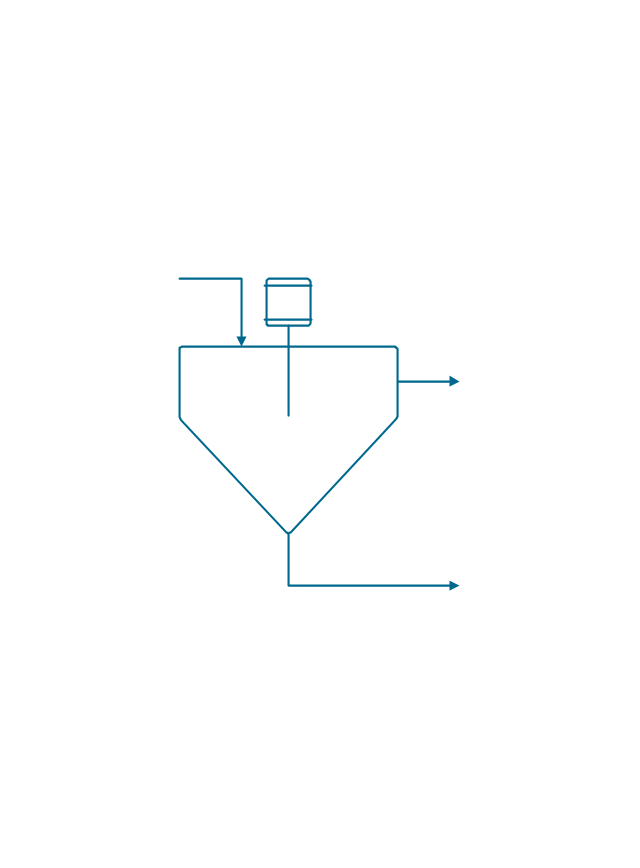
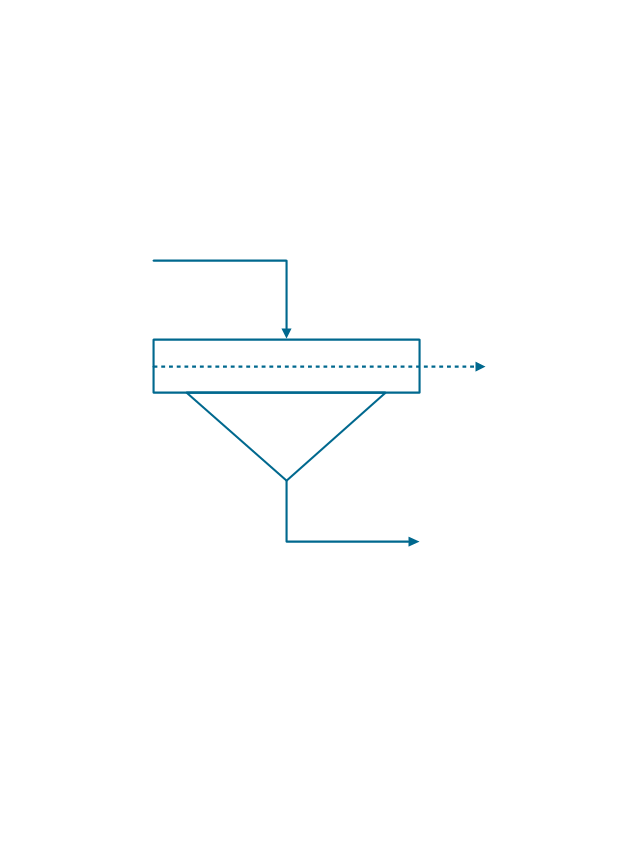
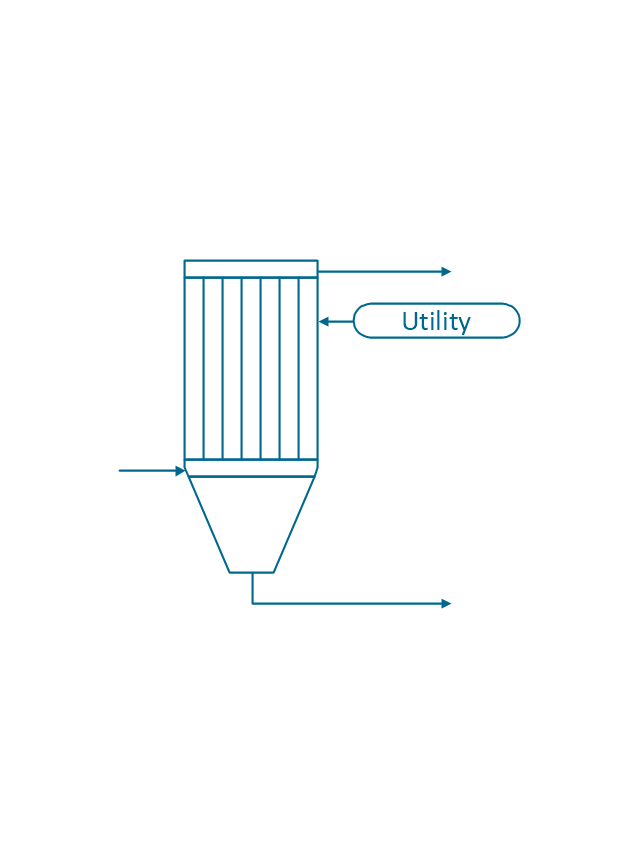
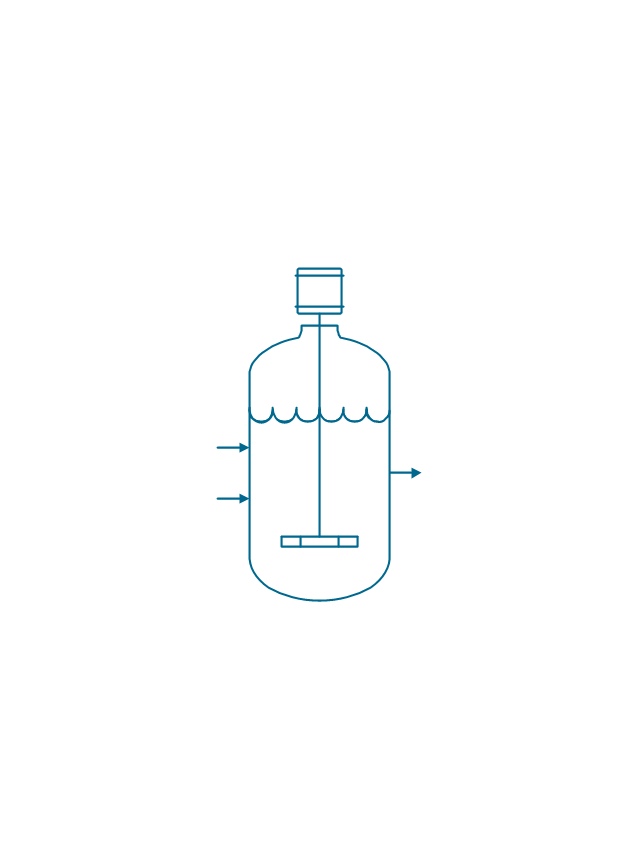
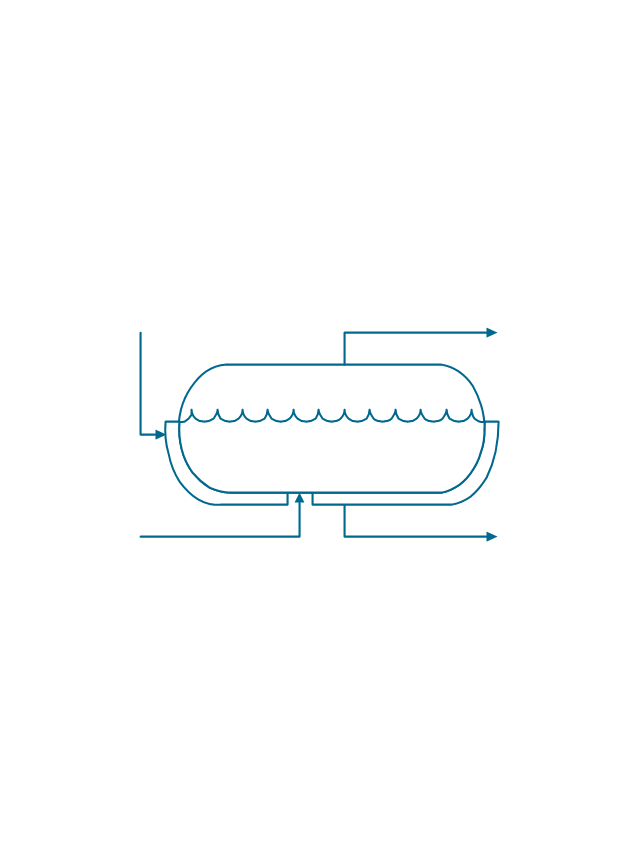
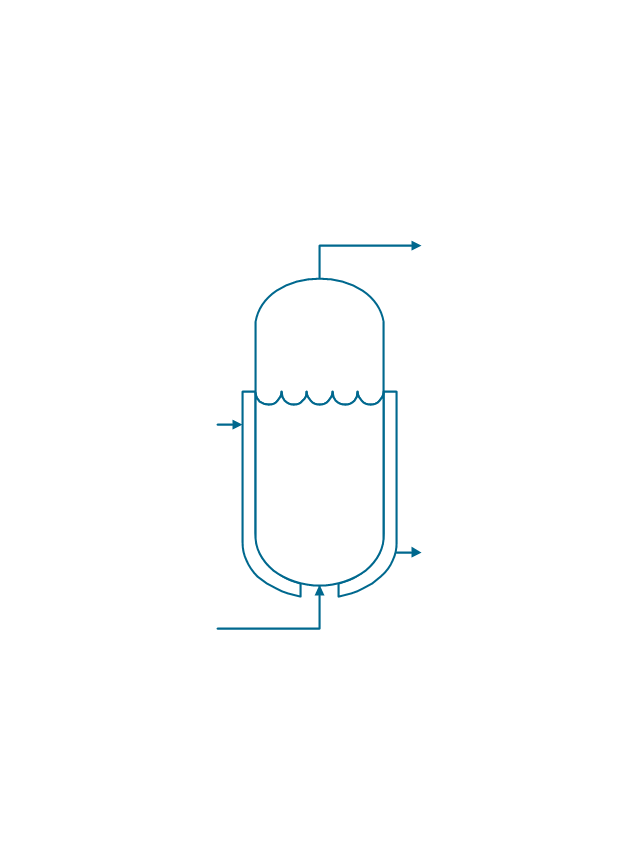
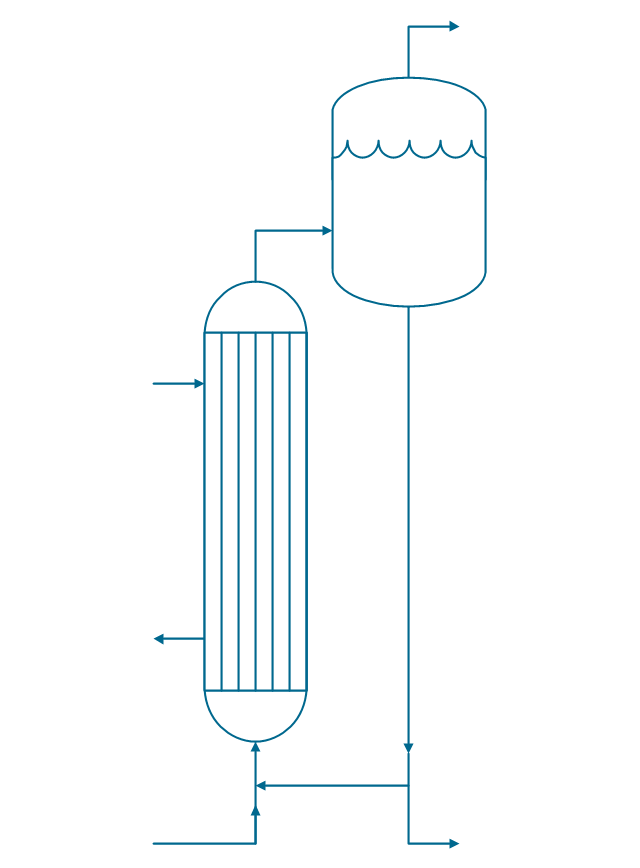
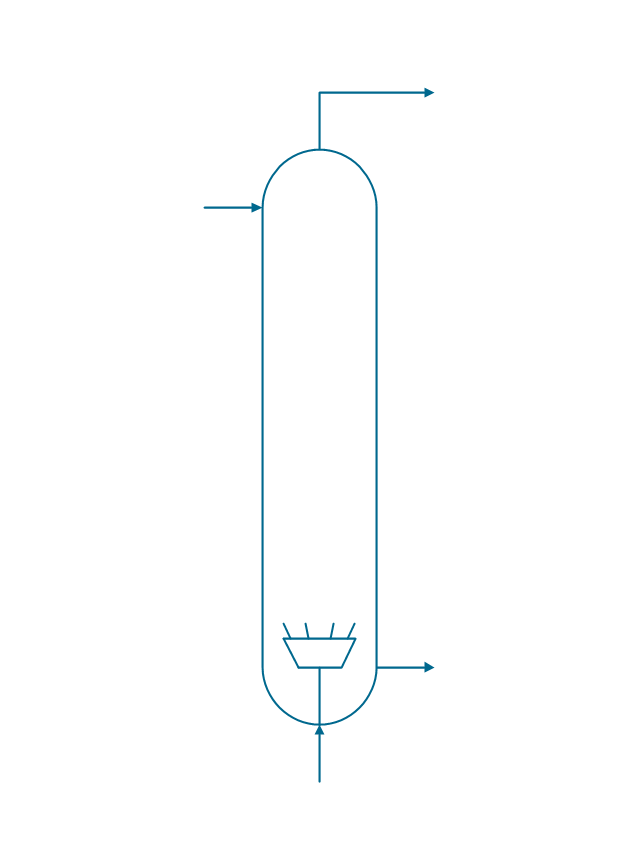
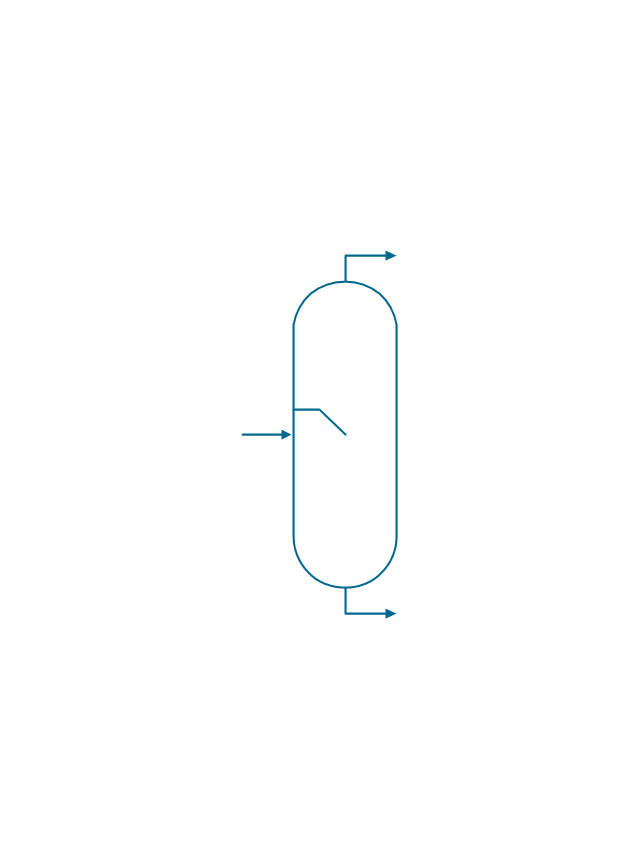
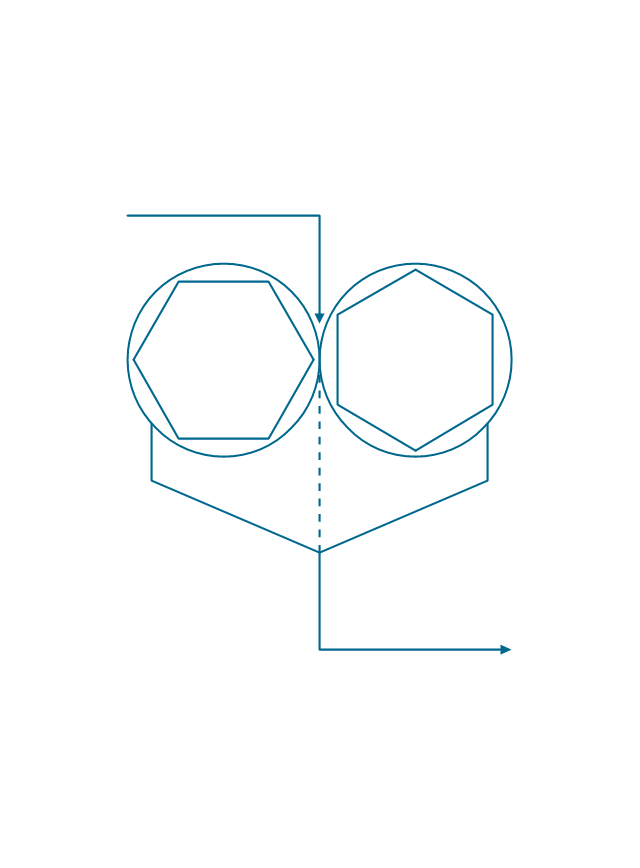
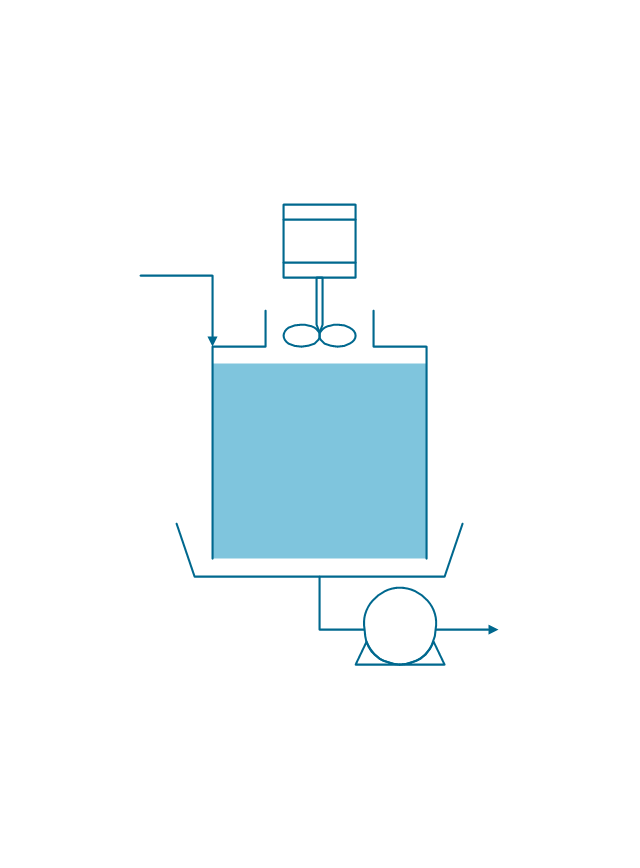
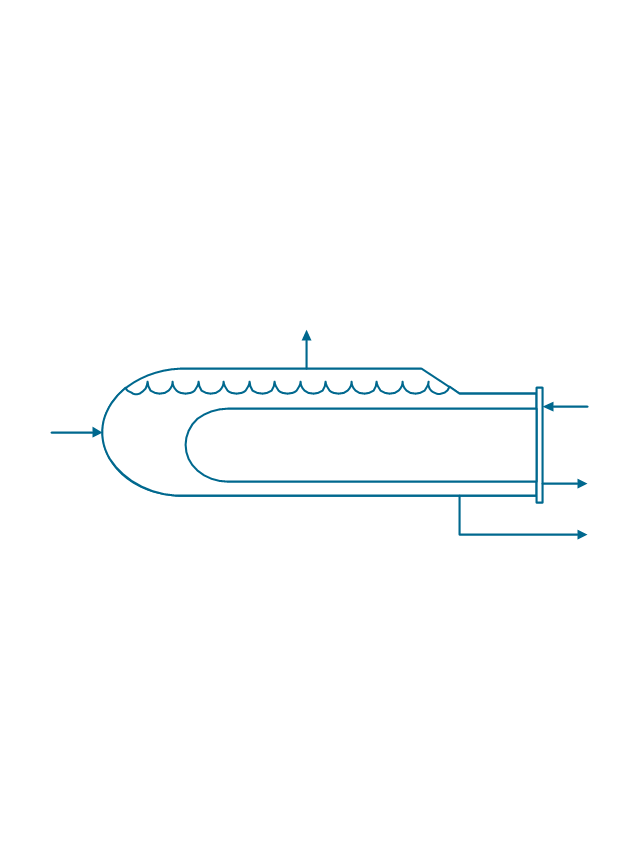
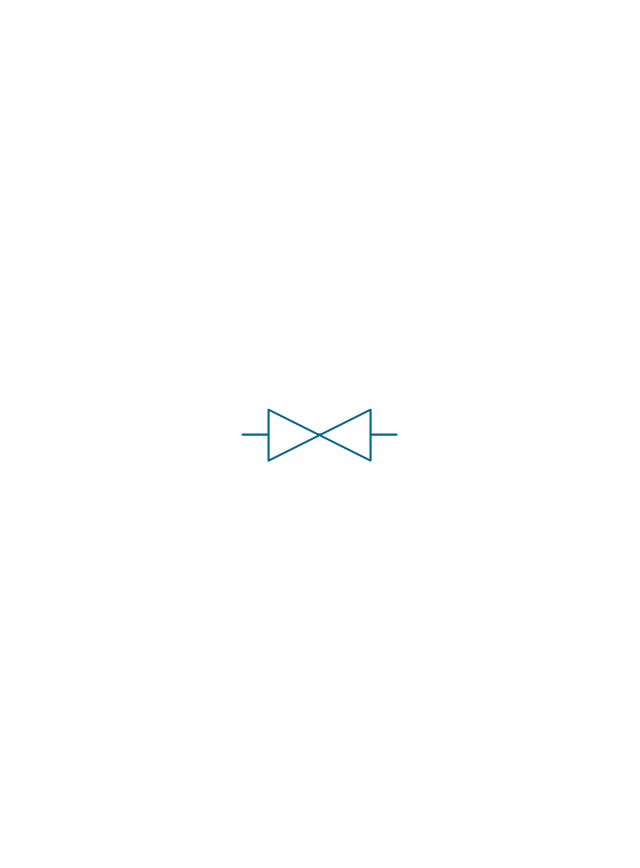
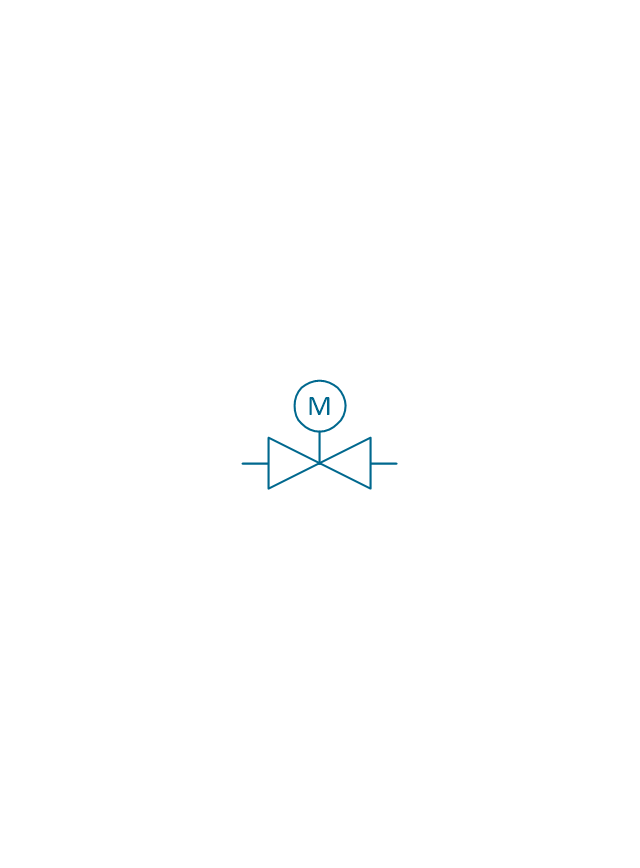
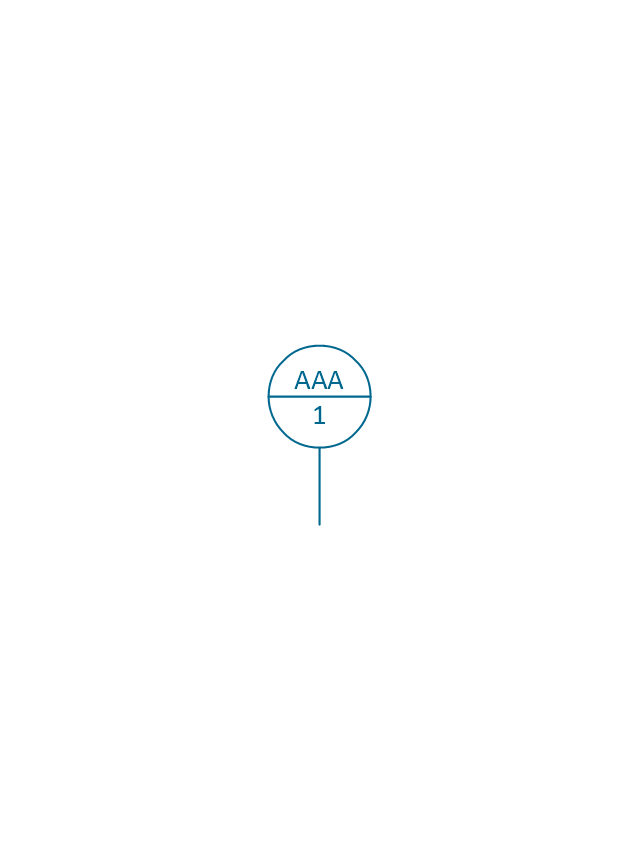
The vector stencils library "Chemical engineering" contains 24 symbols of chemical and process engineering equipment.
Use these shapes for drawing Process Flow Diagrams (PFD), Piping and Instrumentation Diagrams (P&ID), and Water Flow Diagrams in the ConceptDraw PRO software extended with the Chemical and Process Engineering solution from the Chemical and Process Engineering area of ConceptDraw Solution Park.
www.conceptdraw.com/ solution-park/ engineering-chemical-process
Clarifier
Screen
Filter
Agitator
Vapor 1
Vapor 2
Vessel

Pump mixer

Centrifugal pump

Fan

Blower

Evaporator
Tower
Flash drum
Roll press
Cooling tower
Tank car

Tank truck

Kettle
Valve
Motor valve
Venturi

Propeller

Instrument
How to Create Gantt Chart

This work flow chart sample was redesigned from the picture "Weather Forecast" from the article "Simulation Workflows".
[iaas.uni-stuttgart.de/ forschung/ projects/ simtech/ sim-workflows.php]
"(1) The weather is predicted for a particular geological area. Hence, the workflow is fed with a model of the geophysical environment of ground, air and water for a requested area.
(2) Over a specified period of time (e.g. 6 hours) several different variables are measured and observed. Ground stations, ships, airplanes, weather balloons, satellites and buoys measure the air pressure, air/ water temperature, wind velocity, air humidity, vertical temperature profiles, cloud velocity, rain fall, and more.
(3) This data needs to be collected from the different sources and stored for later access.
(4) The collected data is analyzed and transformed into a common format (e.g. Fahrenheit to Celsius scale). The normalized values are used to create the current state of the atmosphere.
(5) Then, a numerical weather forecast is made based on mathematical-physical models (e.g. GFS - Global Forecast System, UKMO - United Kingdom MOdel, GME - global model of Deutscher Wetterdienst). The environmental area needs to be discretized beforehand using grid cells. The physical parameters measured in Step 2 are exposed in 3D space as timely function. This leads to a system of partial differential equations reflecting the physical relations that is solved numerically.
(6) The results of the numerical models are complemented with a statistical interpretation (e.g. with MOS - Model-Output-Statistics). That means the forecast result of the numerical models is compared to statistical weather data. Known forecast failures are corrected.
(7) The numerical post-processing is done with DMO (Direct Model Output): the numerical results are interpolated for specific geological locations.
(8) Additionally, a statistical post-processing step removes failures of measuring devices (e.g. using KALMAN filters).
(9) The statistical interpretation and the numerical results are then observed and interpreted by meteorologists based on their subjective experiences.
(10) Finally, the weather forecast is visualized and presented to interested people." [iaas.uni-stuttgart.de/ forschung/ projects/ simtech/ sim-workflows.php]
The example "Workflow diagram - Weather forecast" was drawn using the ConceptDraw PRO diagramming and vector drawing software extended with the Workflow Diagrams solution from the Business Processes area of ConceptDraw Solution Park.
Work flow chart

Chemistry Symbols and Meanings

- How to Create a Custom Filter in ConceptDraw PROJECT for Windows
- Data Flow Diagram Symbols. DFD Library | Basic Flowchart ...
- Cross-Functional Flowchart (Swim Lanes) | Swim Lane Diagrams ...
- Custom Org Chart
- Testing Workflow Diagram
- Exam About Flowchart And Data Flow Diagram
- Basic Flowchart Symbols and Meaning | Process Flowchart | Cross ...
- Chemical Engineering | Chemical and Process Engineering ...
- Process Flow Diagram Symbols | Process Flowchart | Design ...
- Embedded Filtering Capabilities in ConceptDraw PROJECT for ...
- Process Flowchart | Process Flow Diagram Symbols | Process ...
- Process Flow Diagram Symbols Chemical Engineering Centrifuge
- How to Use Filters | Chemical engineering - Vector stencils library ...
- Electrical Symbols — Inductors | Workflow diagram - Weather ...
- Process P
- Sales Process Flowchart Symbols | Work Flow Chart | Workflow ...
- Process Engineering | Process Flow Diagram Symbols | Process ...
- Process Flow Diagram Symbols | Chemical and Process ...
- Workflow diagram - Weather forecast | Types of Flowcharts | Line ...
- Electrical Symbols, Electrical Diagram Symbols | Electrical Drawing ...