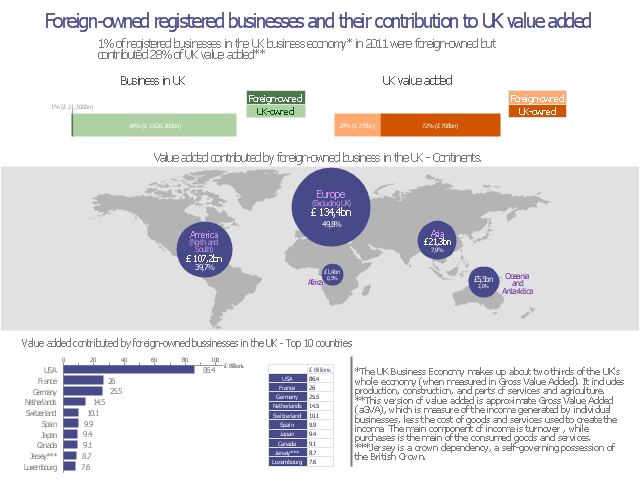
This data-driven infographics example was redesigned from the Wikimedia Commons file: Foreign-owned registered businesses and their contribution to UK value added.png.
"A snapshot of ONS’s Annual Business Survey (ABS) to look at the contribution that foreign-owned registered businesses (20.9 Kb Pdf) in the UK make to the UK Business Economy, and their country of ownership." [commons.wikimedia.org/ wiki/ File:Foreign-owned_ registered_ businesses_ and_ their_ contribution_ to_ UK_ value_ added.png]
The divided bar diagram and bar chart example "Value added contributed by foreign-owned" was created using the ConceptDraw PRO diagramming and vector graphics software extended with the Data-driven Infographics" solution from the area "What is infographics" of ConceptDraw Solution Park.
Used Solutions
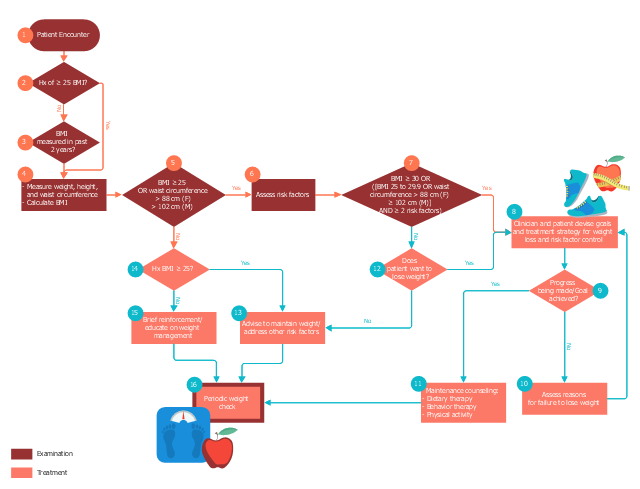
This medical flowchart sample shows assessment and treatment algorithm for overweight and obesity.
It was drawn on the base of Wikimedia Commons file: Assessment and treatment algorithm for overweight and obesity.png. [commons.wikimedia.org/ wiki/ File:Assessment_ and_ treatment_ algorithm_ for_ overweight_ and_ obesity.png]
"A medical algorithm is any computation, formula, statistical survey, nomogram, or look-up table, useful in healthcare. Medical algorithms include decision tree approaches to healthcare treatment (e.g., if symptoms A, B, and C are evident, then use treatment X) and also less clear-cut tools aimed at reducing or defining uncertainty." [Medical algorithm. Wikipedia]
The medical flow chart example "Assessment and treatment algorithm for overweight and obesity" was designed using ConceptDraw PRO software extended with Healthcare Workflow Diagrams solution from Business Processes area of ConceptDraw Solution Park.
 HR Flowcharts
Human resource management diagrams show recruitment models, the hiring process and human resource development of human resources.
Simple Diagramming
Create flowcharts, org charts, floor plans, business diagrams and more with ConceptDraw DIAGRAM.
This data-driven infographics example was redesigned from the Wikimedia Commons file: Benjamin Ebel Quick You Tube Survey Results.jpg.
The infographic survey includes horizontal bar graph "More Youtube than TV?", column chart "When do you watch Youtube?", and bubble diagram "Most watched content?". [commons.wikimedia.org/ wiki/ File:Benjamin_ Ebel_ Quick_ You_ Tube_ Survey_ Results.jpg]
This file is licensed under the Creative Commons Attribution-Share Alike 3.0 Unported license. [creativecommons.org/ licenses/ by-sa/ 3.0/ deed.en]
The column chart and bar graph sample "Quick YouTube Survey" was created using the ConceptDraw PRO diagramming and vector graphics software extended with the Data-driven Infographics" solution from the area "What is infographics" of ConceptDraw Solution Park.
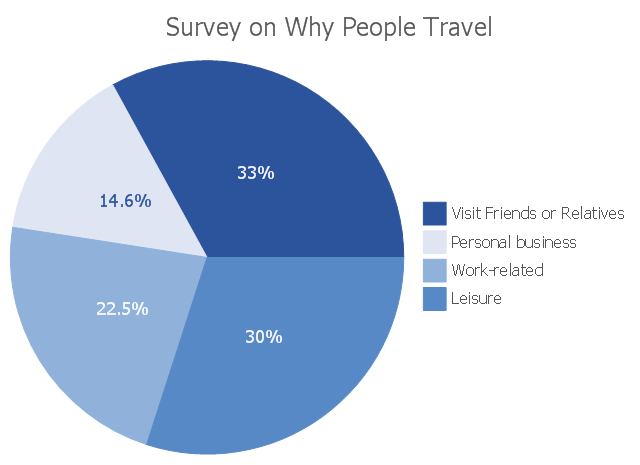
This pie chart sample shows the results of survey on Why People Travel. It was designed on the base of the Wikimedia Commons file: Pie chart.jpeg. [commons.wikimedia.org/ wiki/ File:Pie_ chart.jpeg]
"Travel is the movement of people between relatively distant geographical locations, and can involve travel by foot, bicycle, automobile, train, boat, airplane, or other means, with or without luggage, and can be one way or round trip. Travel can also include relatively short stays between successive movements." [Travel. Wikipedia]
The pie chart example "Survey on Why People Travel" was created using ConceptDraw PRO software extended with the Pie Charts solution from the Statistical Charts and Diagrams area of ConceptDraw Solution Park.
The vector stencils library "HR workflow" contains 60 HR workflow symbols.
Use this HR icon set to draw your HR flowcharts, workflow diagrams and process charts with the ConceptDraw PRO diagramming and vector drawing software.
The HR pictograms library "HR workflow" is included in the HR Flowcharts solution from the Management area of ConceptDraw Solution Park.
Use this HR icon set to draw your HR flowcharts, workflow diagrams and process charts with the ConceptDraw PRO diagramming and vector drawing software.
The HR pictograms library "HR workflow" is included in the HR Flowcharts solution from the Management area of ConceptDraw Solution Park.
Chart Templates
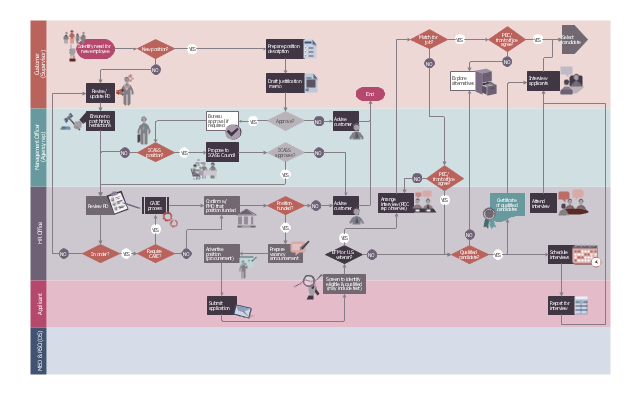
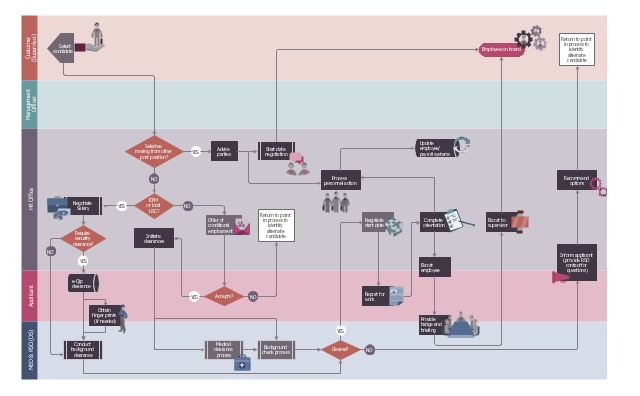
Easy charting software comes with beautiful chart templates and examples. This makes it easy to create professional charts without prior experience.This HR flowchart example was redesigned from the Wikimedia Commons files: File:(5) 2008-07-07 Recruitment pg1.jpg (1st page), File:(5) 2008-07-07 Recruitment pg2.jpg (2nd page).
[commons.wikimedia.org/ wiki/ File:(5)_ 2008-07-07_ Recruitment_ pg1.jpg, commons.wikimedia.org/ wiki/ File:(5)_ 2008-07-07_ Recruitment_ pg2.jpg]
"ROLE OF THE POST EMPLOYMENT COMMITTEE (PEC).
The Post Employment Committee (PEC) ensures the proper application of the US Citizen EFM and US Veterans Hiring Preference is applied." [icass.gov/ home/ Documents/ HR-OE%20 Interagency%20 Docs/ Local%20 Employment%20 Recruitment%20 Policy.pdf]
The cross-functional flowchart example "Post Employment Committee recruitment flowchart" was created using the ConceptDraw PRO diagramming and vector drawing software extended with the HR Flowcharts solution from the Management area of ConceptDraw Solution Park.







-hr-workflow---vector-stencils-library.png--diagram-flowchart-example.png)














-hr-workflow---vector-stencils-library.png--diagram-flowchart-example.png)


