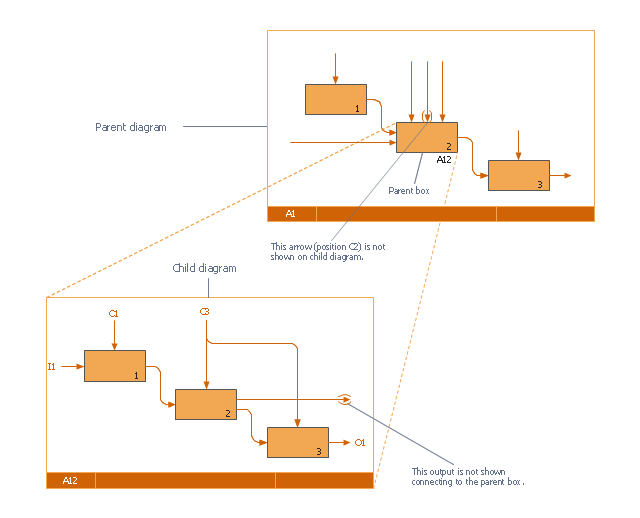
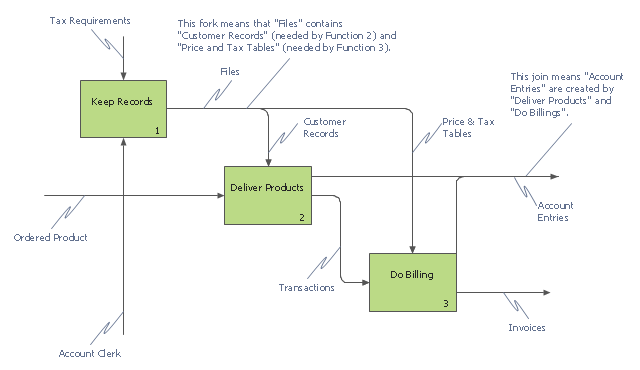
This IDEF0 diagram was redesigned from the Wikimedia Commons file: 18 Example of Tunneled Arrows.svg.
[commons.wikimedia.org/ wiki/ File:18_ Example_ of_ Tunneled_ Arrows.svg]
"Tunneled Arrows.
Arrows that provide information at one level of decomposition but are not needed at another (parent, child) level." [classes.engr.oregonstate.edu/ mime/ fall2013/ ie545-001/ Slides/ class%20 01-3b%20 IDEF0%20 1%20 revised.pdf]
The example "IDEF0 diagram - Tunneled arrows" was created using the ConceptDraw PRO diagramming and vector drawing software extended with the solution "IDEF Business Process Diagrams" from the area "Business Processes" of ConceptDraw Solution Park.
This IDEF0 diagram example was redesigned from the Wikimedia Commons file: 7 Detail Reference Expression Use.svg.
[commons.wikimedia.org/ wiki/ File:7_ Detail_ Reference_ Expression_ Use.svg]
The example "IDEF0 diagram - Detail reference expression use" was created using the ConceptDraw PRO diagramming and vector drawing software extended with the solution "IDEF Business Process Diagrams" from the area "Business Processes" of ConceptDraw Solution Park.
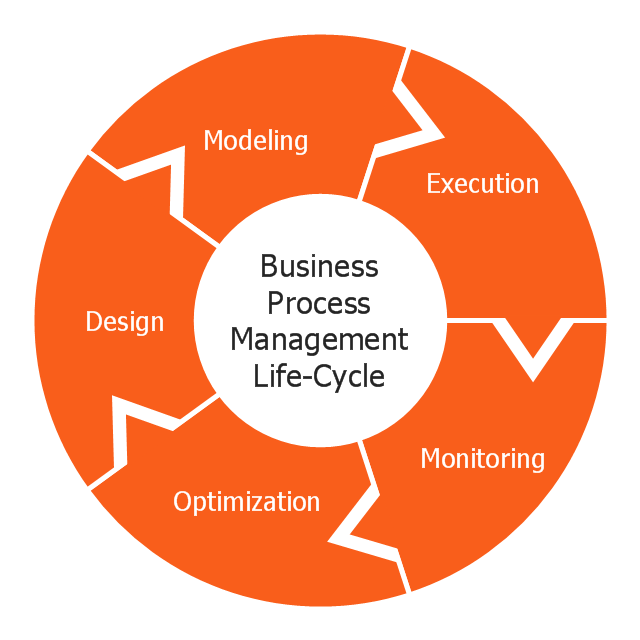
This circular arrows diagram sample shows business process management life cycle.
It was designed on the base of the Wikimedia Commons file: Business Process Management Life-Cycle.svg. [commons.wikimedia.org/ wiki/ File:Business_ Process_ Management_ Life-Cycle.svg]
This file is licensed under the Creative Commons Attribution-Share Alike 3.0 Unported license. [creativecommons.org/ licenses/ by-sa/ 3.0/ deed.en]
"BPM life-cycle.
Business process management activities can be grouped into six categories: vision, design, modeling, execution, monitoring, and optimization.
Functions are designed around the strategic vision and goals of an organization. Each function is attached with a list of processes. Each functional head in an organization is responsible for certain sets of processes made up of tasks which are to be executed and reported as planned. Multiple processes are aggregated to function accomplishments and multiple functions are aggregated to achieve organizational goals." [Business process management. Wikipedia]
The arrow donut chart example "BPM life cycle" was created using the ConceptDraw PRO diagramming and vector drawing software extended with the Circular Arrows Diagrams solution from the area "What is a Diagram" of ConceptDraw Solution Park.
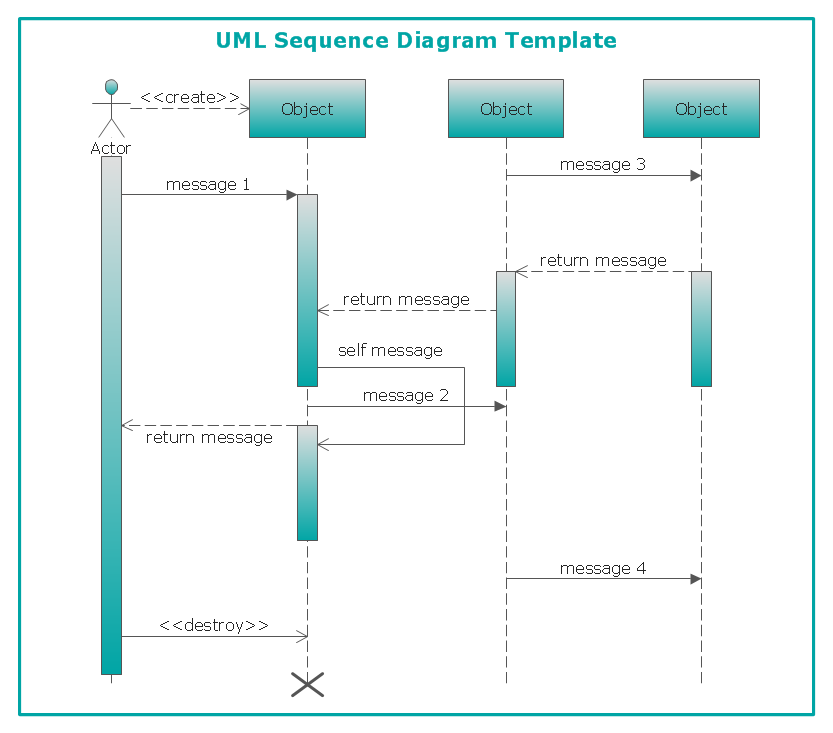
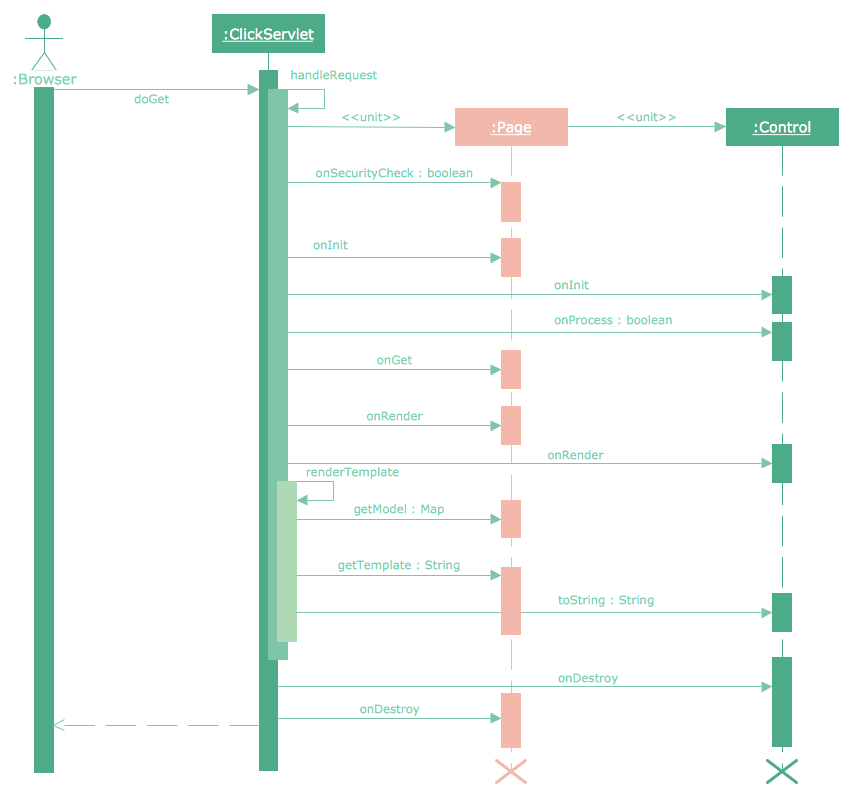
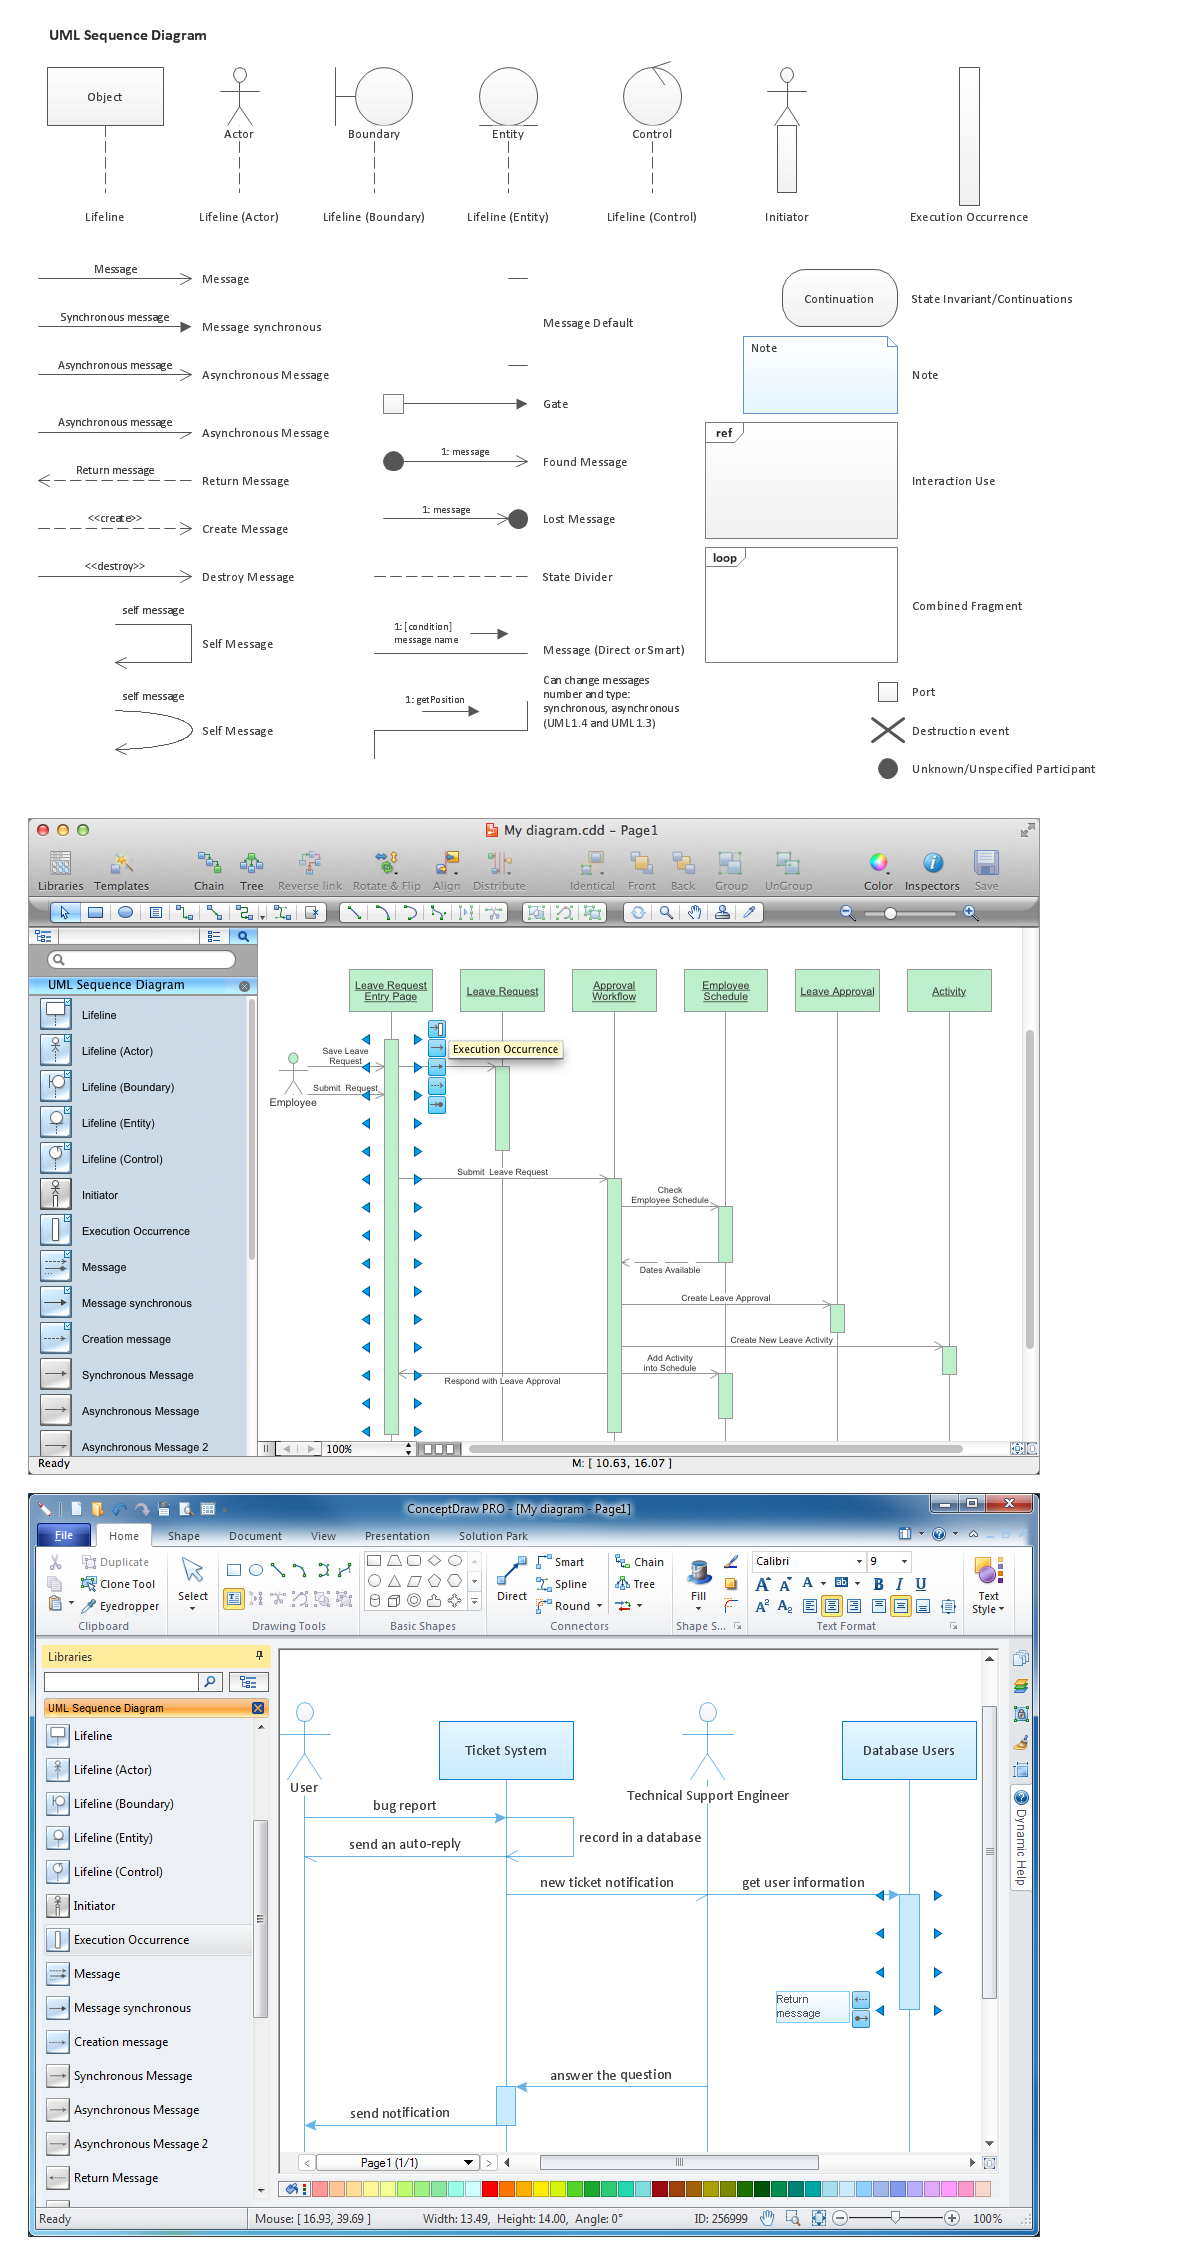
UML Sequence Diagram
UML Sequence Diagram can be created using ConceptDraw DIAGRAM diagramming software contains rich examples and template. ConceptDraw is perfect for software designers and software developers who need to draw UML Sequence Diagrams.
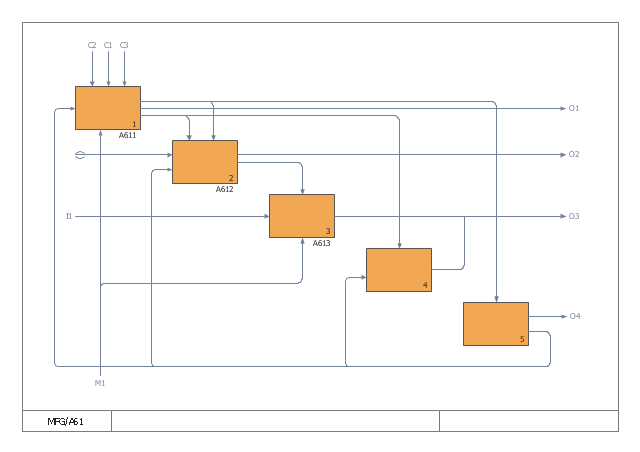
This IDEF0 diagram example was redesigned from the Wikimedia Commons file: 12 Connections Between Boxes.svg.
[commons.wikimedia.org/ wiki/ File:12_ Connections_ Between_ Boxes.svg]
"Graphical notation.
IDEF0 is a model that consists of a hierarchical series of diagrams, text, and glossary cross referenced to each other. The two primary modeling components are:
- functions (represented on a diagram by boxes), and
- data and objects that interrelate those functions (represented by arrows).
.... the position at which the arrow attaches to a box conveys the specific role of the interface. The controls enter the top of the box. The inputs, the data or objects acted upon by the operation, enter the box from the left. The outputs of the operation leave the right-hand side of the box. Mechanism arrows that provide supporting means for performing the function join (point up to) the bottom of the box." [IDEF0. Wikipedia]
The example "IDEF0 diagram - Inter-box connections" was created using the ConceptDraw PRO diagramming and vector drawing software extended with the solution "IDEF Business Process Diagrams" from the area "Business Processes" of ConceptDraw Solution Park.
Sequence Diagram Tool
ConceptDraw DIAGRAM diagramming and vector drawing software as a sequence diagram tool provides the Rapid UML Solution from the Software Development Area that contains the UML Sequence library.Diagramming Software for designing UML Sequence Diagrams
Sequence Diagrams shows how objects communicate with each other in terms of a sequence of messages. Also indicates the lifespans of objects relative to those messages.
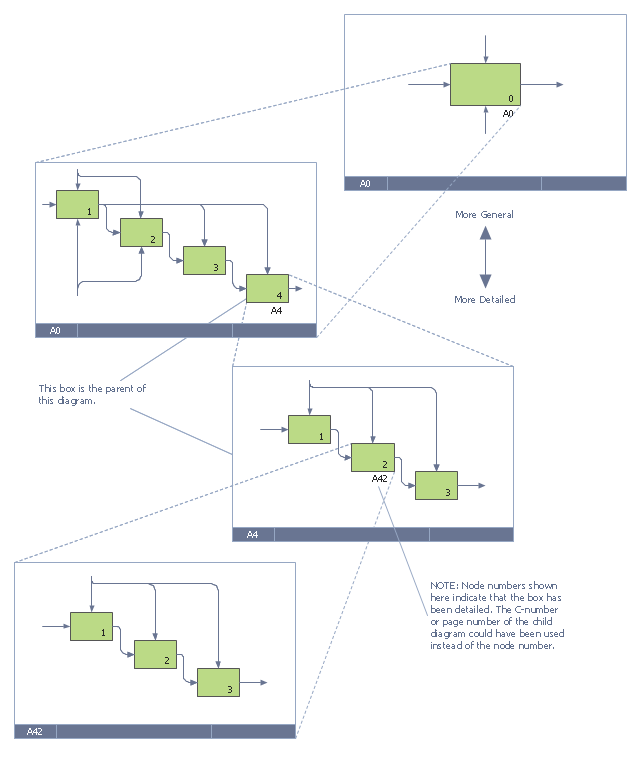
This IDEF0 diagram example was redesigned from the Wikimedia Commons file: 6 Decomposition Structure.svg.
[commons.wikimedia.org/ wiki/ File:6_ Decomposition_ Structure.svg]
"Functional decomposition refers broadly to the process of resolving a functional relationship into its constituent parts in such a way that the original function can be reconstructed (i.e., recomposed) from those parts by function composition. In general, this process of decomposition is undertaken either for the purpose of gaining insight into the identity of the constituent components (which may reflect individual physical processes of interest, for example), or for the purpose of obtaining a compressed representation of the global function, a task which is feasible only when the constituent processes possess a certain level of modularity (i.e., independence or non-interaction). Interactions between the components are critical to the function of the collection. All interactions may not be observable, but possibly deduced through repetitive perception, synthesis, validation and verification of composite behavior." [Functional decomposition. Wikipedia]
The example "IDEF0 diagram - Decomposition structure" was created using the ConceptDraw PRO diagramming and vector drawing software extended with the solution "IDEF Business Process Diagrams" from the area "Business Processes" of ConceptDraw Solution Park.
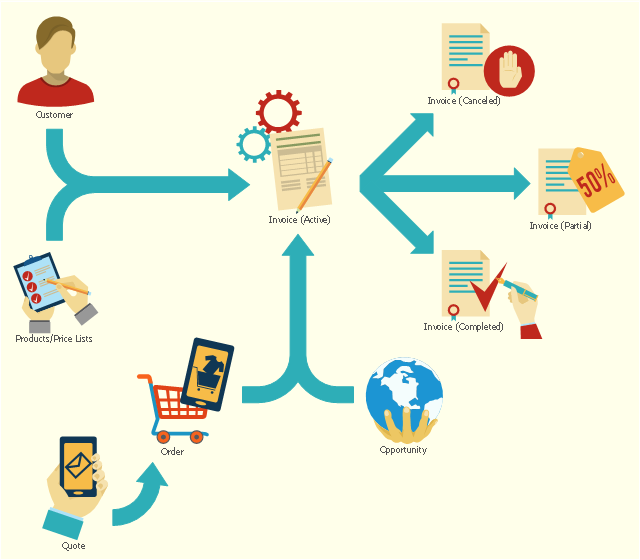
This flowchart example shows the lifecycle of an invoice in Microsoft Dynamics CRM. It was redesigned from the Wikimedia Commons file: Invoice lifecycle.svg. [commons.wikimedia.org/ wiki/ File:Invoice_ lifecycle.svg]
"Microsoft Dynamics CRM is a customer relationship management software package developed by Microsoft. Out of the box, the product focuses mainly on Sales, Marketing, and Service (help desk) sectors...
Dynamics CRM is a server-client application, which, like Microsoft SharePoint, is primarily an IIS-based web application which also supports extensive web services interfaces. Clients access Dynamics CRM either by using a Browser or by a thick client plug-in to Microsoft Outlook." [Microsoft Dynamics CRM. Wikipedia]
The process flowchart example "Invoice lifecycle" was created using the ConceptDraw PRO diagramming and vector drawing software extended with the Sales Flowcharts solution from the Marketing area of ConceptDraw Solution Park.
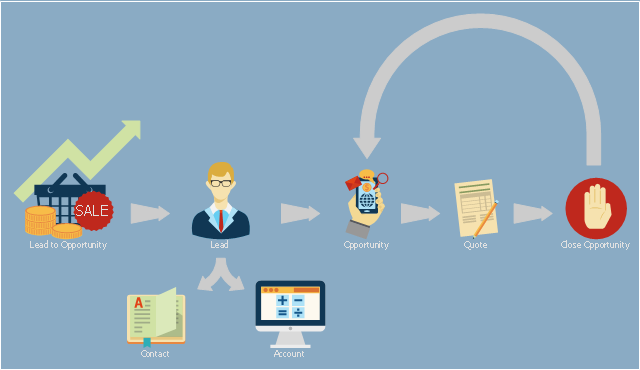
This presales process flowchart example depicts the Microsoft Dynamics CRM workflow from lead to opportunity. It was redesigned from the Wikimedia Commons file: Lead to Opportunity sales flow.svg. [commons.wikimedia.org/ wiki/ File:Lead_ to_ Opportunity_ sales_ flow.svg]
"Presales is a process or a set of activities normally carried out before a customer is acquired, though sometimes presales also extends into the period the product or service is delivered to the customer. ...
In a typical sales cycle the stages are:
(1) Contact.
(2) Lead / Suspect.
(3) Prospect / Opportunity.
The task of a presales person starts from the initial contact phase and often ends once the customer is acquired i.e. sale is made." [Presales. Wikipedia]
The process flowchart example "Lead to opportunity sales flow" was created using the ConceptDraw PRO diagramming and vector drawing software extended with the Sales Flowcharts solution from the Marketing area of ConceptDraw Solution Park.
Flowchart Software
Flowchart is a simple diagram, map or graphical schematic representation the sequence of actions within a process. It is ideal for displaying how a process currently flows or can function ideally. The Flowcharts let define the steps and boundaries of a process, uncover problems or miscommunications. The Flowcharts are widely used in education, software development, business, economics, thanks to their visuality they are ideal for presentations, reports, for using on conferences to help the audience comprehend the content better, or easy find flaws in a process flow diagrams. ConceptDraw DIAGRAM is professional flowcharts software and feature-rich flowchart maker, which supports Mac OS X and Windows. It contains at ConceptDraw Solution Park a rich set of stencils and professional flowchart symbols for design. It lets create simply professional-looking Flowcharts based on thousand free flowchart templates, colored symbols and examples. ConceptDraw DIAGRAM is a 3 times cheaper alternative to MS Visio available for both Mac and PC. It’s is another full featured business and technical diagramming application that can easily take care of Visio files within OS X. Another bonus with ConceptDraw DIAGRAM – it's cross-platform. You can work on a document in both OS X and Windows, skipping Visio entirely.
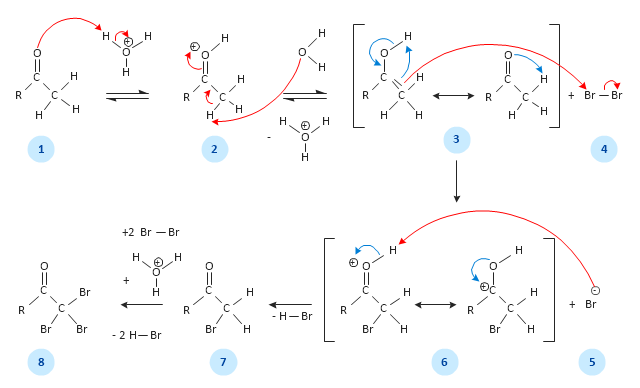
This chemical reaction mechanism drawing depicts steps of carbonyl compound halogenation reaction.
"Alpha-substitution reactions occur at the position next to the carbonyl group, the α-position, and involve the substitution of an α hydrogen atom by an electrophile, E, through either an enol or enolate ion intermediate. ...
Alpha Halogenation of Aldehydes and Ketones.
A particularly common α-substitution reaction in the laboratory is the halogenation of aldehydes and ketones at their α positions by reaction Cl2, Br2 or I2 in acidic solution. Bromine in acetic acid solvent is often used. ...
The halogenation is a typical α-substitution reaction that proceeds by acid catalyzed formation of an enol intermediate." [Carbonyl Alpha-Substitution Reactions. Wikipedia]
This example was redesigned from the Wikimedia Commons file: Halogenierung Mechanismus Version 3-Seite001.svg. [commons.wikimedia.org/ wiki/ File:Halogenierung_ Mechanismus_ Version_ 3-Seite001.svg]
This image is available under the Creative Commons Attribution-ShareAlike 3.0 Unported License. [creativecommons.org/ licenses/ by-sa/ 3.0/ ]
The chemical drawing example "Carbonyl compound halogenation mechanism" was created using the ConceptDraw PRO diagramming and vector drawing software extended with the Chemistry solution from the Science and Education area of ConceptDraw Solution Park.
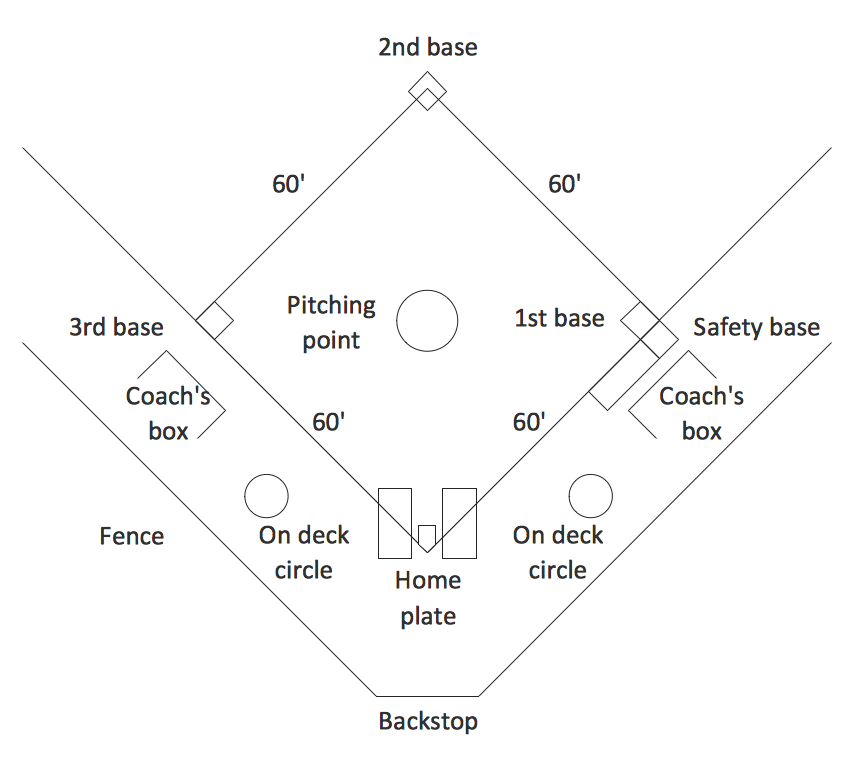
Simple Baseball Field — Sample
The Baseball solution for ConceptDraw DIAGRAM software contains a set of libraries, templates and samples allowing football specialists to draw baseball diagrams with ease. A set of predesigned fields and positions allows producing baseball diagrams without any drawing experience.- Symbolic Representation Of Sequence Diagrams
- How to Draw a Circular Arrows Diagram Using ConceptDraw PRO ...
- Example Idef0
- Circular Arrows Diagrams
- Circular Arrows Diagrams
- Idef0 Example
- UML Sequence Diagram Example . SVG Vectored UML Diagrams ...
- Flowchart Svg
- UML Sequence Diagram Example . SVG Vectored UML Diagrams ...
- UML Sequence Diagram Example . SVG Vectored UML Diagrams ...
- Sales arrows - Vector stencils library | HR arrows - Vector stencils ...
- Circle-Spoke Diagrams
- UML Sequence Diagram Example . SVG Vectored UML Diagrams ...
- Example Of Cycle Diagram
- BPM Software | Business Process Modeling Software for Mac ...
- UML Sequence Diagram Example . SVG Vectored UML Diagrams ...
- BPM life cycle | Sales Process Flowchart. Flowchart Examples | UML ...
- UML Use Case Diagram Example Registration System | UML ...
- Uml Sequence Diagram Symbols
- UML Sequence Diagram Example . SVG Vectored UML Diagrams ...
