Social Media Flowchart Symbols

How to Use the ″Online Store PR Campaign″ Sample

Create Organizational Chart

How to Present a Social Media Response Plan DFD to Your Team

Pyramid Chart Examples

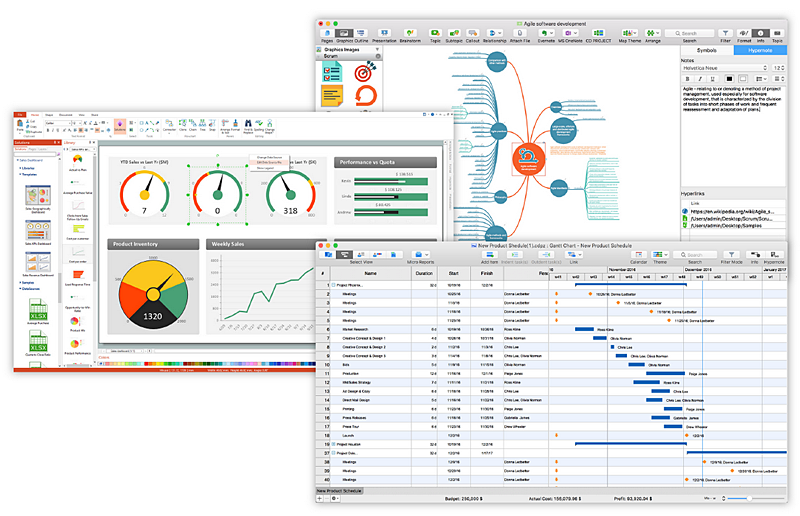
How To Use Collaboration Software

7 Management & Planning Tools

Manage Social Media Response Plan DFD

The vector stencils library "HR professions" contains 81 professions pictograms.
Use this HR icon set to draw your HR flowcharts, workflow diagrams, process charts and infographics with the ConceptDraw PRO diagramming and vector drawing software.
The HR pictograms library "HR professions" is included in the HR Flowcharts solution from the Management area of ConceptDraw Solution Park.
Accountant

Actor

Administrator

Announcer

Archaeologist

Architect

Artist

Baker

Banker

Bellboy

Biologist

Bookkeeper

Builder

Businessman

Businesswoman

Call center operator

Cameraman

Carpenter

Cashier

Chef

Chemist

Cleaner

Clerk

Consultant

Cook

Dentist

Director

Dispatcher

Diver

Doctor

Driver

Electrical engineer

Engineer

Environmental engineer

Farmer

Firefighter

Fisherman

Florist

Gardener

Graphic designer

Guide

Hairdresser

Lawyer

Librarian

Machine operator

Manager

Miner

Movie director

Musician

Nuclear engineer

Nurse

Pharmacist

Photographer

Pilot

Pizza delivery man

Policeman

Postman

Presenter

Programmer

Psychologist

Reporter

Sailor

Scientist

Secretary

Security guard

Security officer

Seller

Shop assistant

Soldier

Stewardess

Surgeon

System administrator

Systems engineer

Tailor

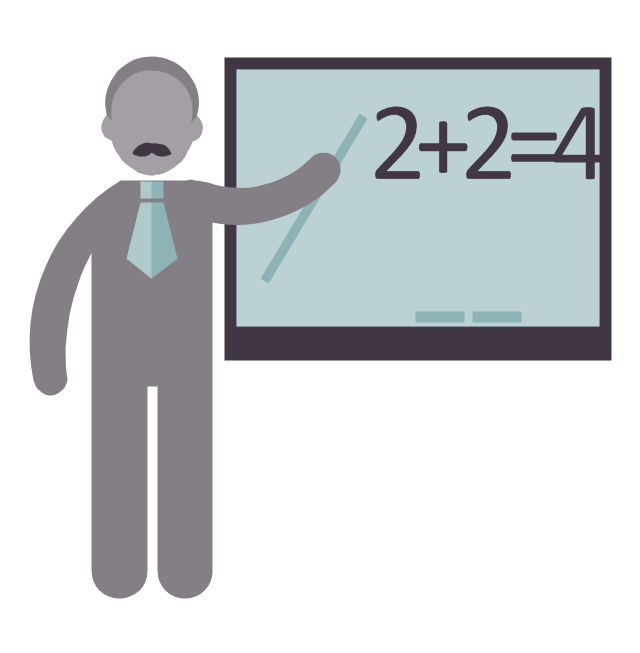
Teacher
Technical support representative

Waiter

Waitress

Watchman

Worker

Writer

How to Collaborate in Business via Skype
HelpDesk
How to Upgrade ConceptDraw OFFICE -3
Activity Network (PERT) Chart

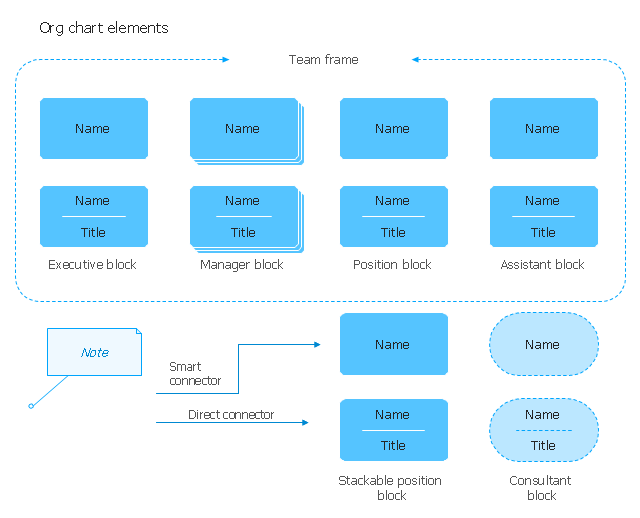
The vector stencils library "Organizational chart" contains 17 symbols for drawing organizational charts using the ConceptDraw PRO diagramming and vector drawing software.
"An organizational chart (often called organization chart, org chart, organigram(me), or organogram(me)) is a diagram that shows the structure of an organization and the relationships and relative ranks of its parts and positions/ jobs. The term is also used for similar diagrams, for example ones showing the different elements of a field of knowledge or a group of languages." [Organizational chart. Wikipedia]
The example "Design elements - Organizational chart" is included in the Organizational Charts solution from the Management area of ConceptDraw Solution Park.
Organizational chart elements
- Basic Flowchart Symbols and Meaning | Management Consultant ...
- Basic Flowchart Symbols and Meaning | ConceptDraw Arrows10 ...
- Management Consultant | Directions Maps | Maps Driving Directions ...
- Process Flow Diagram Symbols | HR professions - Vector stencils ...
- Basic Flowchart Symbols and Meaning | Flowchart design ...
- Basic Flowchart Symbols and Meaning | HR Flowchart Symbols ...
- Professions - Vector stencils library | Sales symbols - Vector stencils ...
- Flow Chart Symbols | Cross-Functional Flowchart | How To Create a ...
- Small business consultancy SWOT analysis matrix | How to Create ...
- Professions - Vector stencils library | Workflow diagrams - Vector ...
- Cross-Functional Flowchart (Swim Lanes) | Swim Lane Diagrams ...
- Electrical Cooker Symbol
- Sales Process Flowchart. Flowchart Examples | Sales Process ...
- Data Flow Diagram For Library Management System Ppt
- Polygon types | Mathematics Symbols | IDEF4 Standard | Types Of ...
- Land sales process flowchart | Basic Flowchart Symbols and ...
- DFD Library System | Data Flow Diagram Symbols . DFD Library ...
- DroidDia prime | Process Diagrams | Flow Chart Symbols | Drawing ...
- Consultant
- Process Flowchart | Basic Flowchart Symbols and Meaning ...