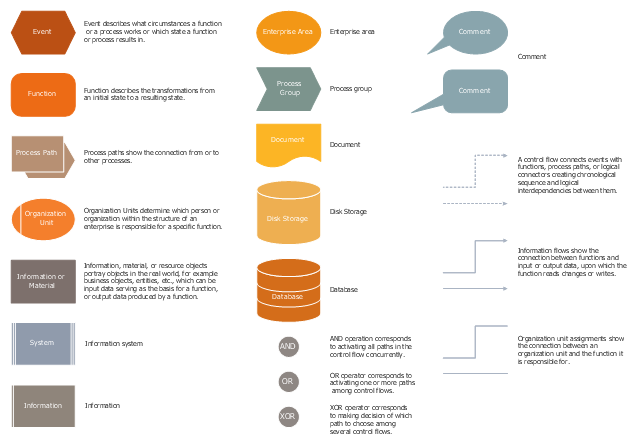
The vector stencils library "EPC diagrams" contains 23 symbol icons.
Use it to draw the event-driven process chain (EPC) flowcharts for business process modeling (BPM).
"... the elements used in Event-driven Process Chain diagram... :
(1) Event.
(2) Function.
(3) Process Owner.
(4) Organization unit.
(5) Information, material, or resource object.
(6) Logical connector.
(7) Logical relationships: Branch / Merge, Fork / Join, OR.
(8) Control flow.
(9) Information flow.
(10) Organization unit assignment.
(11) Process path. " [Event-driven process chain. Wikipedia]
The EPC symbols example "Design elements - EPC diagram" was created using the ConceptDraw PRO diagramming and vector drawing software extended with the Event-driven Process Chain Diagrams solution from the Business Processes area of ConceptDraw Solution Park.
The vector stencils library "HR symbols" contains 45 HR pictograms.
Use this icon set with HR symbols to draw your HR flowcharts, workflow diagrams, process charts and infographics with the ConceptDraw PRO diagramming and vector drawing software.
The HR pictograms library "HR symbols" is included in the HR Flowcharts solution from the Management area of ConceptDraw Solution Park.
HelpDesk
Event-driven Process Chain (EPC) Diagram Software
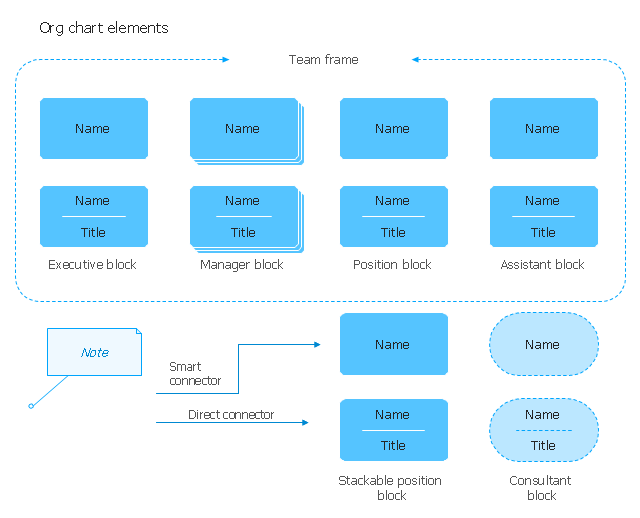
An EPC diagram is a type of flowchart used in business process analysis. It shows different business processes through various work flows. The workflows are shown as processes and events that are related to different executes and tasks that allow business workflow to be completed. An EPC diagram shows different business processes through various workflows. The workflows are seen as functions and events that are connected by different teams or people, as well as tasks that allow business processes to be executed. The best thing about this type of enterprise modelling is that creating an EPC diagram is quick and simple as long as you have the proper tool. One of the main usages of the EPC diagrams is in the modelling, analyzing and re-engineering of business processes. With the use of the flowchart, businesses are able to see inefficiencies in the processes and modify to make them more productive. Event-driven process chain diagrams are also used to configure an enterprise resource plaThe vector stencils library "Organizational chart" contains 17 symbols for drawing organizational charts using the ConceptDraw PRO diagramming and vector drawing software.
"An organizational chart (often called organization chart, org chart, organigram(me), or organogram(me)) is a diagram that shows the structure of an organization and the relationships and relative ranks of its parts and positions/ jobs. The term is also used for similar diagrams, for example ones showing the different elements of a field of knowledge or a group of languages." [Organizational chart. Wikipedia]
The example "Design elements - Organizational chart" is included in the Organizational Charts solution from the Management area of ConceptDraw Solution Park.
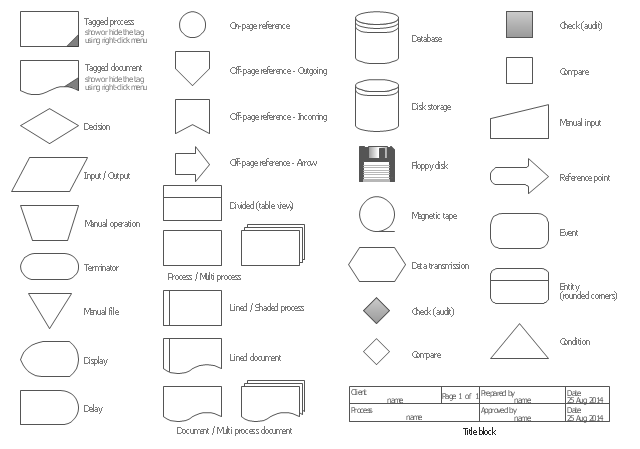
The vector stencils library "Audit flowcharts" contains 31 symbols of audit flow chart diagrams for accounting, financial management, fiscal information tracking, money management, decision flowcharts, and financial inventories.
"A financial audit, or more accurately, an audit of financial statements, is the verification of the financial statements of a legal entity, with a view to express an audit opinion. The audit opinion is intended to provide reasonable assurance, but not absolute assurance, that the financial statements are presented fairly, in all material respects, and/ or give a true and fair view in accordance with the financial reporting framework. The purpose of an audit is to provide an objective independent examination of the financial statements, which increases the value and credibility of the financial statements produced by management, thus increase user confidence in the financial statement, reduce investor risk and consequently reduce the cost of capital of the preparer of the financial statements. ...
Financial audits are typically performed by firms of practicing accountants who are experts in financial reporting. The financial audit is one of many assurance functions provided by accounting firms. Many organizations separately employ or hire internal auditors, who do not attest to financial reports but focus mainly on the internal controls of the organization. External auditors may choose to place limited reliance on the work of internal auditors. Auditing promotes transparency and accuracy in the financial disclosures made by an organization, therefore would likely to reduce of such corporations to conceal unscrupulous dealings.
Internationally, the International Standards on Auditing (ISA) issued by the International Auditing and Assurance Standards Board (IAASB) is considered as the benchmark for audit process. Almost all jurisdictions require auditors to follow the ISA or a local variation of the ISA." [Financial audit. Wikipedia]
The example "Design elements - Audit flowchart" was created using the ConceptDraw PRO diagramming and vector drawing software extended with the Audit Flowcharts solution from the Finance and Accounting area of ConceptDraw Solution Park.
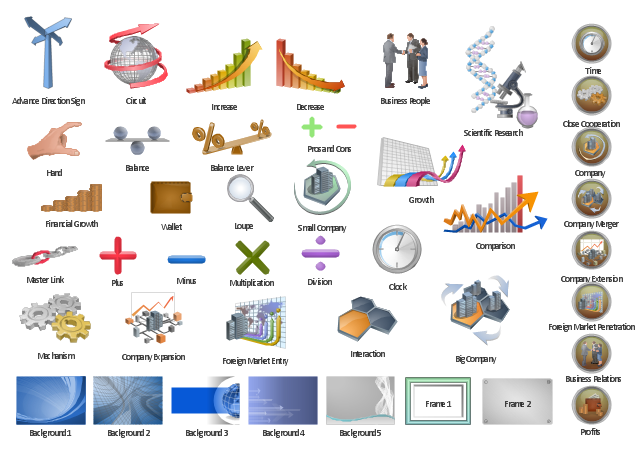
The vector clipart library "Presentation" design elements contains 45 symbols you can use to design your presentation slides and illustrations using the ConceptDraw PRO diagramming and vector drawing software.
"Although some think of presentations in a business meeting context, there are often occasions when that is not the case. For example, a non-profit organization presents the need for a capital fund-raising campaign to benefit the victims of a recent tragedy; a school district superintendent presents a program to parents about the introduction of foreign-language instruction in the elementary schools;an artist demonstrates decorative painting techniques to a group of interior designers; a horticulturist shows garden club members or homeowners how they might use native plants in the suburban landscape; a police officer addresses a neighborhood association about initiating a safety program. ...
A study done by Wharton School Of Business showed that the use of visuals reduced meeting times by 28 percent. Another study found that audiences believe presenters who use visuals are more professional and credible than presenters who merely speak. Other research indicates that meetings and presentations reinforced with visuals help participants reach decisions and consensus more quickly." [Presentation. Wikipedia]
The clip art example "Design elements - Presentation symbols" is included in the Presentation Clipart solution from the Illustration area of ConceptDraw Solution Park.
HelpDesk
How to Draw an Organizational Chart Using ConceptDraw PRO
The organizational chart software is a valuable tool for modern business. It is important for any business to build a clear organizational structure that determines the responsibilities and relationships between different positions in the organization. The clear structured organization - means the clear structured business workflow, which is the core of success in the business. ConceptDraw PRO is an org chart software that allows you to draw an organizational structure of your company quickly and easily.- Organizational Chart Symbols
- Vertical Organization Flow Char
- Process Flowchart | Basic Flowchart Symbols and Meaning ...
- Basic Flowchart Symbols and Meaning | How to Draw an ...
- Basic Flowchart Symbols and Meaning | ConceptDraw Solution Park ...
- Organization Chart Symbols
- ConceptDraw PRO - Organizational chart software | Business ...
- Basic Flowchart Symbols and Meaning | Flowchart design ...
- Pyramid Diagram | Flowchart Symbols Accounting. Activity-based ...
- Flowchart design. Flowchart symbols , shapes, stencils and icons ...
- The Action Plan | Organizational Charts with ConceptDraw PRO ...
- Flowchart design. Flowchart symbols , shapes, stencils and icons ...
- Process Flowchart | Basic Flowchart Symbols and Meaning | Types ...
- Basic Flowchart Symbols and Meaning | Flowchart design ...
- Marketing and Sales Organization chart. Organization chart Example
- Organizational Structure | Process Flowchart | Basic Flowchart ...
- HR symbols - Vector stencils library
- Flowchart design. Flowchart symbols , shapes, stencils and icons ...
- Accounting Flowcharts | How to Create Flowcharts for an Accounting ...
- Organizational Structure | ConceptDraw PRO - Organizational chart ...
