 Value Stream Mapping
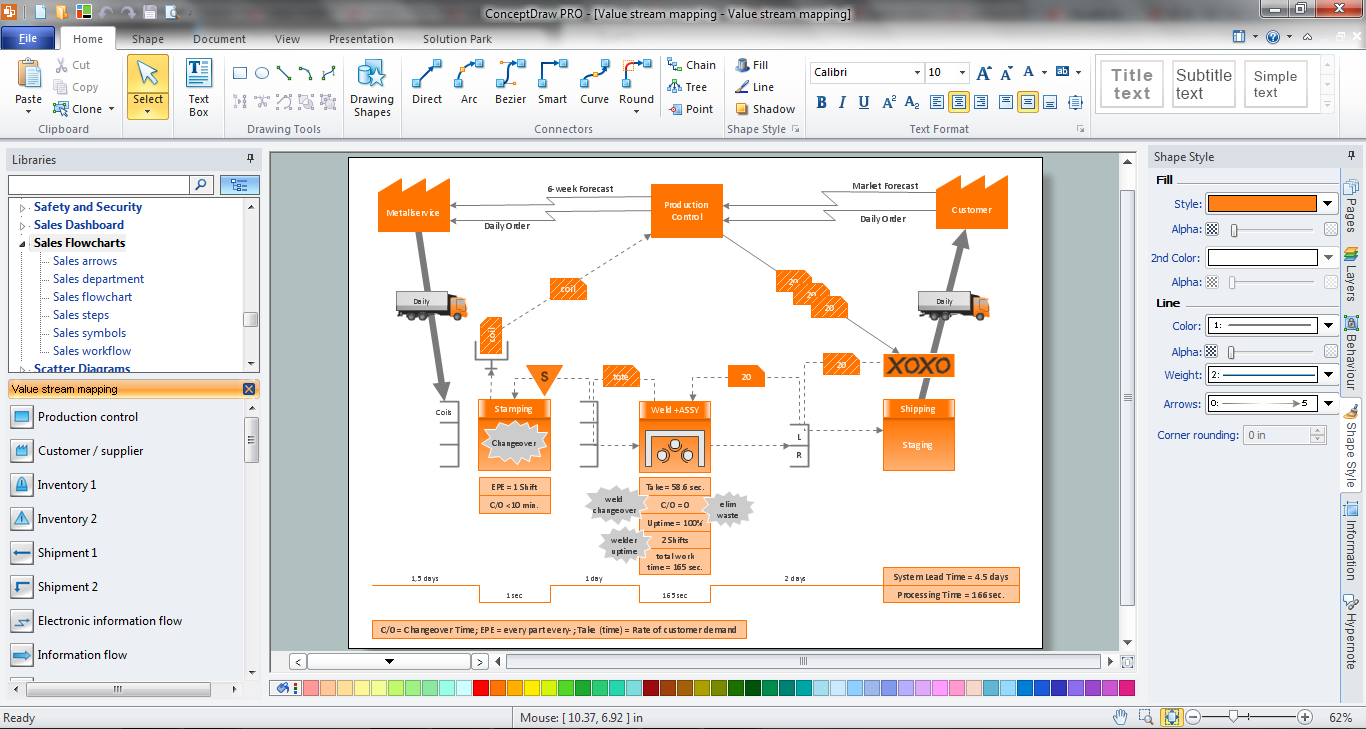
Value stream mapping solution extends ConceptDraw PRO software with templates, samples and vector stencils for drawing the Value Stream Maps (VSM) in lean manufacturing practice.
Value Stream Mapping Symbols
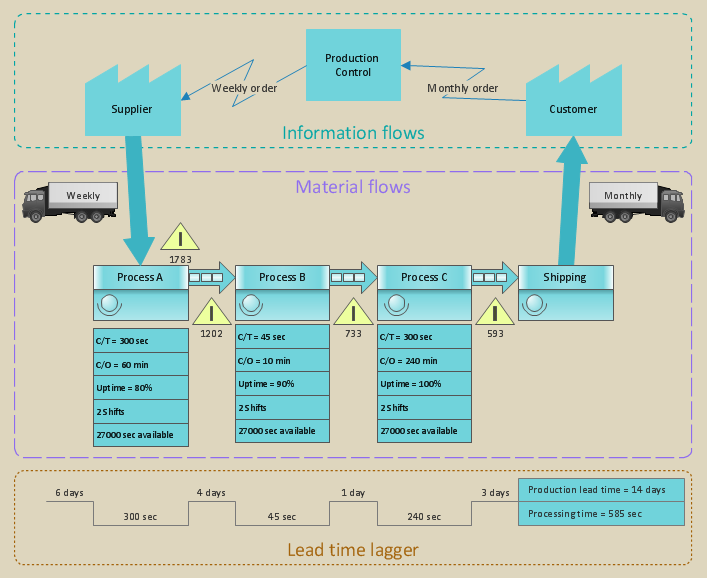
VSM symbols are the best for a production process designing. The entire Value Stream Mapping method uses a graphical representation of the manufacturing process, factors' pros and cons, that all stakeholders can easily understand. Value Stream Mapping is a graphical technique that provides possibilities to improve analysis of a manufacturing process, at the stage of the transferring information or materials that required to deliver a product or service to the customer.Value Stream Mapping Template
Use ConceptDraw PRO extended with Value Stream Mapping solution for document processes with professional designed Value Stream Mapping template.Value Stream Mapping Examples
ConceptDraw PRO diagramming and vector drawing software supplied with Value Stream Mapping solution from the Quality area of ConceptDraw Solution Park is ideal for drawing Value Stream Maps and includes variety of value stream mapping examples.Value Stream Mapping
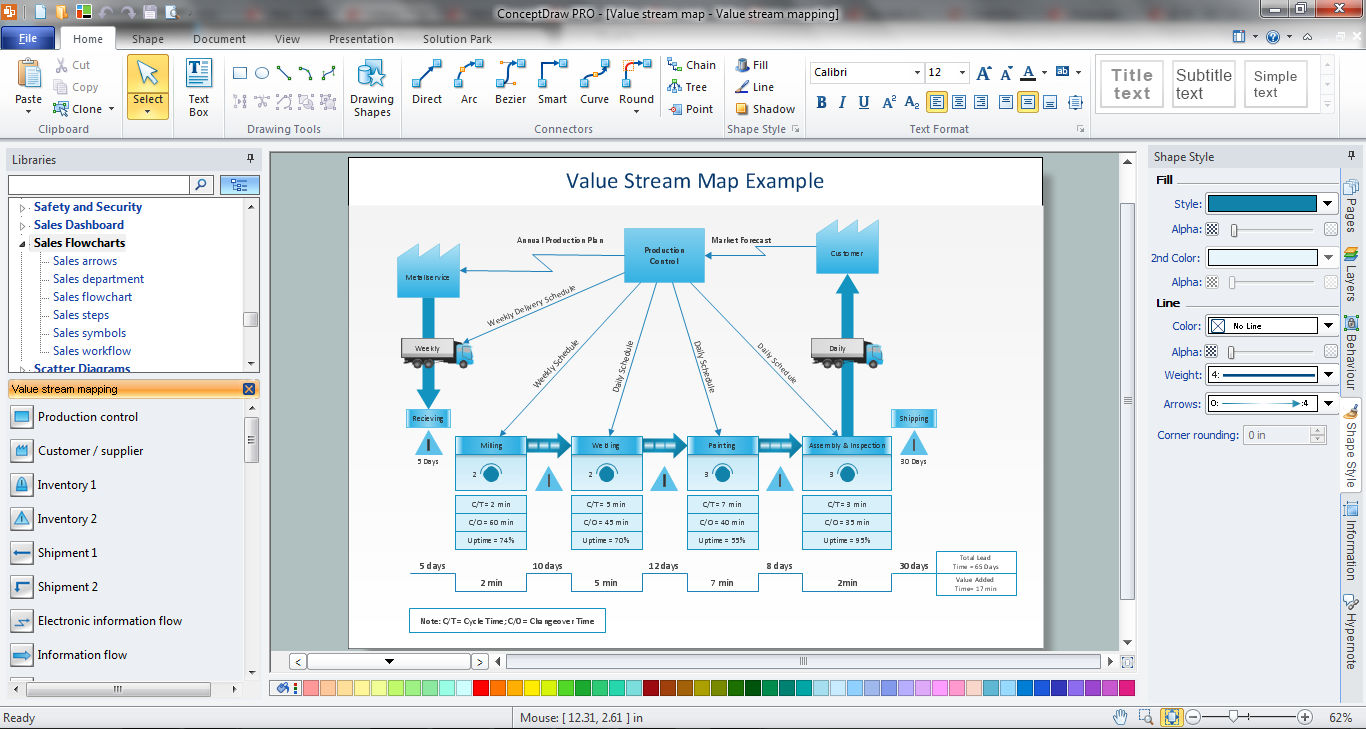
Use ConceptDraw Value Stream Maps (VSM) visualization for a manufacturing plant the material and information flow required to deliver a product/service to customers. The new Value Stream Mapping solution found in the ConceptDraw Solution Park continues to extend the range of ConceptDraw PRO into a business graphics tool that can be used to document processes in any organization.Value Stream Map
ConceptDraw PRO diagramming and vector drawing software offers a powerful Value Stream Mapping solution from the Quality area of ConceptDraw Solution Park which contains a set of useful tools for easy drawing Value Stream Map of any complexity.Value Stream Mapping Software
ConceptDraw PRO is a best Value Stream Mapping software. The graphical representation of a process is a powerful tool that helps in the diagnosis of process efficiency and allows companies to develop improved processes. The new Value Stream Mapping solution found in the ConceptDraw Solution Park continues to extend the range of ConceptDraw PRO into a business graphics tool that can be used to document processes in any organization.VSM
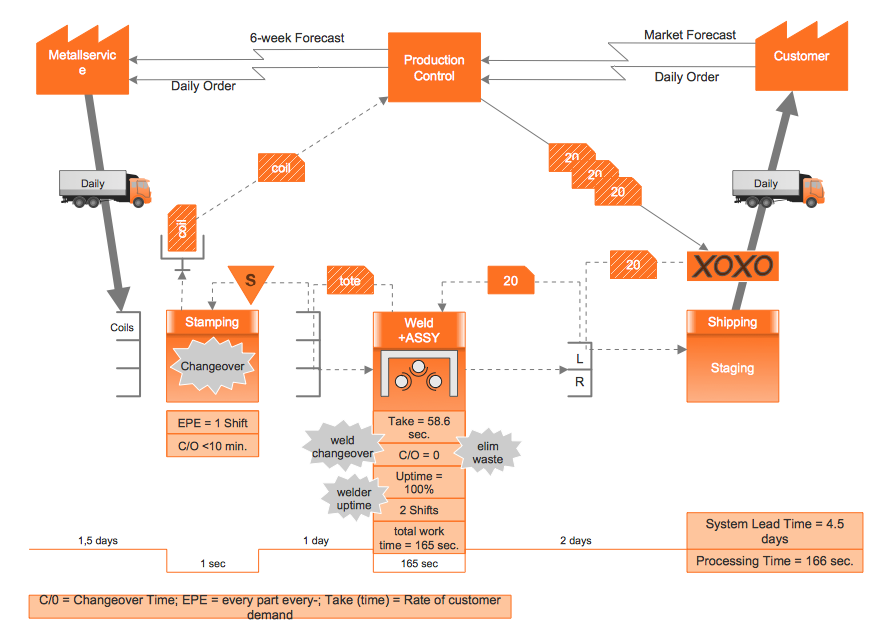
Value stream mapping is a lean-management method for analyzing the current state and designing a future state for the series of events that take a product or service from its beginning through to the customer. ConceptDraw PRO diagramming and vector drawing software extended with Value Stream Mapping solution from the Quality area of ConceptDraw Solution Park is effective for implementation a value stream mapping (VSM) process and for creating Value Stream Maps.
 ConceptDraw Solution Park
ConceptDraw Solution Park collects graphic extensions, examples and learning materials
HelpDesk
How to Create a VSM Diagram Using ConceptDraw Value Stream Mapping Solution
Value Stream Mapping is a Lean Manufacturing tool that uses a flow diagram to document in great detail every step of a manufacturing process. This graphical representation of a process is a powerful tool that helps in the diagnosis of process efficiency and allows companies to develop improved processes. Many lean practitioners use Value Stream Mapping as a fundamental tool to identify waste, cut process cycle times, and implement process improvement. Many organizations use value stream mapping as a key portion of their lean efforts. Value Stream Maps are used to analyze and design the flow of materials and information required to bring a product or service to a consumer. You can create a Value Stream Mapping flowchart using ConceptDraw PRO tools.
 Seven Basic Tools of Quality
Manage quality control in the workplace, using fishbone diagrams, flowcharts, Pareto charts and histograms, provided by the Seven Basic Tools of Quality solution.
 Seven Management and Planning Tools
Seven Management and Planning Tools solution extends ConceptDraw PRO and ConceptDraw MINDMAP with features, templates, samples and libraries of vector stencils for drawing management mind maps and diagrams.
Seven Basic Tools of Quality - Histogram
A histogram is a chart which visually displays a distribution of numerical data.ConceptDraw PRO diagramming and vector drawing software offers a powerful Seven Basic Tools of Quality solution from the Quality area of ConceptDraw Solution Park which contains a set of useful tools for easy drawing Histogram and other quality related diagrams of any complexity.
- Fundamental Tool in Quality Management | Seven Basic Tools of ...
- Value - Stream Mapping for Manufacturing | Business Productivity ...
- Seven Management and Planning Tools | Seven Management and ...
- TQM Diagram Tool | Quality Control Chart Software — ISO ...
- Seven Basic Tools of Quality | Seven Basic Tools of Quality - Quality ...
- Basic Flowchart Symbols and Meaning | Quality Control | Value ...
- Process Flowchart | Basic Flowchart Symbols and Meaning | Basic ...
- Cause and Effect Analysis | Root cause analysis tree diagram ...
- Quality Engineering Diagrams | Seven Management and Planning ...
- Tqm Seven New Tools Of Quality
- Value Stream Mapping
- Value Stream Mapping Icons
- Process Flowchart | Value Stream Mapping Symbols | Workflow ...
- Lean Manufacturing Diagrams | Lean Value Stream Map | Lean ...
- Fishbone Diagram | Manufacturing and Maintenance | Value Stream ...
- Lean Value Stream Map
- PROBLEM ANALYSIS. Identify and Structure Factors | Seven ...
- Timeline Diagrams | Value stream map example | Business ...
- Manufacturing 8 Ms fishbone diagram - Template | Manufacturing ...
- Seven Management and Planning Tools | Sample Project Flowchart ...


