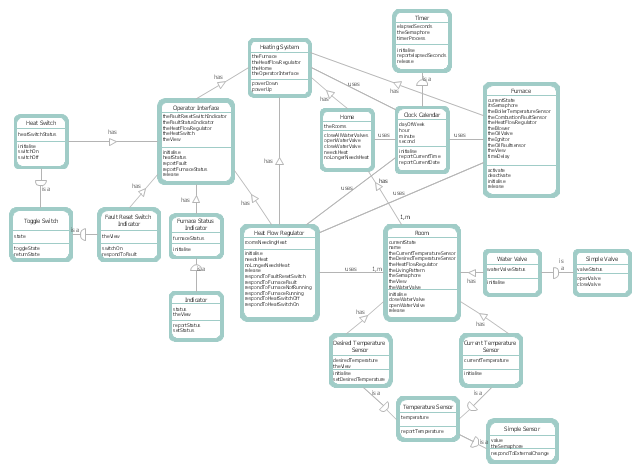
This DFD sample was created on the base of the figure illustrating "A Survey of Object-Oriented Methods" by Peter Biggs from University of Durham.
[students.cs.byu.edu/ ~pbiggs/ images/ coadsys.gif]
"Object-oriented analysis and design (OOAD) is a popular technical approach to analyzing, designing an application, system, or business by applying the object-oriented paradigm and visual modeling throughout the development life cycles to foster better stakeholder communication and product quality.
According to the popular guide Unified Process, OOAD in modern software engineering is best conducted in an iterative and incremental way. Iteration by iteration, the outputs of OOAD activities, analysis models for OOA and design models for OOD respectively, will be refined and evolve continuously driven by key factors like risks and business values." [Object-oriented analysis and design. Wikipedia]
The DFD example "Coad/ Yourdon's Object-Oriented Analysis model" was created using the ConceptDraw PRO diagramming and vector drawing software extended with the Data Flow Diagrams solution from the Software Development area of ConceptDraw Solution Park.
HelpDesk
Accounting Information Systems Flowchart Symbols
Accounting Information system is a combination of software and hardware, as well as organizational support. Information system - it is not only the software and computers with network equipment, but also a list of instructions and standards which can be notated using Accounting information systems flowchart symbols. All information systems can be divided into information retrieval and data processing systems. Data Flow model is a hierarchical model. Each process can be divided into structural components, that depict by corresponding flowchart symbols, showing the accounting information system in communication with the external environment. The major components of accounting information systems flowchart are: entities, processes, data stores, and data flows. The set of standard accounting information flowchart symbols is intended to show the relationships between the system components. ConceptDraw PRO can help to draw clear accounting information system diagrams using special flowchart symbols.HelpDesk
How to Create a Data Flow Diagram using ConceptDraw PRO
Data flow diagramming is a highly effective technique for showing the flow of information through a system. Data flow diagrams reveal relationships among and between the various components in a program or system. DFD is an important technique for modeling a system’s high-level detail by showing how input data is transformed to output results through a sequence of functional transformations. The set of standard symbols is used to depict how these components interact in a system. ConceptDraw PRO allows you to draw a simple and clear Data Flow Diagram using special libraries.
 Circular Arrows Diagrams
Circular Arrows Diagrams solution extends ConceptDraw PRO v10 with extensive drawing tools, predesigned samples, Circular flow diagram template for quick start, and a library of ready circular arrow vector stencils for drawing Circular Arrow Diagrams, Segmented Cycle Diagrams, and Circular Flow Diagrams. The elements in this solution help managers, analysts, business advisers, marketing experts, scientists, lecturers, and other knowledge workers in their daily work.
 ConceptDraw Solution Park
ConceptDraw Solution Park collects graphic extensions, examples and learning materials
 IDEF0 Diagrams
IDEF0 Diagrams visualize system models using the Integration Definition for Function Modeling (IDEF) methodology. Use them for analysis, development and integration of information and software systems, and business process modelling.
- What Is The Use Of System Fow Charts In System Development Cycle
- Circular arrows diagram - SDLC
- System Development Life Cycle
- Accounting Flowcharts | How to Make an Accounting Process ...
- Data Flow Diagram | Collaboration life- cycle - Circular arrow ...
- Data Flow Diagram ( DFD ) | DFD - Process of account receivable ...
- Stages Of A Ssadm Model In System Development Diagram
- Structured Systems Analysis and Design Method (SSADM) with ...
- Data Flow Diagrams ( DFD ) | DFD Library System | Process ...
- DFD Library System | Data Flow Diagrams ( DFD ) | Software and ...
- Structured Systems Analysis and Design Method (SSADM) with ...
- Development Information System Solutions With Diagram
- Data Flow Diagrams ( DFD ) | DFD Library System | Process ...
- Workflow Diagram | Account Flowchart Stockbridge System ...
- Draw Accounting Dfd
- Data Flow Diagrams ( DFD ) | DFD Library System | Process ...
- Yourdon and Coad Diagram | DFD , Yourdon and Coad notation ...
- Process Flowchart | Data Flow Diagram Software | Data Flow ...
- Software development with ConceptDraw Products | Venn diagram ...
- Data Flow Diagrams ( DFD ) | DFD Library System | Software and ...


