UML Activity Diagram. Design Elements


UML Diagram for Mac

UML State Machine Diagram.Design Elements

Diagramming Software for Design UML Activity Diagrams

UML Notation

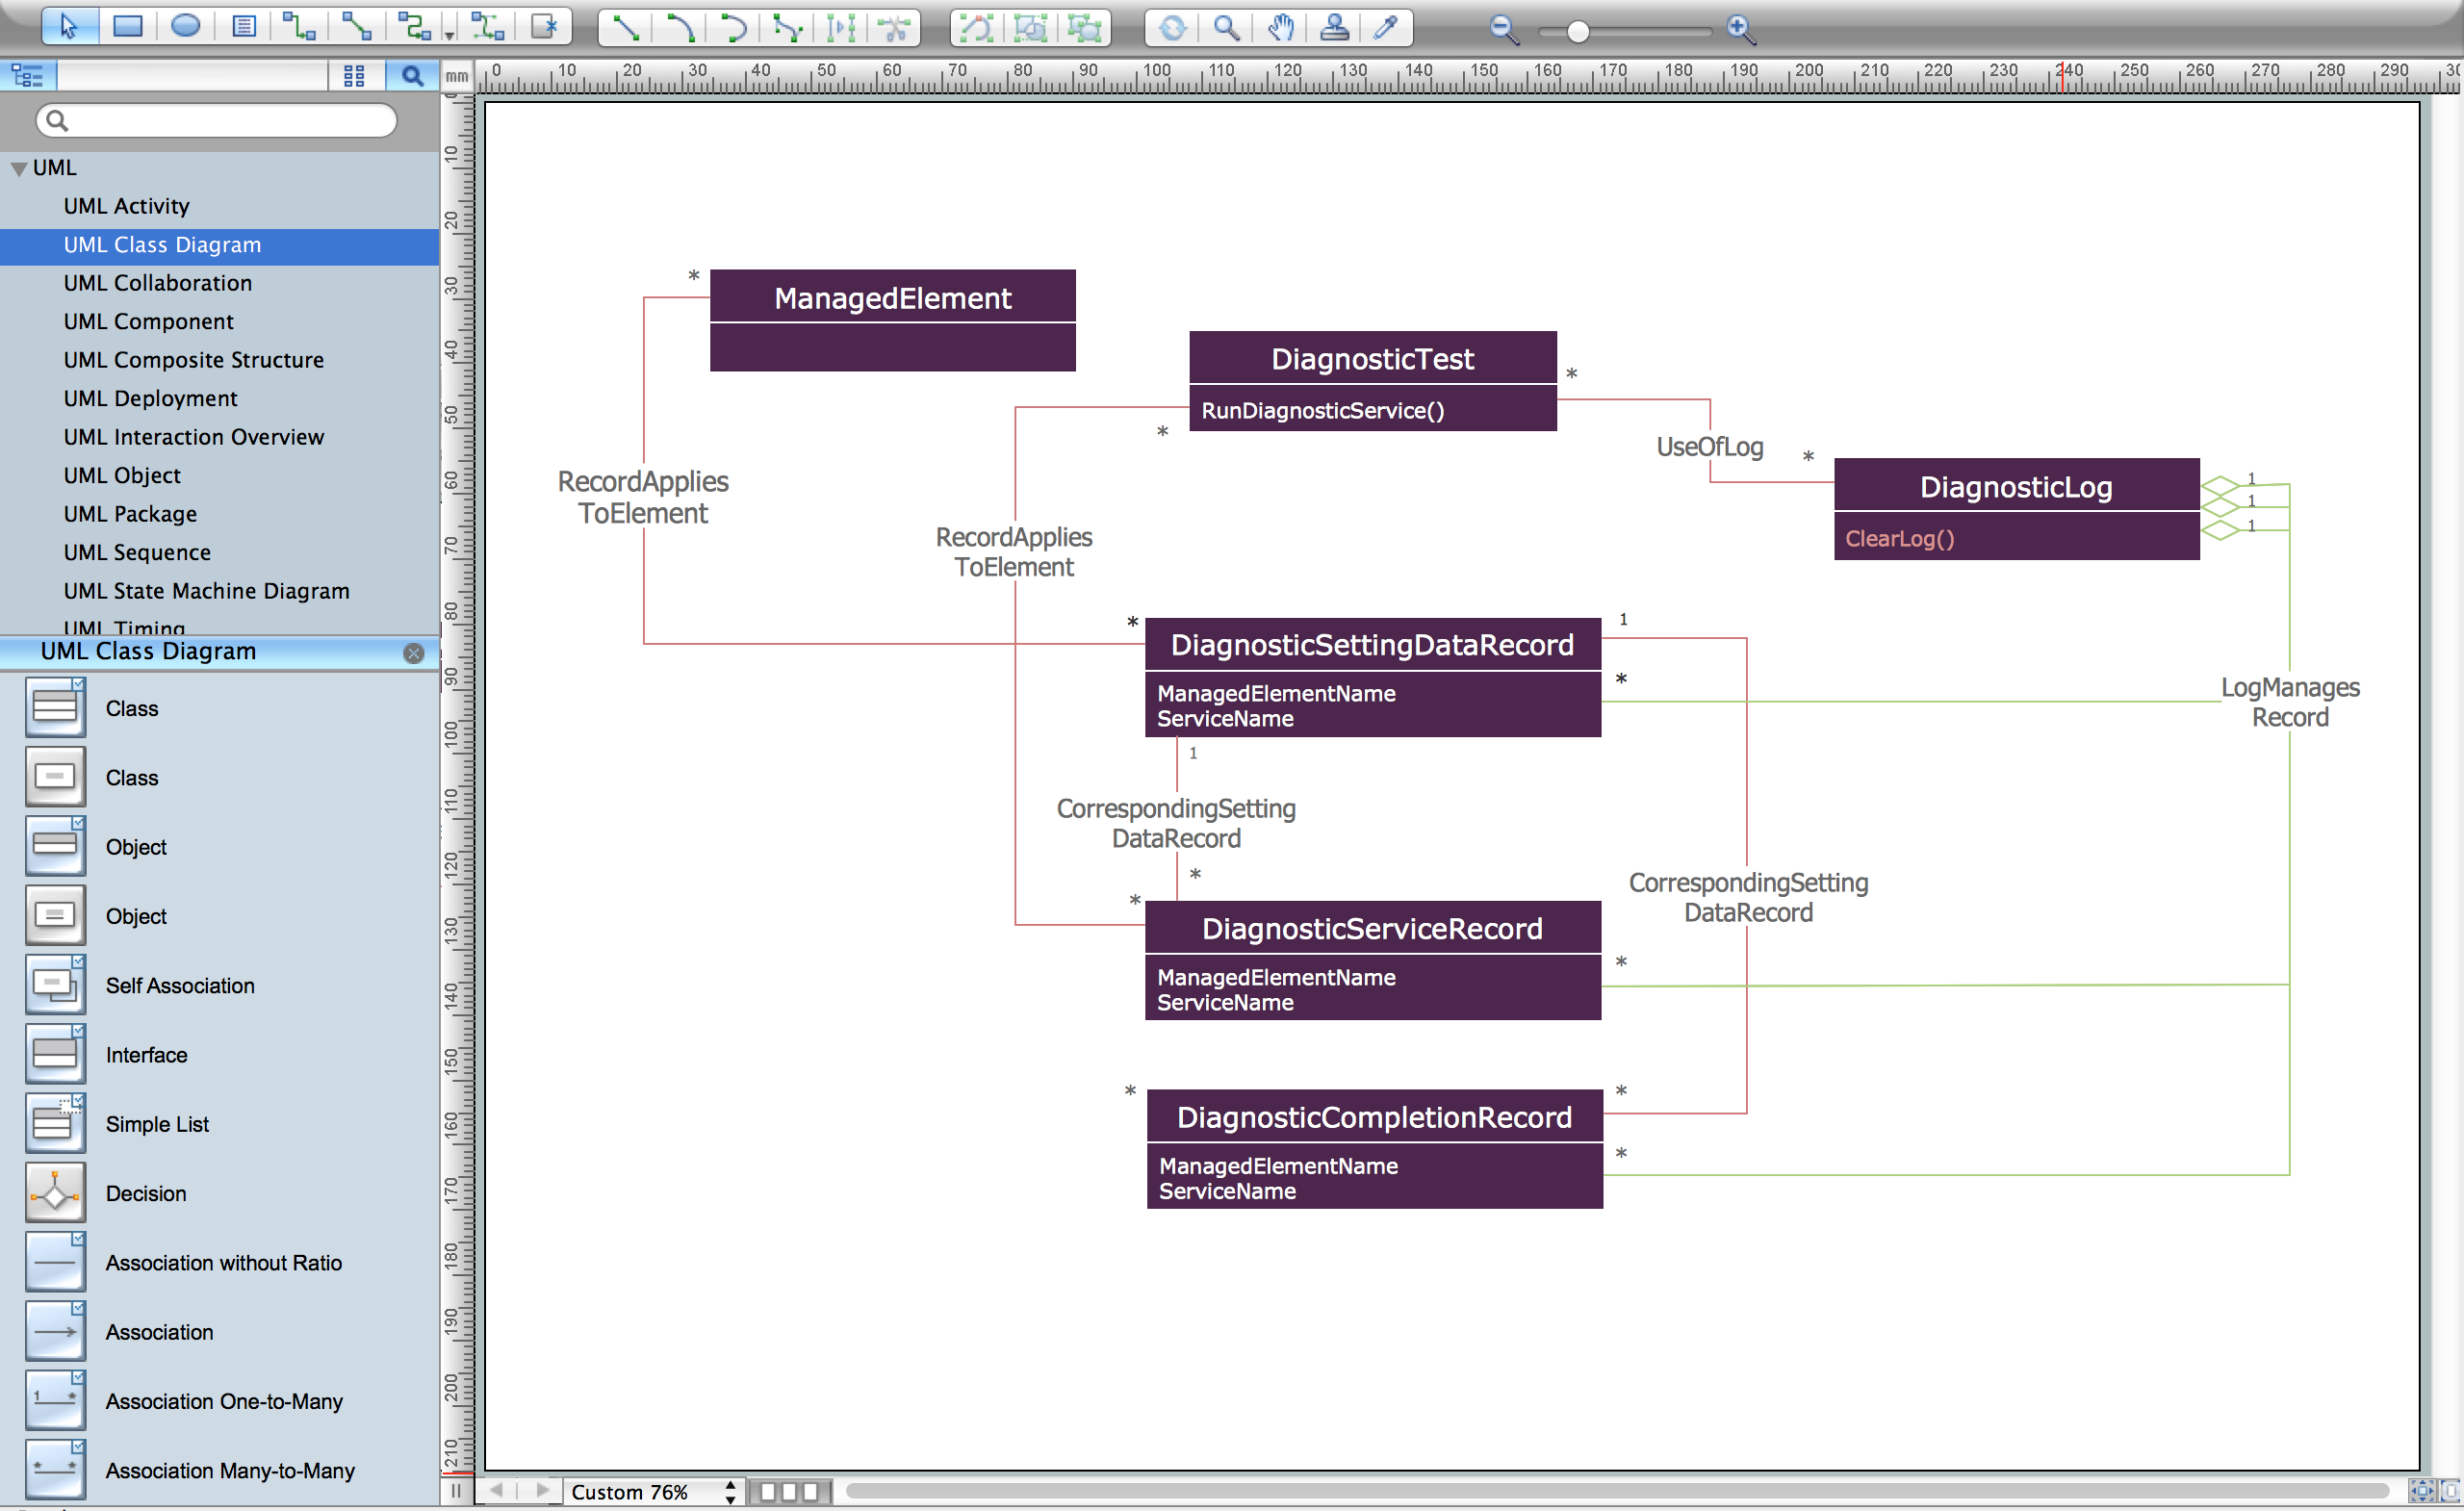
UML Class Diagram Constructor
UML Activity Diagram

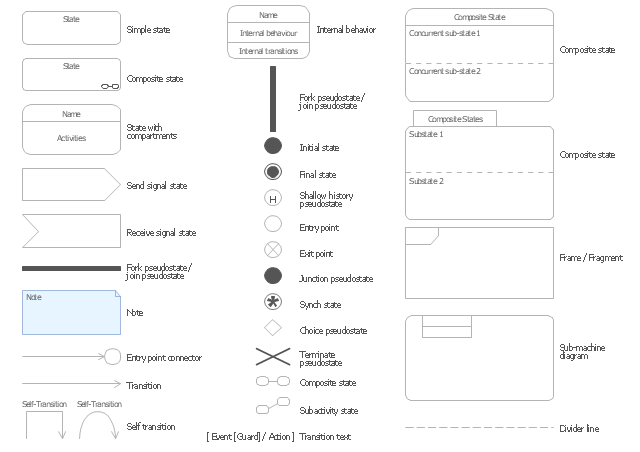
The vector stencils library "UML state machine diagrams" contains 35 symbols for the ConceptDraw PRO diagramming and vector drawing software.
"The state diagram in the Unified Modeling Language is essentially a Harel statechart with standardized notation, which can describe many systems, from computer programs to business processes. In UML 2 the name has been changed to State Machine Diagram. The following are the basic notational elements that can be used to make up a diagram:
(1) Filled circle, pointing to the initial state.
(2) Hollow circle containing a smaller filled circle, indicating the final state (if any).
(3) Rounded rectangle, denoting a state. Top of the rectangle contains a name of the state. Can contain a horizontal line in the middle, below which the activities that are done in that state are indicated.
(4) Arrow, denoting transition. The name of the event (if any) causing this transition labels the arrow body. A guard expression may be added before a "/ " and enclosed in square-brackets ( eventName[guardExpression] ), denoting that this expression must be true for the transition to take place. If an action is performed during this transition, it is added to the label following a "/ " ( eventName[guardExpression]/ action ).
(5) Thick horizontal line with either x>1 lines entering and 1 line leaving or 1 line entering and x>1 lines leaving. These denote join/ fork, respectively." [State diagram (UML). Wikipedia]
The example "Design elements - UML state machine diagrams" is included in the Rapid UML solution from the Software Development area of ConceptDraw Solution Park.
UML state machine diagram symbols
HelpDesk
How to Draw a Circle-Spoke Diagram

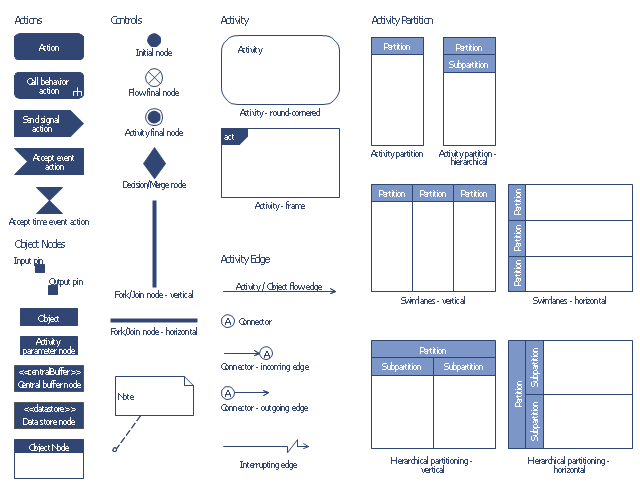
The vector stencils library "Bank UML activity diagram" contains 32 shapes of UML activity diagram.
Use it for object-oriented modeling of your bank information system.
"Activity diagrams are constructed from a limited number of shapes, connected with arrows. The most important shape types:
* rounded rectangles represent actions;
* diamonds represent decisions;
* bars represent the start (split) or end (join) of concurrent activities;
* a black circle represents the start (initial state) of the workflow;
* an encircled black circle represents the end (final state).
Arrows run from the start towards the end and represent the order in which activities happen.
Activity diagrams may be regarded as a form of flowchart. Typical flowchart techniques lack constructs for expressing concurrency. However, the join and split symbols in activity diagrams only resolve this for simple cases; the meaning of the model is not clear when they are arbitrarily combined with decisions or loops.
While in UML 1.x, activity diagrams were a specialized form of state diagrams, in UML 2.x, the activity diagrams were reformalized to be based on Petri net-like semantics, increasing the scope of situations that can be modeled using activity diagrams. These changes cause many UML 1.x activity diagrams to be interpreted differently in UML 2.x." [Activity diagram. Wikipedia]
This example of UML activity diagram symbols for the ConceptDraw PRO diagramming and vector drawing software is included in the ATM UML Diagrams solution from the Software Development area of ConceptDraw Solution Park.
UML activity diagram symbols
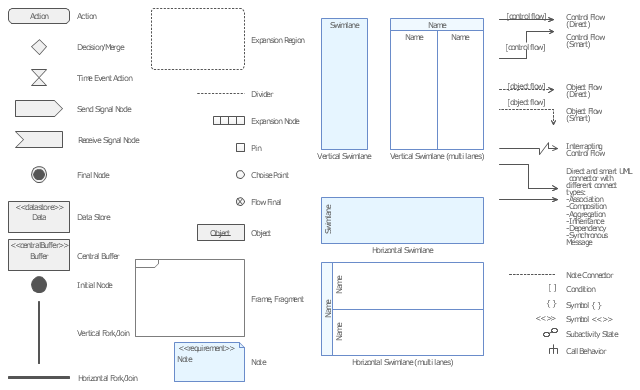
The vector stencils library "UML activity diagrams" contains 37 symbols for the ConceptDraw PRO diagramming and vector drawing software.
"Activity diagrams are constructed from a limited number of shapes, connected with arrows. The most important shape types:
(1) rounded rectangles represent actions;
(2) diamonds represent decisions;
(3) bars represent the start (split) or end (join) of concurrent activities;
(4) a black circle represents the start (initial state) of the workflow;
(5) an encircled black circle represents the end (final state).
Arrows run from the start towards the end and represent the order in which activities happen.
Hence they can be regarded as a form of flowchart. Typical flowchart techniques lack constructs for expressing concurrency. However, the join and split symbols in activity diagrams only resolve this for simple cases; the meaning of the model is not clear when they are arbitrarily combined with decisions or loops." [Activity diagram. Wikipedia]
The example "Design elements - UML activity diagrams" is included in the Rapid UML solution from the Software Development area of ConceptDraw Solution Park.
UML activity diagram symbols
HelpDesk
How to Create a Timeline Diagram

HelpDesk
How To Convert a Circle-Spoke Diagram to Adobe PDF
 Rapid UML
Rapid UML solution extends ConceptDraw DIAGRAM software with templates, samples and libraries of vector stencils for quick drawing the UML diagrams using Rapid Draw technology.
HelpDesk
How to Add a Circle-spoke Diagram to PowerPoint

- UML Class Diagram Constructor | Circle -Spoke Diagrams | UML ...
- What Is a Circle Spoke Diagram | UML Diagram | What is a Diagram ...
- Circle -Spoke Diagrams | UML Class Diagram Constructor | 3 Circle ...
- Basic Flowchart Symbols and Meaning | Circle Spoke Diagram ...
- What Is a Circle Spoke Diagram | UML Diagram | Network Diagram ...
- Concentric Circle Graph Uml
- Pyramid Charts | UML Sample Project | Circle -Spoke Diagrams ...
- Research cycle - Circle diagram | 3 Circle Venn Diagram. Venn ...
- Types of Flowcharts | 2 Circle Venn Diagram. Venn Diagram ...
- UML Sequence Diagram | UML Activity Diagram | Circle Spoke ...
- Design elements - Numbers | UML Class Diagram Constructor | How ...
- Circle Spoke Diagram Template | Best Diagramming | Pie Chart ...
- Circle Diagrams | UML Activity Diagram. Design Elements | Basic ...
- What Is a Circle Spoke Diagram | Financial Trade UML Use Case ...
- Circle -Spoke Diagrams | Fishbone Diagram Procedure | HR ...
- Divided Bar Diagrams | Basic Circle -Spoke Diagrams | Stakeholder ...
- Hiring process workflow | Automated payroll management system ...
- Best Diagramming | Circle Spoke Diagram Template | What Is a ...
- Circle Spoke Diagram Template | Basic Flowchart Symbols and ...