Diagram Software - The Best Choice for Diagramming
For vector shapes and connector tools for quick and easy drawing diagrams for business, technology, science and education - The best choice for Diagramming is ConceptDraw PRO.The vector stencils library "Transport map" contains 96 pictograms for drawing transport maps.
Use it in your spatial infographics for visual representation of transport schemes and plans as metro maps in the ConceptDraw PRO diagramming and vector drawing software extended with the Spatial Infographics solution from the area "What is Infographics" of ConceptDraw Solution Park.
Use it in your spatial infographics for visual representation of transport schemes and plans as metro maps in the ConceptDraw PRO diagramming and vector drawing software extended with the Spatial Infographics solution from the area "What is Infographics" of ConceptDraw Solution Park.
HelpDesk
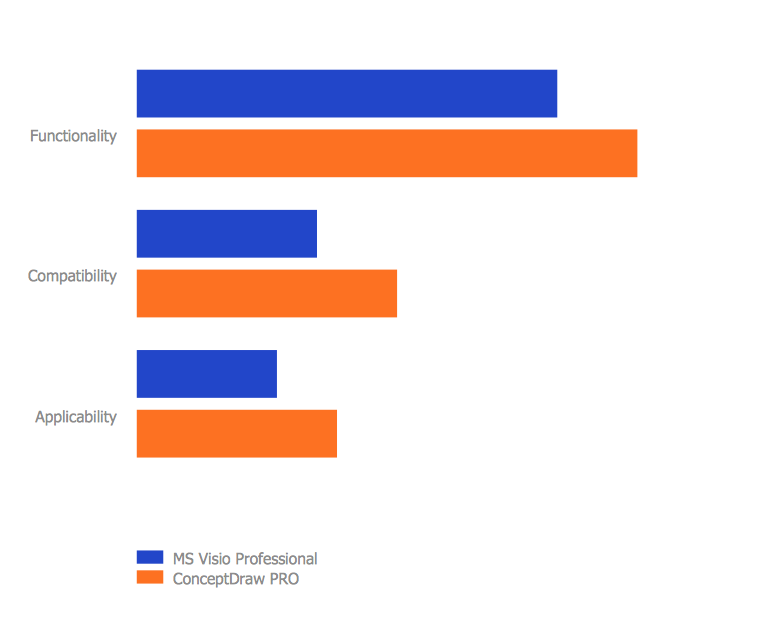
Replace Your Current Diagramming Tool
Migrate from Visio to ConceptDraw for the entire organization at super low price. By means of a ConceptDraw PRO Site License any employer in your company can get advantages of ConceptDraw PRO in just a $ 2995 per year. There is no need to count both licenses and users. Every co-worker in your organization will get permission to access at no extra charge. At half-price of Microsoft Visio®, you can supply your company with a ConceptDraw Site License. Reduced price and effortless administrating are just a couple of the causes to change Visio to ConceptDraw PRO. Here are just a few reasons.This SWOT matrix diagram example was created on the base of article "An Easy Way To Jumpstart Your Strategic Plan: SWOT" by Leslie Wolf from the website of the California Digital Library, the University of California. "Strategic planning doesn’t have to be a daunting and lengthy process. The goal is really a simple one: to help you understand your world and build a road map to guide your efforts. ...
This analysis tool can help you focus your attention on the specific success factors that are right for your team.
The tool is called a SWOT analysis. SWOT stands for Strengths and Weaknesses, Opportunities and Threats. Here’s what it means:
(1) Strengths are those positive internal attributes that strengthen your business or team. You can develop plans to capitalize on those strengths.
(2) Weaknesses are those negative internal attributes that are working against your success. You can shore up those weaknesses so they don’t stop your success.
(3) Opportunities are those external conditions that can have a positive effect on your goals. These opportunities can point you in the right direction.
(4) Threats are those external conditions that can have a negative effect on your goals. These threats will affect you less if you can identify and minimize them. ...
We thought it would be helpful to show you a sample SWOT analysis for a business you can easily visualize: a small independent bookstore in a university town. The store owner brought the team together to think about how the bookstore could survive during the continuing financial downturn. After an hour of brainstorming, this is the SWOT analysis they developed." [cdlib.org/ cdlinfo/ 2010/ 09/ 29/ an-easy-way-to-jumpstart-your-strategic-plan-swot/ ]
The matrix diagram example "SWOT analysis for a small independent bookstore" was created using the ConceptDraw PRO diagramming and vector drawing software extended with the SWOT Analysis solution from the Management area of ConceptDraw Solution Park.
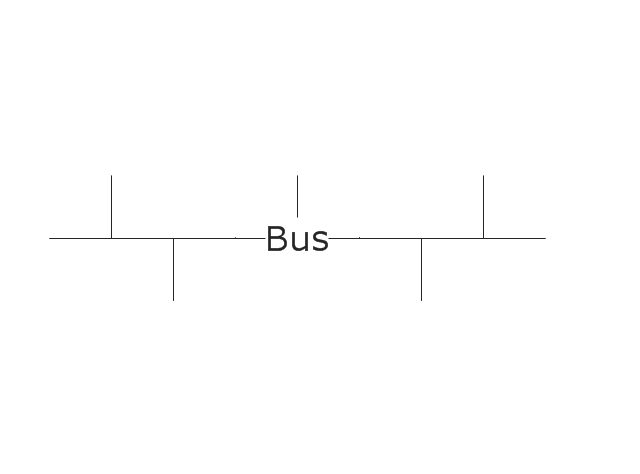
The vector stencils library "Logical symbols" contains 49 logical symbols for drawing logical network topology diagrams.
"Logical topology, or signal topology, is the arrangement of devices on a computer network and how they communicate with one another. How devices are connected to the network through the actual cables that transmit data, or the physical structure of the network, is called the physical topology. Physical topology defines how the systems are physically connected. It represents the physical layout of the devices on the network. The logical topology defines how the systems communicate across the physical topologies.
Logical topologies are bound to network protocols and describe how data is moved across the network. ... EXAMPLE : twisted pair Ethernet is a logical bus topology in a physical star topology layout. While IBM's token ring is a logical ring topology, it is physically set up in star topology." [Logical topology. Wikipedia]
The icons example "Logical symbols - Vector stencils library" was created using the ConceptDraw PRO diagramming and vector drawing software extended with the Computer and Networks solution from the Computer and Networks area of ConceptDraw Solution Park.
www.conceptdraw.com/ solution-park/ computer-and-networks
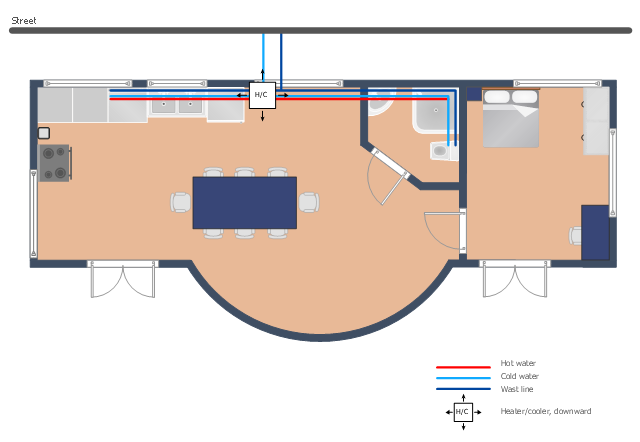
This plumbing and piping plan sample shows the apartment hot and cold water supply and waste removal system.
It was drawn on the base of plumbing plan from the website of the Pennsylvania State University. [personal.psu.edu/ students/ k/ z/ kzz5000/ Final Presentation group work/ Drawing Sheets/ P101 - Plumbing Plan.jpg]
"" []
The tap water supply scheme example "Apartment plumbing plan" was created using the ConceptDraw PRO diagramming and vector drawing software extended with the Plumbing and Piping Plans solution from the Building Plans area of ConceptDraw Solution Park.
- How to Draw an Organization Chart | How to Draw an ...
- Draw A University Organisational Structure Of A University
- Drawing Of A University Cafeteria Layout
- Draw The Organogram Of University
- Draw An Organisational Structure Of A University
- Organizational chart - University leadership | Organizational chart ...
- Organizational chart - University leadership | Examples of ...
- Orgchart | How to Draw an Organization Chart | Business Diagram ...
- Organizational Structure | How to Draw an Organization Chart ...
- University Organizational Chart Diagram
- Bubble Diagram Of University
- Organizational chart - University leadership | Organizational ...
- Organizational chart - University leadership | Basic Flowchart ...
- Diagram Organisation Structure Of University
- Draw The Organisational Chart Of University Library And Describe
- Draw An Organogram Of A University
- Process Flowchart | Organizational chart - University leadership ...
- How to Draw an Organization Chart | Organizational Charts with ...
- Orgchart | Organizational chart - University leadership ...
- Examples of Flowcharts, Org Charts and More | How to Draw an ...































-logical-symbols---vector-stencils-library.png--diagram-flowchart-example.png)


