 Value Stream Mapping
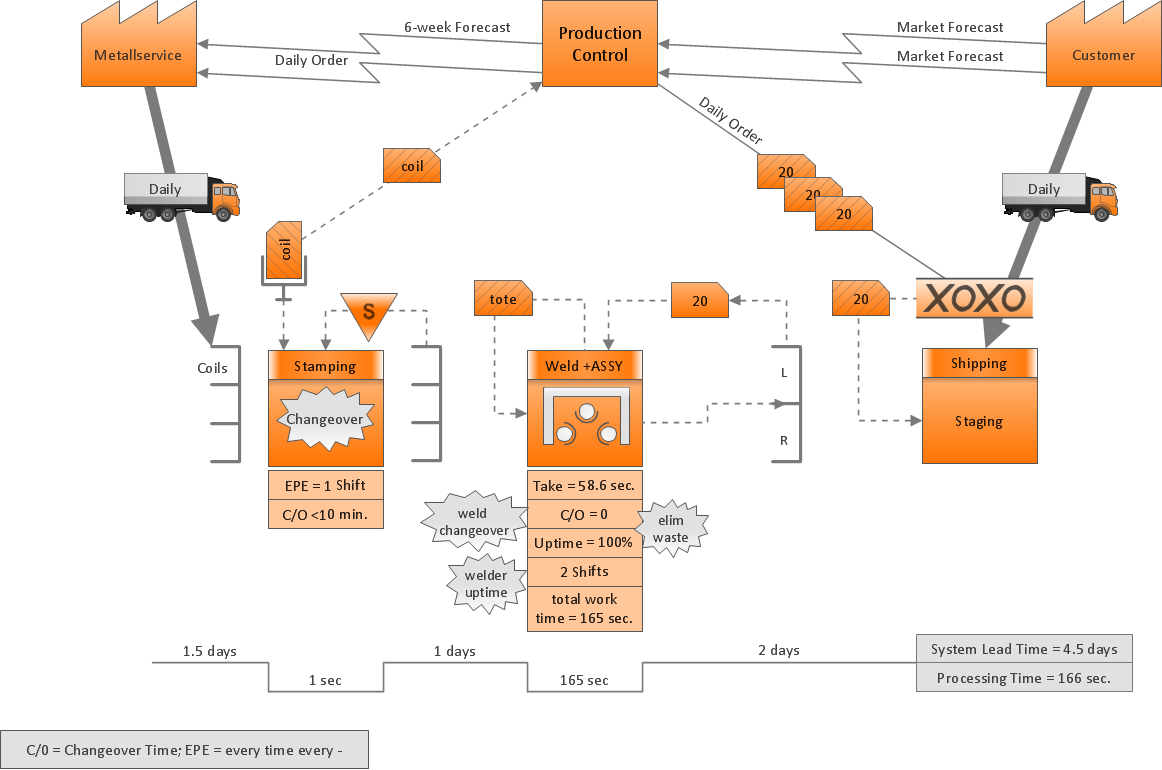
Value stream mapping solution extends ConceptDraw PRO software with templates, samples and vector stencils for drawing the Value Stream Maps (VSM) in lean manufacturing practice.
Create a Value Stream Map Rapidly
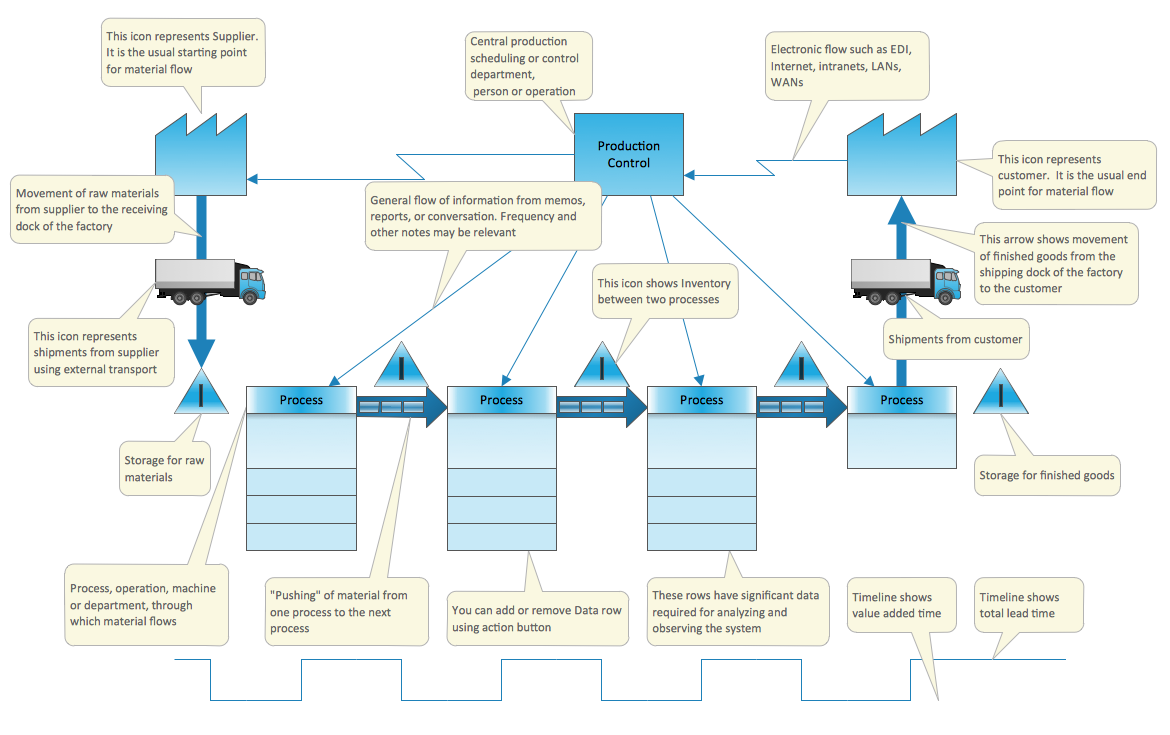
The Value Stream Mapping solution from ConceptDraw Solution Park extends ConceptDraw PRO software with a new library that contains vector objects, samples and templates.Sections of the Value Stream Map
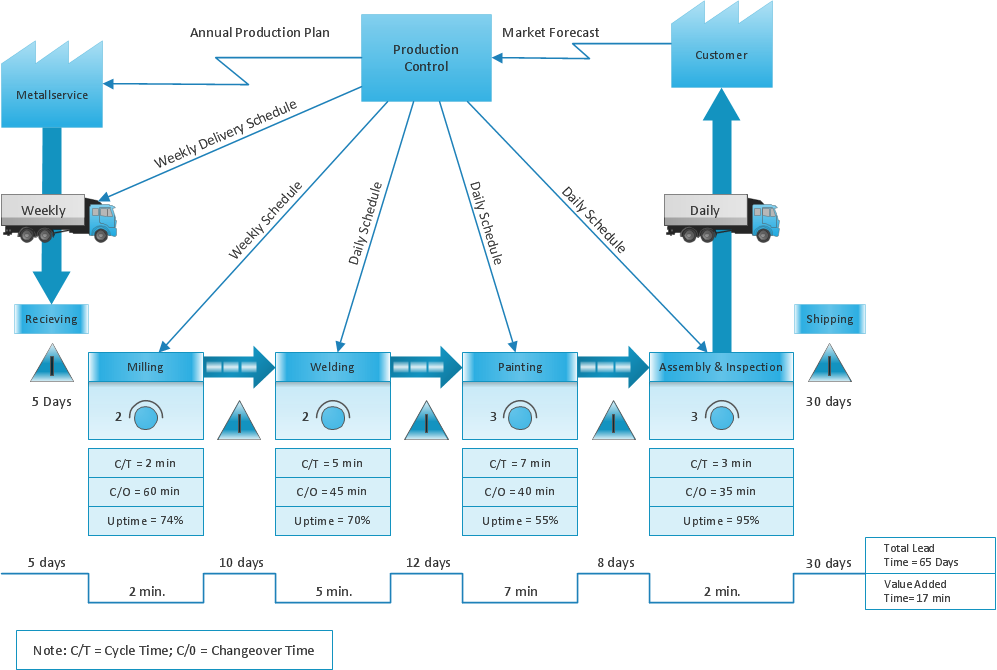
The Value Stream Mapping solution extends ConceptDraw PRO software with a new library that contain vector objects, samples and templates.Lean Manufacturing Diagrams
The Value Stream Mapping solution continues to extend the range of ConceptDraw PRO into a business graphics tool that can be used to document processes of Lean Manufacturing.What is Value Stream Mapping?
Value stream maps (VSM) are an essential tool for organizations applying Lean methods.Value Stream Mapping Presentations
Users can create Value Stream Mapping Presentations using presentation mode in ConceptDraw PRO.
 Presentation Exchange
This solution extends ConceptDraw MINDMAP software with the ability to import presentations from Microsoft PowerPoint, as well as enhancing its existing presentation capabilities.
 PM Presentations
This solution extends ConceptDraw MINDMAP and ConceptDraw PRO software, improving the efficiency of the project management process by using the same source data to build targeted presentations.
 Event-driven Process Chain (EPC) Diagrams
Event-driven Process Chain (EPC) Diagram is a type of flowchart widely used for modeling in business engineering and reengineering, business process improvement, and analysis. EPC method was developed within the Architecture of Integrated Information Systems (ARIS) framework.
 Metro Map
Metro Map solution extends ConceptDraw PRO software with templates, samples and library of vector stencils for drawing the metro maps, route maps, bus and other transport schemes, or design tube-style infographics.
 Sales Dashboard
Sales Dashboard solution extends ConceptDraw PRO software with templates, samples and library of vector stencils for drawing the visual dashboards of sale metrics and key performance indicators (KPI).
- Value Stream Mapping
- Value Stream Mapping | Entity-Relationship Diagram (ERD ...
- How To Do A Mind Map In PowerPoint | Best Mind Mapping ...
- What is Value Stream Mapping ? - Conceptdraw.com
- Sales Dashboard | Entity-Relationship Diagram (ERD) | Value ...
- Value Stream Mapping | ConceptDraw PRO Compatibility with MS ...
- Workflow Diagrams | Cross-Functional Flowcharts | Value Stream ...
- SWOT Analysis Tool for Small Business | SWOT Analysis | How to ...
- Fishbone Diagram | Value Stream Mapping | Cross-Functional ...
- How To Do A Mind Map In Powerpoint | How To Create a ...
- Value Stream Mapping | How To Create Emergency Plans | Best ...
- Quality Mind Map | Value Stream Mapping | Best Value Stream ...
- Metro Map | How To Do A Mind Map In PowerPoint | Maps |
- Value Stream Mapping | - Conceptdraw.com
- Value Stream Mapping | Quality | ConceptDraw Arrows10 Technology
- How To Do A Mind Map In Powerpoint | One formula of professional ...
- Sales Dashboard | Presentation Exchange | Accounting Flowcharts |
- How to Create a PowerPoint Presentation from a SWOT Analysis ...
- Entity-Relationship Diagram (ERD) | Value Stream Mapping ...
- SWOT Analysis Tool for Small Business


