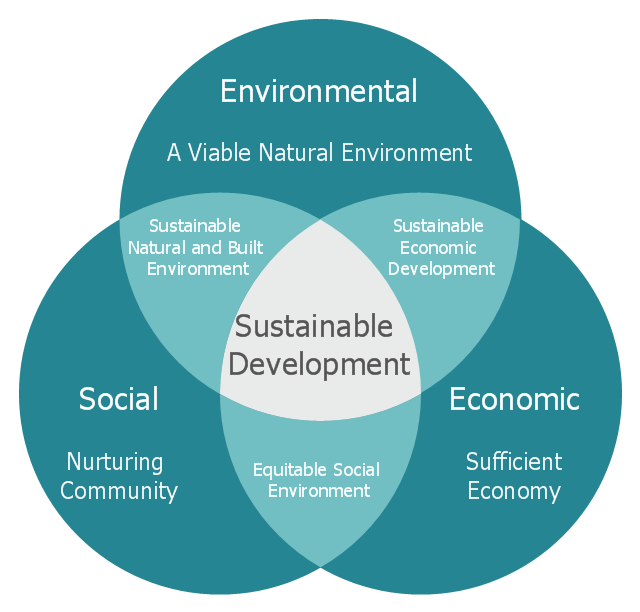
This Venn diagram sample depicts the path to sustainable development.
"Sustainable development is an organizing principle for human life on a finite planet. It posits a desirable future state for human societies in which living conditions and resource-use meet human needs without undermining the sustainability of natural systems and the environment, so that future generations may also have their needs met.
Sustainable development ties together concern for the carrying capacity of natural systems with the social and economic challenges faced by humanity. As early as the 1970s, 'sustainability' was employed to describe an economy "in equilibrium with basic ecological support systems." Scientists in many fields have highlighted The Limits to Growth, and economists have presented alternatives, for example a 'steady state economy', to address concerns over the impacts of expanding human development on the planet." [Sustainable development. Wikipedia]
The Venn diagram example "Path to sustainable development" was created using the ConceptDraw PRO diagramming and vector drawing software extended with the Venn Diagrams solution from the area "What is a Diagram" of ConceptDraw Solution Park.
SWOT Analysis
Most of the data needed for market analysis (demand, prices, volume of sales, etc.) are undefined, and in future are possible their changes as in the worst and the best side. SWOT analysis is effective method for prediction these processes and decision making for organizations that function in a competitive environment. It allows you to see the whole situation, to identify the strengths and weaknesses of organization (advantages and disadvantages), as well as opportunities and threats of external environment. The results of SWOT analysis are the basis for optimization the business processes, for development by the leading specialists in organization of interrelated complex of strategies and competitive activities. ConceptDraw DIAGRAM software enhanced with SWOT and TOWS Matrix Diagrams Solution will effectively help you in strategic planning for your company, department, project, in development marketing campaign, in identification of four categories of factors of internal and external environment of organization, and construction professional-looking SWOT and TOWS matrices.SWOT Analysis Tool for Small Business
SWOT analysis is effective method of making the plan to evaluate the Strengths, Weaknesses, Opportunities, and Threats involved in a project. SWOT analysis includes the specifying project objectives and attentive identifying the internal and external causes for accomplishing the main project goals. It is actively used in large and small business project management for effective and clear identifying the critical factors. SWOT and TOWS Matrix Diagrams solution is included to ConceptDraw Solution Park and contains the high-quality analysis tools. This graphical solution turns the ConceptDraw DIAGRAM software in an excellent marketing management and advertising agency software, the best SWOT analysis tool for small business or large, as you like and need. Included graphic tools, visual and project planning components make it the best marketing project management software for marketing project planning and for making marketing presentations. Use the ConceptDraw DIAGRAM to create professional and well-designed SWOT matrices in minutes.
 Matrices
This solution extends ConceptDraw DIAGRAM software with samples, templates and library of design elements for drawing the business matrix diagrams.
HelpDesk
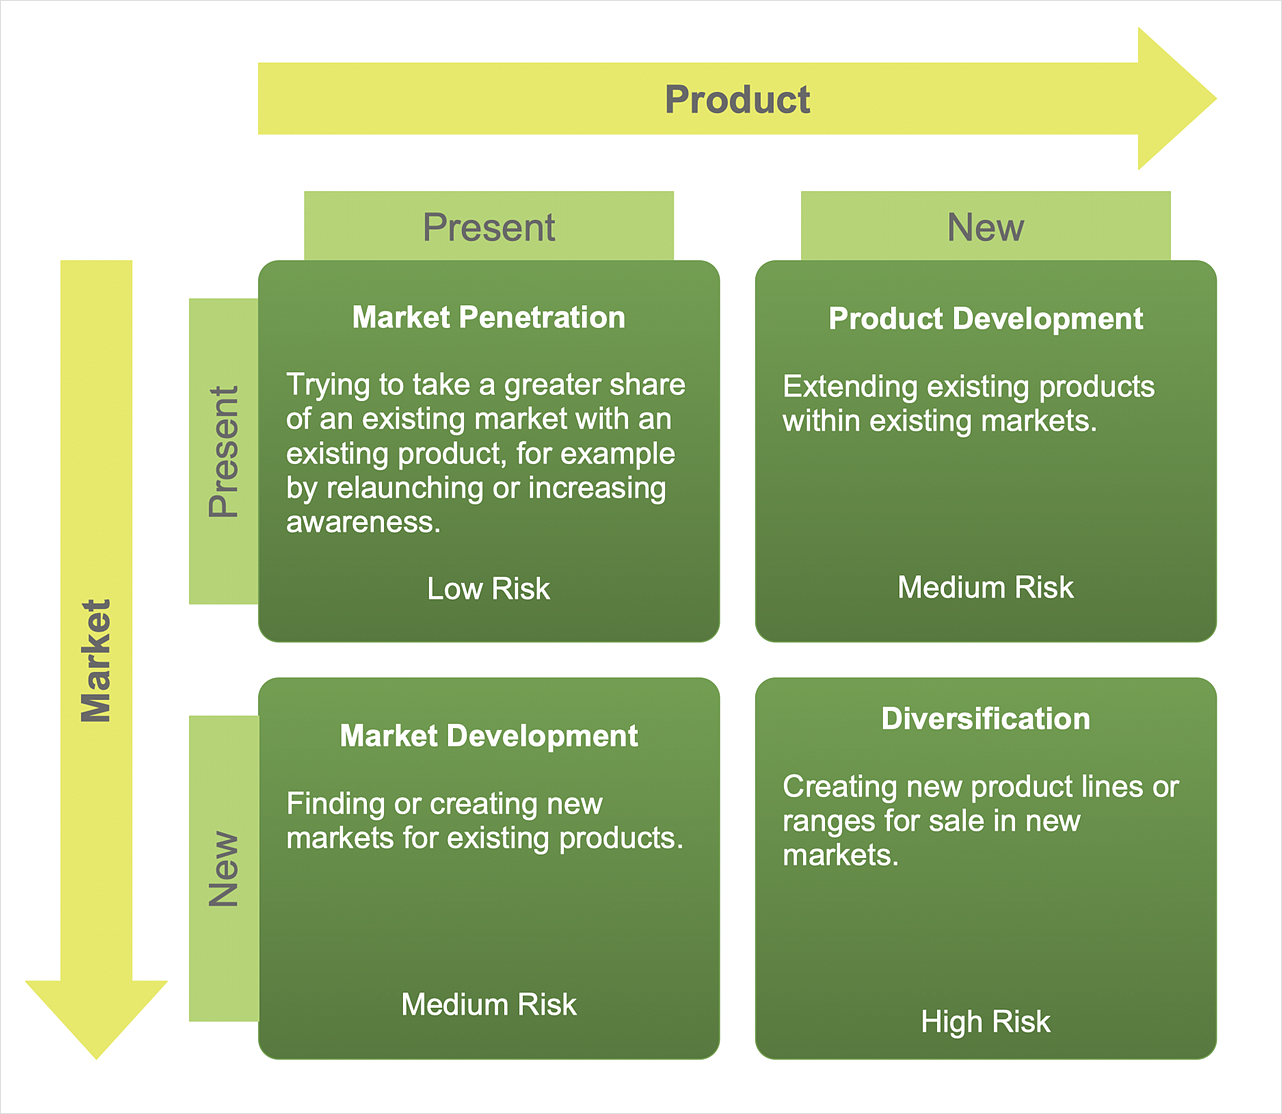
How to Make an Ansoff Matrix Template
Ansoff Matrix is a business strategic management tool that helps a business determine its product and market growth strategy. Ansoff matrix has four sections to show each impacting ways that businesses can grow. Using Ansoff Matrix enables determining the current position of any business in the industry and choose the direction of its growth, which would provide the most competitive position. While Ansoff Matrix is most commonly used as a business planning tool it can be used also for personal development. You can make Ansoff Matrix template for your organization using ConceptDraw DIAGRAM Matrices solution.
 Picture Graphs
Typically, a Picture Graph has very broad usage. They many times used successfully in marketing, management, and manufacturing. The Picture Graphs Solution extends the capabilities of ConceptDraw DIAGRAM with templates, samples, and a library of professionally developed vector stencils for designing Picture Graphs.
Best Vector Drawing Application for Mac OS X
ConceptDraw DIAGRAM creates drawings, diagrams and charts with great visual appeal in Mac OS X.
 Basic Area Charts
This solution extends the capabilities of ConceptDraw DIAGRAM (or later) with templates, samples and a library of vector stencils for drawing Area Charts (area graphs) that visualize changes in values by filling in the area beneath the line connecting data points.
 Basic Line Graphs
This solution extends the capabilities of ConceptDraw DIAGRAM (or later) with templates, samples and a library of vector stencils for drawing Line Graphs.
 Football
The Football Solution extends ConceptDraw DIAGRAM software with samples, templates, and libraries of vector objects for drawing football (American) diagrams, plays schemas, and illustrations. It can be used to make professional looking documen
 Computer and Networks Area
The solutions from Computer and Networks Area of ConceptDraw Solution Park collect samples, templates and vector stencils libraries for drawing computer and network diagrams, schemes and technical drawings.
 PM Dashboards
The PM Dashboards solution extends the management boundaries of ConceptDraw DIAGRAM and ConceptDraw PROJECT products with an ability to demonstrate changes to the budget status, to show the project progress toward its objectives, to display clearly the identified key performance indicator (KPI) or the set of key performance indicators for any project. This solution provides you with examples and ability to generate three types of visual dashboards reports based on your project data Project Dashboard, Tactical Dashboard, and Radar Chart. By dynamically charting the project’s key performance indicators that are collected on one ConceptDraw DIAGRAM document page, all project participants, project managers, team members, team leaders, stakeholders, and the entire organizations, for which this solution is intended, have access to the daily status of projects they are involved in.
 Frequency Distribution Dashboard
Frequency distribution dashboard solution extends ConceptDraw DIAGRAM software with samples, templates and vector stencils libraries with histograms and area charts for drawing the visual dashboards showing frequency distribution of data.
 Landscape & Garden
The Landscape and Gardens solution for ConceptDraw DIAGRAM is the ideal drawing tool when creating landscape plans. Any gardener wondering how to design a garden can find the most effective way with Landscape and Gardens solution.
 Health Food
The Health Food solution contains the set of professionally designed samples and large collection of vector graphic libraries of healthy foods symbols of fruits, vegetables, herbs, nuts, beans, seafood, meat, dairy foods, drinks, which give powerful possi
- Vienn Diagram Of Growth And Development
- Principle Of Human Development In Venn Diagram
- Venn Diagram Comparison Of Growth And Development
- Diagrams Of Human Growth And Development
- Path to sustainable development | Circle-Spoke Diagrams | Concept ...
- Path to sustainable development | Venn Diagram Examples for ...
- Venn Diagram Examples for Problem Solving. Environmental Social ...
- Diagram Of Development
- Recent Venn Diagram Sustainable Development
- Flow Chart About Human Growth And Development
- Been Diagram Of Growth And Development
- Venn Diagram Examples for Problem Solving. Environmental Social ...
- Growth And Development Charts
- Venn Diagram Examples for Problem Solving. Environmental Social ...
- Human Resource Development | Human Resource Management ...
- Venn diagram - Path to sustainable development | Sustainable ...
- Path to sustainable development | Sustainable development | Venn ...
- Human Resource Development | Basic Flowchart Symbols and ...
- Human Development Diagrams


