Process Flowchart


HelpDesk
How to Diagram Sentences in ConceptDraw PRO

Basic Flowchart Symbols and Meaning


How to Create a Line Chart

The vector stencils library "Mac OS X Lion user interface" contains 52 UI design elements.
Use it for designing Mac OS X Lion graphic user interface (GUI) of software for Apple computers in the ConceptDraw PRO diagramming and vector drawing software extended with the Graphic User Interface solution from the Software Development area of ConceptDraw Solution Park.
Use it for designing Mac OS X Lion graphic user interface (GUI) of software for Apple computers in the ConceptDraw PRO diagramming and vector drawing software extended with the Graphic User Interface solution from the Software Development area of ConceptDraw Solution Park.
Title Bar

Title Bar Inactive

Window

Window Inactive

Window Title Bar

Window Title Bar (Inactive)
-mac-os-x-lion-user-interface---vector-stencils-library.png--diagram-flowchart-example.png)
Full Screen Button

Exit Full Screen Button

Window without Bar

Window (Narrow Toolbar)
-mac-os-x-lion-user-interface---vector-stencils-library.png--diagram-flowchart-example.png)
Window Inactive (Narrow Toolbar)
-mac-os-x-lion-user-interface---vector-stencils-library.png--diagram-flowchart-example.png)
Panel (Hud Window)
-mac-os-x-lion-user-interface---vector-stencils-library.png--diagram-flowchart-example.png)
Panel (Hud Window) (Inactive)
-(inactive)-mac-os-x-lion-user-interface---vector-stencils-library.png--diagram-flowchart-example.png)
Box 1

Box 2

Field

List View 1

List View 2

Scroll Bar Vertical

Scroll Bar Horizontal

Main Menu

Menu Bar

Menu

Vertical Line

Horizontal Line

Apple Menu

Arrow mark
Combo Box

Pop Up Menu

Text Field

Count Button

Search Field

Check Box

Check Box

Group of Check Boxes

Radio Button

Radio Button

Group of Radio Buttons

Linear Slider (round thumb)
-mac-os-x-lion-user-interface---vector-stencils-library.png--diagram-flowchart-example.png)
Linear Slider (directional thumb)
-mac-os-x-lion-user-interface---vector-stencils-library.png--diagram-flowchart-example.png)
Circular Slider

Color Well

Relevance Indicator

Rating Indicator

Indeterminate Progress Bar

Determinate Progress Bar

Continuous Capacity Indicator

Discrete Capacity Indicator

Discrete Capacity Indicator (yellow)
-mac-os-x-lion-user-interface---vector-stencils-library.png--diagram-flowchart-example.png)
Discrete Capacity Indicator (red)
-mac-os-x-lion-user-interface---vector-stencils-library.png--diagram-flowchart-example.png)
Asynchronous Progress Indicator

Circular Progress Indicator

Bar Diagrams for Problem Solving. Create economics and financial bar charts with Bar Graphs Solution

The vector stencils library "Mac OS X Lion user interface" contains 52 UI design elements.
Use it for designing Mac OS X Lion graphic user interface (GUI) of software for Apple computers in the ConceptDraw PRO diagramming and vector drawing software extended with the Graphic User Interface solution from the Software Development area of ConceptDraw Solution Park.
Use it for designing Mac OS X Lion graphic user interface (GUI) of software for Apple computers in the ConceptDraw PRO diagramming and vector drawing software extended with the Graphic User Interface solution from the Software Development area of ConceptDraw Solution Park.
Title Bar
Title Bar Inactive
Window
Window Inactive
Window Title Bar
Window Title Bar (Inactive)
Full Screen Button
Exit Full Screen Button
Window without Bar
Window (Narrow Toolbar)
Window Inactive (Narrow Toolbar)
Panel (Hud Window)
Panel (Hud Window) (Inactive)
Box 1
Box 2
Field
List View 1
List View 2
Scroll Bar Vertical
Scroll Bar Horizontal
Main Menu
Menu Bar
Menu
Vertical Line
Horizontal Line
Apple Menu
Arrow mark
Combo Box
Pop Up Menu
Text Field
Count Button
Search Field
Check Box
Check Box
Group of Check Boxes
Radio Button
Radio Button
Group of Radio Buttons
Linear Slider (round thumb)
Linear Slider (directional thumb)
Circular Slider
Color Well
Relevance Indicator
Rating Indicator
Indeterminate Progress Bar
Determinate Progress Bar
Continuous Capacity Indicator
Discrete Capacity Indicator
Discrete Capacity Indicator (yellow)
Discrete Capacity Indicator (red)
Asynchronous Progress Indicator
Circular Progress Indicator
This vector stencils library contains 32 SysML symbols.
Use it to design your sequence diagrams using ConceptDraw PRO diagramming and vector drawing software.
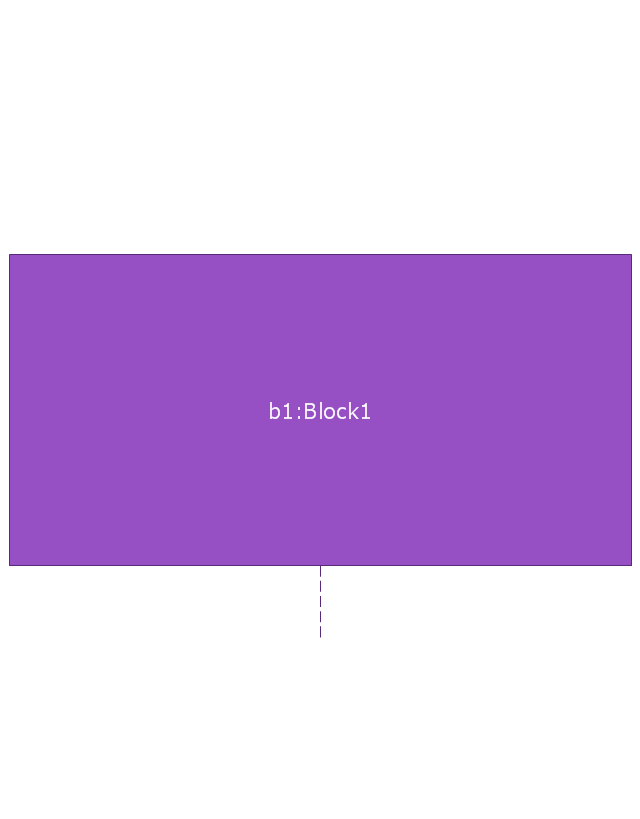
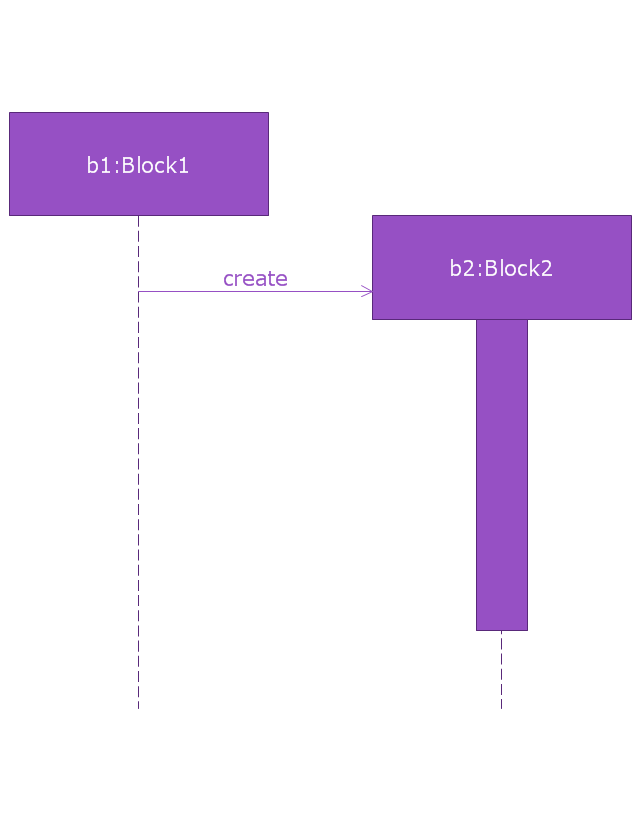
"A sequence diagram shows, as parallel vertical lines (lifelines), different processes or objects that live simultaneously, and, as horizontal arrows, the messages exchanged between them, in the order in which they occur. This allows the specification of simple runtime scenarios in a graphical manner. ...
If the lifeline is that of an object, it demonstrates a role. Leaving the instance name blank can represent anonymous and unnamed instances.
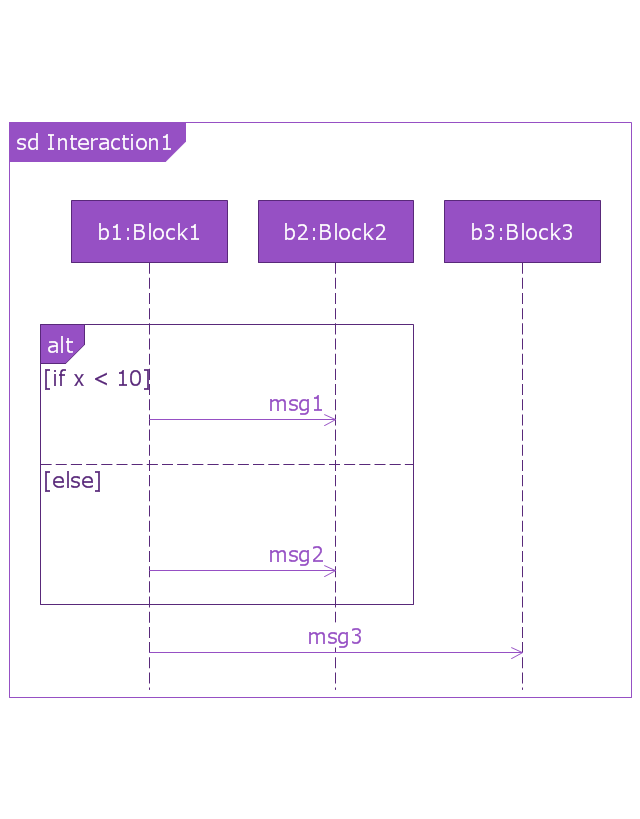
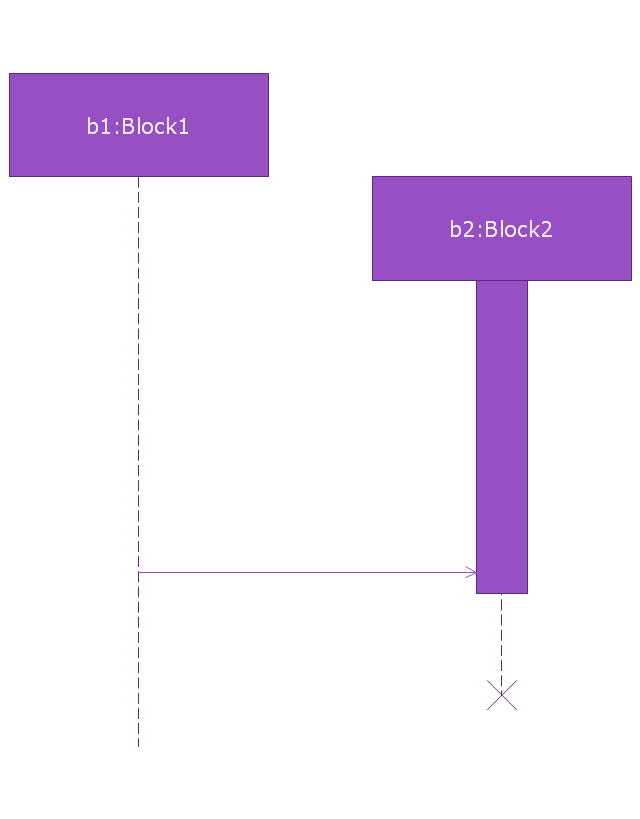
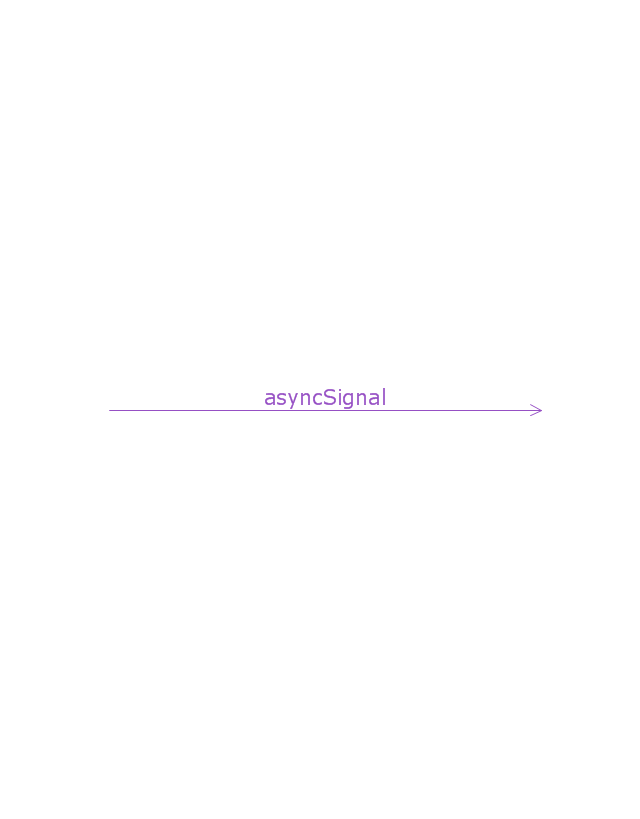
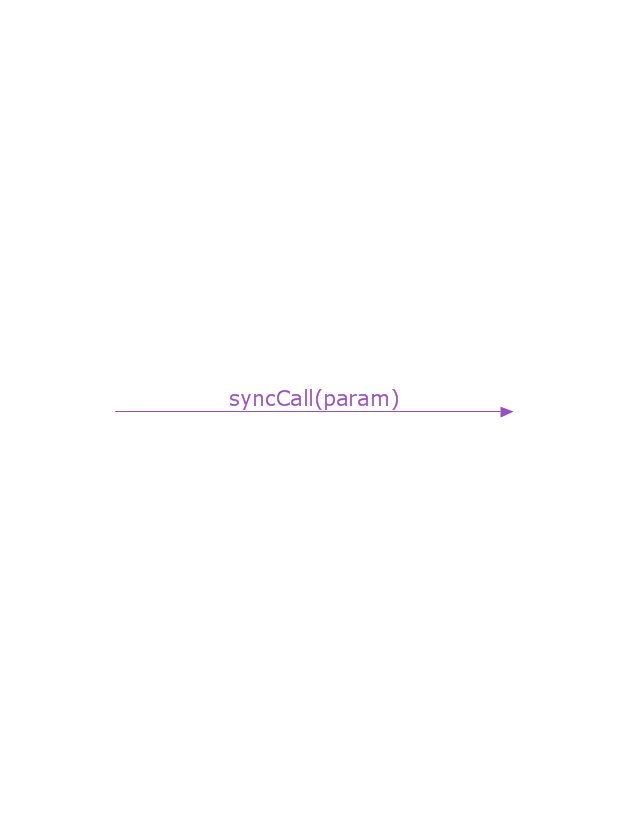
Messages, written with horizontal arrows with the message name written above them, display interaction. Solid arrow heads represent synchronous calls, open arrow heads represent asynchronous messages, and dashed lines represent reply messages. If a caller sends a synchronous message, it must wait until the message is done, such as invoking a subroutine. If a caller sends an asynchronous message, it can continue processing and doesn’t have to wait for a response. Asynchronous calls are present in multithreaded applications and in message-oriented middleware. Activation boxes, or method-call boxes, are opaque rectangles drawn on top of lifelines to represent that processes are being performed in response to the message (ExecutionSpecifications in UML).
Objects calling methods on themselves use messages and add new activation boxes on top of any others to indicate a further level of processing.
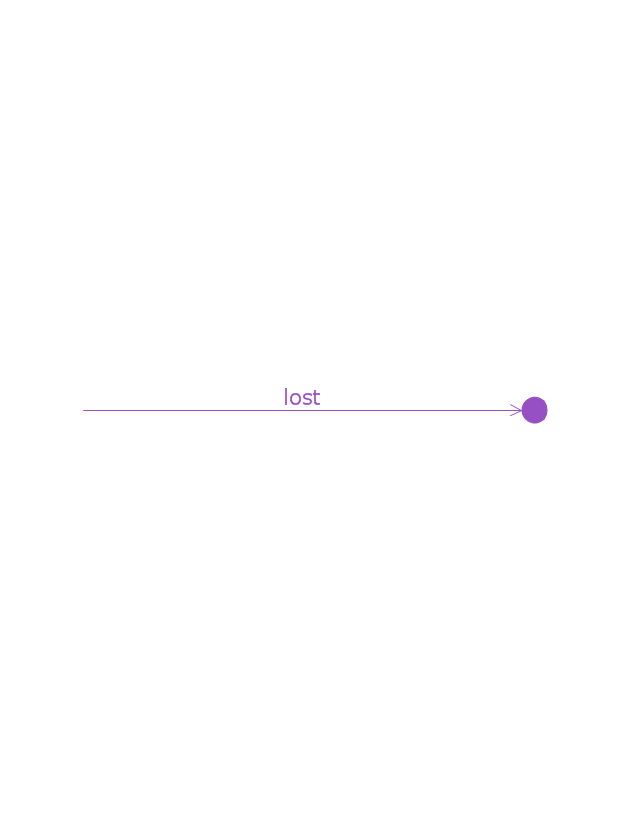
When an object is destroyed (removed from memory), an X is drawn on top of the lifeline, and the dashed line ceases to be drawn below it (this is not the case in the first example though). It should be the result of a message, either from the object itself, or another.
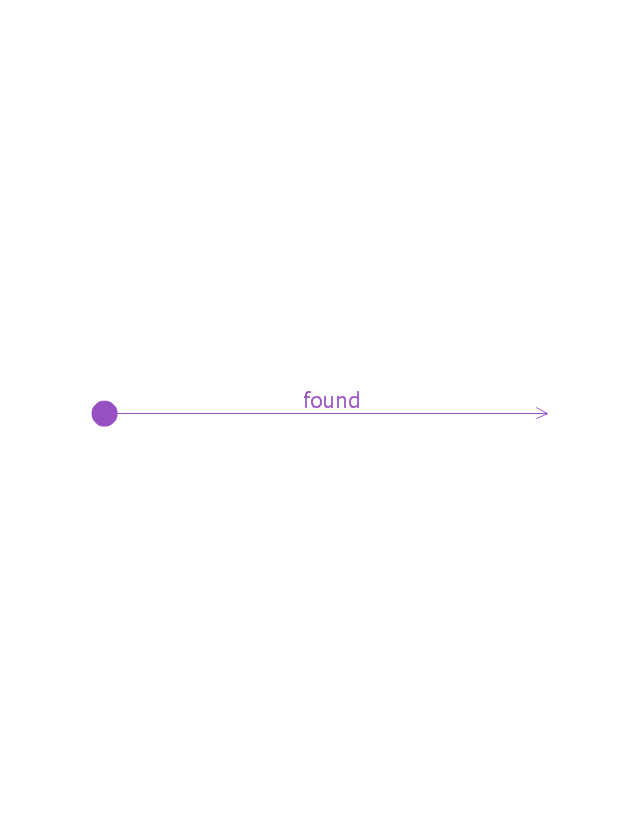
A message sent from outside the diagram can be represented by a message originating from a filled-in circle (found message in UML) or from a border of the sequence diagram (gate in UML)." [Sequence diagram. Wikipedia]
The vector stencils library "Sequence diagram" is included in the SysML solution from the Software Development area of ConceptDraw Solution Park.
Use it to design your sequence diagrams using ConceptDraw PRO diagramming and vector drawing software.
"A sequence diagram shows, as parallel vertical lines (lifelines), different processes or objects that live simultaneously, and, as horizontal arrows, the messages exchanged between them, in the order in which they occur. This allows the specification of simple runtime scenarios in a graphical manner. ...
If the lifeline is that of an object, it demonstrates a role. Leaving the instance name blank can represent anonymous and unnamed instances.
Messages, written with horizontal arrows with the message name written above them, display interaction. Solid arrow heads represent synchronous calls, open arrow heads represent asynchronous messages, and dashed lines represent reply messages. If a caller sends a synchronous message, it must wait until the message is done, such as invoking a subroutine. If a caller sends an asynchronous message, it can continue processing and doesn’t have to wait for a response. Asynchronous calls are present in multithreaded applications and in message-oriented middleware. Activation boxes, or method-call boxes, are opaque rectangles drawn on top of lifelines to represent that processes are being performed in response to the message (ExecutionSpecifications in UML).
Objects calling methods on themselves use messages and add new activation boxes on top of any others to indicate a further level of processing.
When an object is destroyed (removed from memory), an X is drawn on top of the lifeline, and the dashed line ceases to be drawn below it (this is not the case in the first example though). It should be the result of a message, either from the object itself, or another.
A message sent from outside the diagram can be represented by a message originating from a filled-in circle (found message in UML) or from a border of the sequence diagram (gate in UML)." [Sequence diagram. Wikipedia]
The vector stencils library "Sequence diagram" is included in the SysML solution from the Software Development area of ConceptDraw Solution Park.
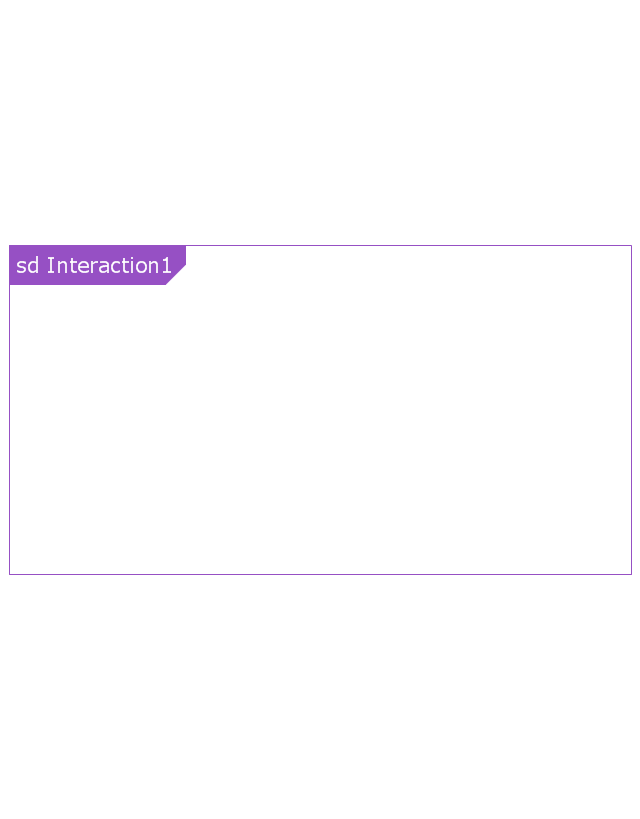
Sequence diagram
Lifeline
Execution specification

Execution specification 2

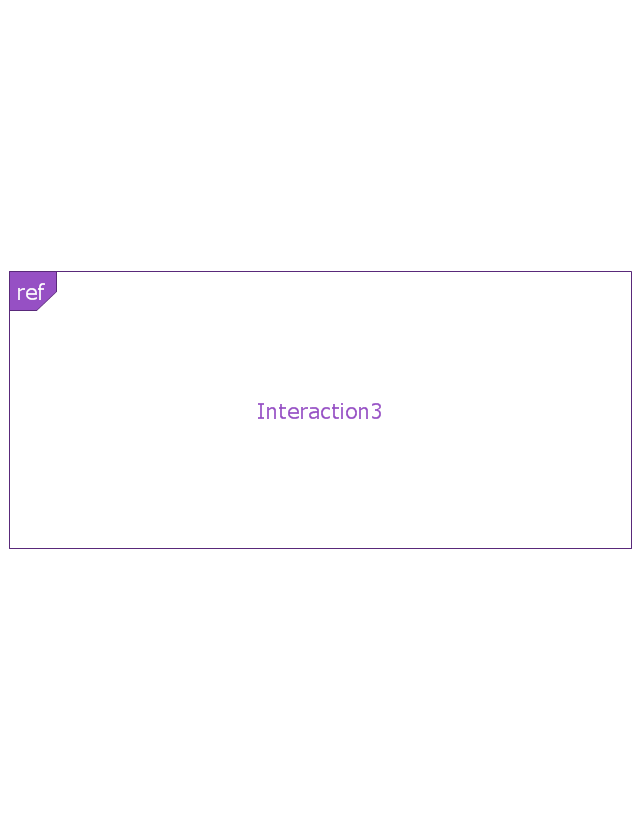
Interaction use
Combined fragment
Combined fragment - Weak sequencing

Combined fragment - Alternatives
Combined fragment - Option

Combined fragment - Break
Combined fragment - Parallel

Combined fragment - Strict sequencing

Combined fragment - Loop
Combined fragment - Critical region
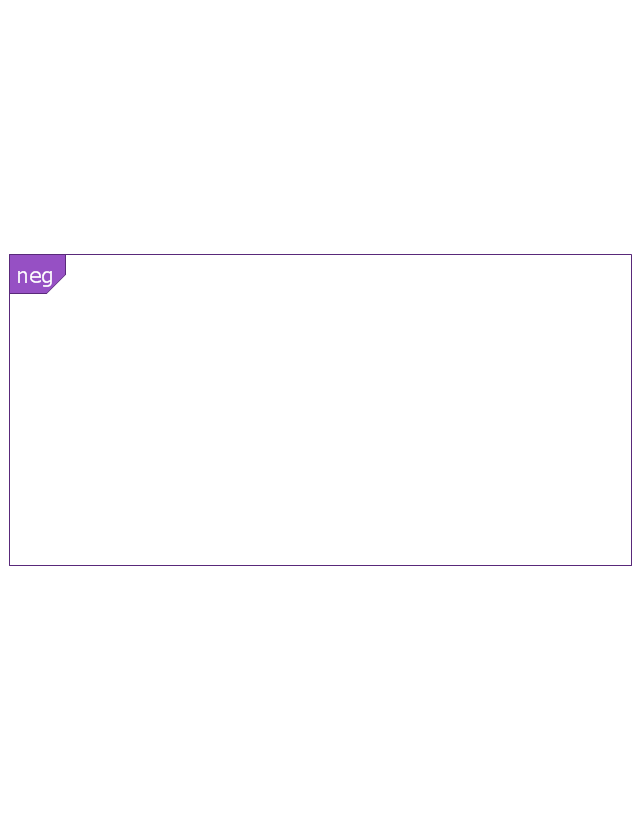
Combined fragment - Negative
Combined fragment - Assertion

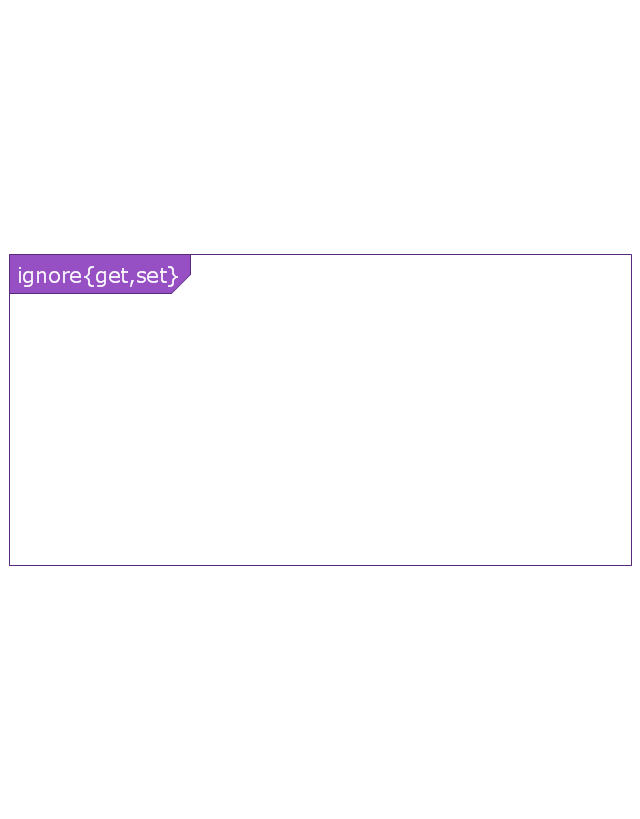
Combined fragment - Ignore
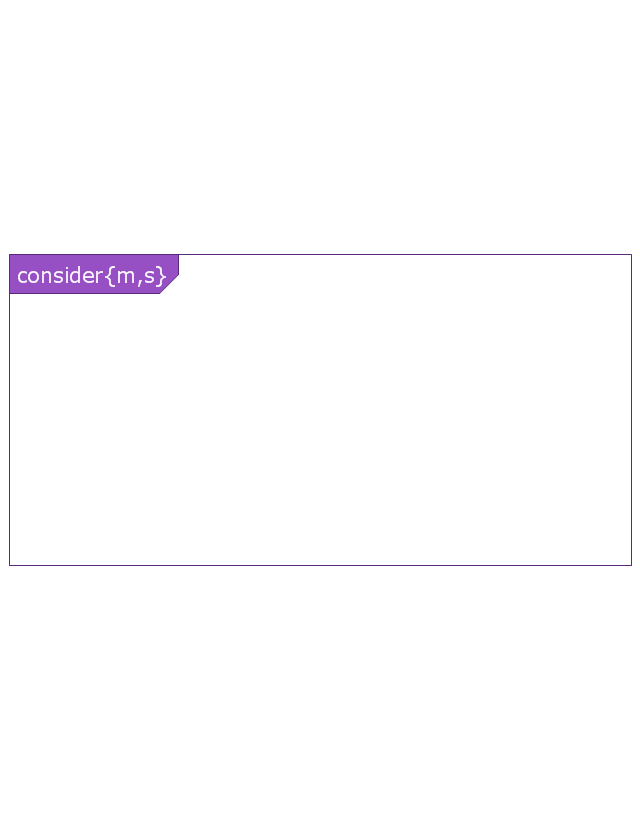
Combined fragment - Consider
State invariant / Continuations
Coregion

Creation event
Destruction event
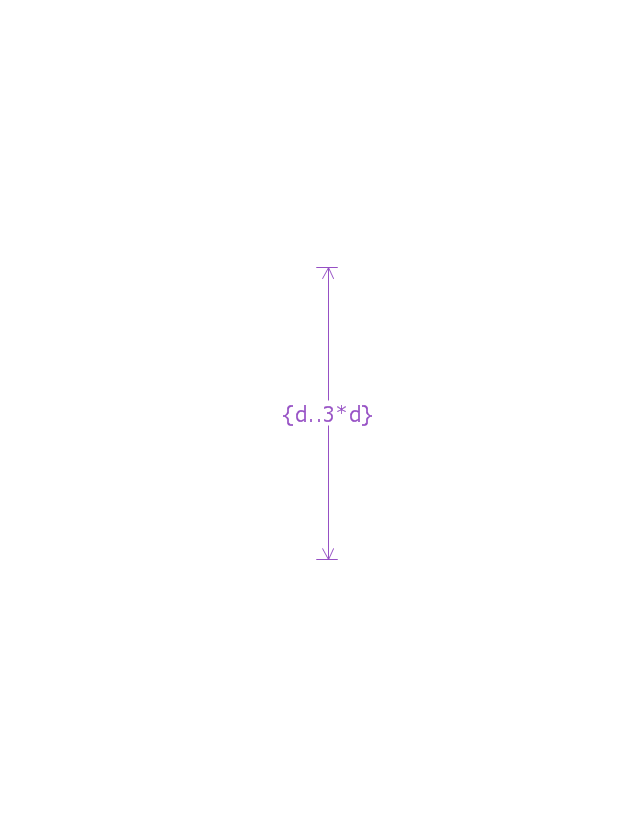
Duration constraint
Duration observation
Time constraint

Time observation

Message, asynchronous signal
Message, synchronous call
Reply message

Lost message
Found message
General ordering
"A football pitch (also known as a football field or soccer field) is the playing surface for the game of football made of turf. Its dimensions and markings are defined by Law 1 of the Laws of the Game, "The Field of Play".
All line markings on the pitch form part of the area which they define. For example, a ball on or above the touchline is still on the field of play; a ball on the line of the goal area is in the goal area; and a foul committed over the 16.5-metre (18-yard) line has occurred in the penalty area. Therefore a ball must completely cross the touchline to be out of play, and a ball must wholly cross the goal line (between the goal posts) before a goal is scored; if any part of the ball is still on or above the line, the ball is still in play.
The field descriptions that apply to adult matches are described below. Note that due to the original formulation of the Laws in England and the early supremacy of the four British football associations within IFAB, the standard dimensions of a football pitch were originally expressed in imperial units. The Laws now express dimensions with approximate metric equivalents (followed by traditional units in brackets), but use of the imperial units remains common in some countries, especially in the United Kingdom." [Association football pitch. Wikipedia]
The template "Vertical association football pitch" for the ConceptDraw PRO diagramming and vector drawing software is included in the Soccer solution from the Sport area of ConceptDraw Solution Park.
www.conceptdraw.com/ solution-park/ sport-soccer
Soccer field template

How to Create a Scatter Chart

Design Elements for UML Diagrams

The vector stencils library "Education charts" contains 12 graphs and charts: area chart, column chart, divided bar diagram, histogram, horizontal bar graph, line graph, pie chart, ring chart, scatter plot.
Use it to create your educational infograms.
"A chart can take a large variety of forms, however there are common features that provide the chart with its ability to extract meaning from data.
Typically the data in a chart is represented graphically, since humans are generally able to infer meaning from pictures quicker than from text. Text is generally used only to annotate the data.
One of the more important uses of text in a graph is the title. A graph's title usually appears above the main graphic and provides a succinct description of what the data in the graph refers to.
Dimensions in the data are often displayed on axes. If a horizontal and a vertical axis are used, they are usually referred to as the x-axis and y-axis respectively. Each axis will have a scale, denoted by periodic graduations and usually accompanied by numerical or categorical indications. Each axis will typically also have a label displayed outside or beside it, briefly describing the dimension represented. If the scale is numerical, the label will often be suffixed with the unit of that scale in parentheses. ...
The data of a chart can appear in all manner of formats, and may include individual textual labels describing the datum associated with the indicated position in the chart. The data may appear as dots or shapes, connected or unconnected, and in any combination of colors and patterns. Inferences or points of interest can be overlaid directly on the graph to further aid information extraction.
When the data appearing in a chart contains multiple variables, the chart may include a legend (also known as a key). A legend contains a list of the variables appearing in the chart and an example of their appearance. This information allows the data from each variable to be identified in the chart." [Chart. Wikipedia]
The shapes example "Design elements - Education charts" was created using the ConceptDraw PRO diagramming and vector drawing software extended with the Education Infographics solition from the area "Business Infographics" in ConceptDraw Solution Park.
Graphs and charts

HelpDesk
How to Set Line Jumps for Smart Connectors in ConceptDraw PRO

How to Create a Column Chart

UML Sequence Diagram


- Vertical White Line Transparent Png
- Vertical Line Chart
- Red Vector Title Bar Element Png
- Title Box Vector Png
- Vertical association football pitch - Template | Sport Field Plans ...
- Goal Png
- Arrow Png Yellow
- Post Man Png
- Basic Line Graphs | Menus - Vector stencils library | Vertical Cross ...
- Mathematical Diagrams Png
- IDEF0 diagram - Inter-box connections | VoIP call with SIM box and ...
- Flowchart by Hapman | LLNL Flow Charts | Ice hockey rink view from ...
- Water Flow Vector Png
- Png Rectangle Designs
- Soccer Field Png
- Rounded Arrow Png
- Column Chart Examples | Column Chart Template | Column Chart ...
- How to Add Text to a Connector in ConceptDraw PRO | Vertical ...
- Curved Arrow Icon Png
- UML Sequence Diagram. Design Elements | Diagramming Software ...