 Seven Management and Planning Tools
Seven Management and Planning Tools solution extends ConceptDraw PRO and ConceptDraw MINDMAP with features, templates, samples and libraries of vector stencils for drawing management mind maps and diagrams.
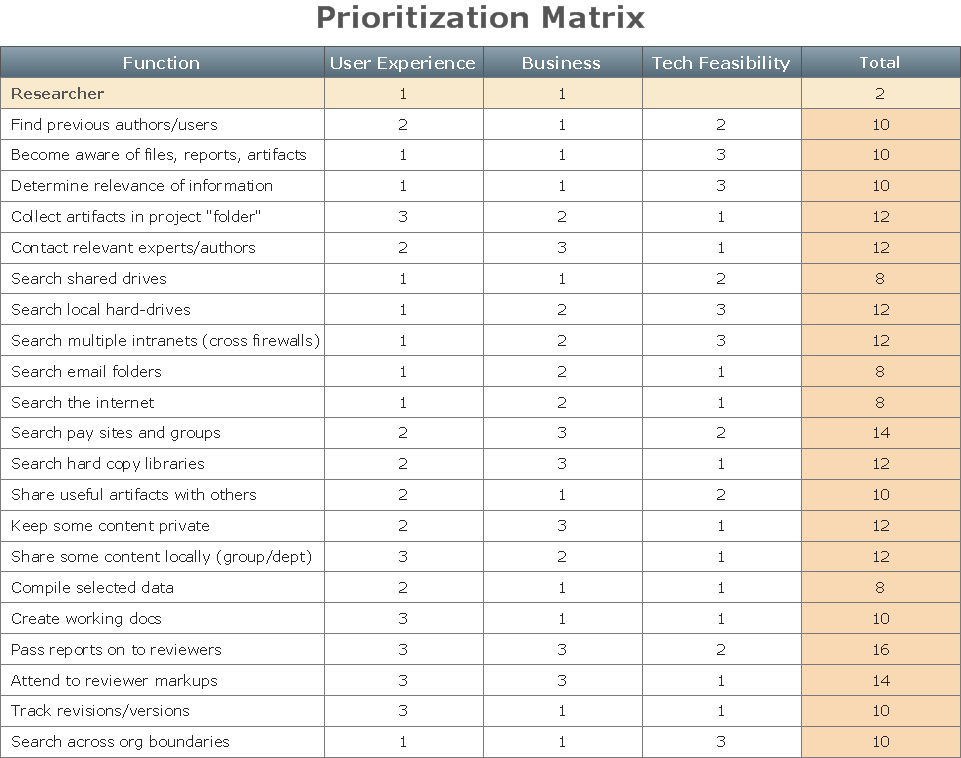
PROBLEM ANALYSIS Prioritization Matrix
Create Prioritization Matrix. Use the Prioritization Matrix to define factor priority.
Root Cause Analysis
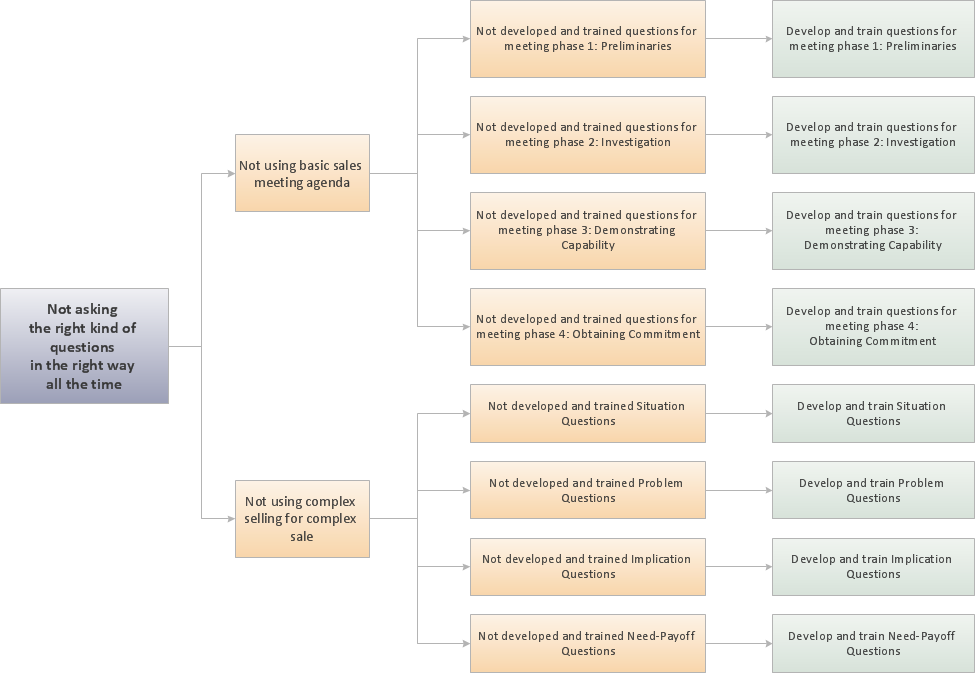
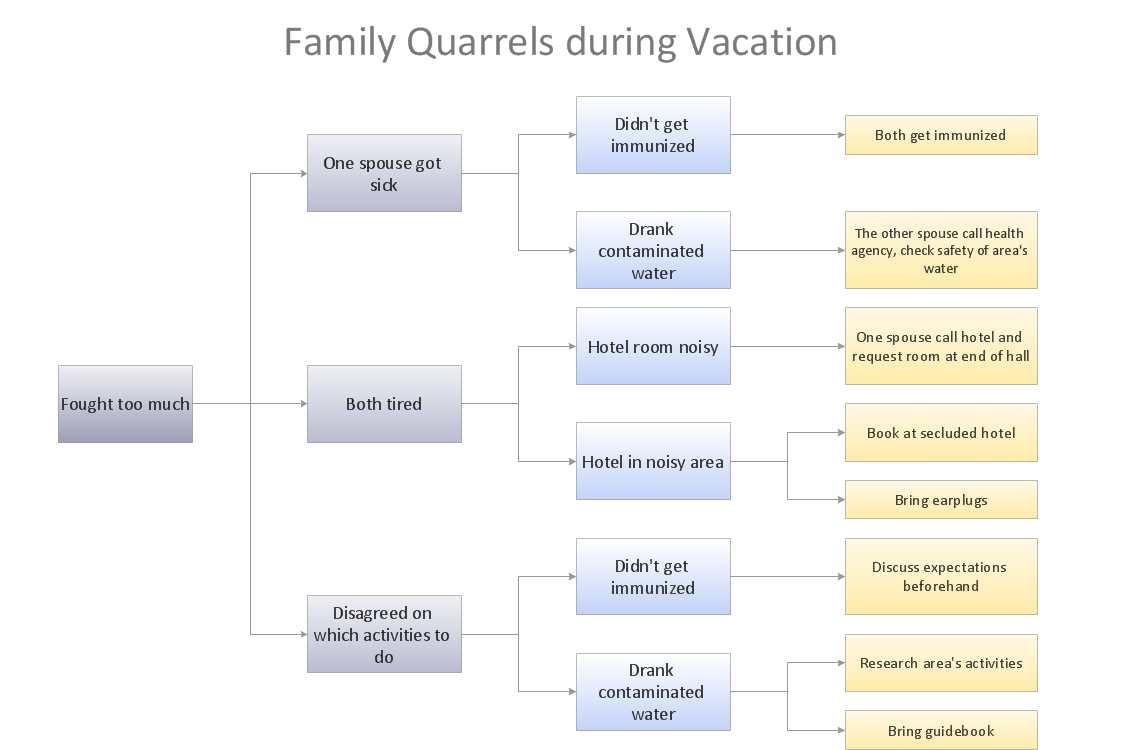
Root Cause Analysis Tree Diagram. This diagram is for Root Cause Analysis.Analyze the root causes for factors that influenced the problem using ConceptDraw.

Problem solving
The Seven Management and Planning Tools are a set of such tools for investigating complex problems.
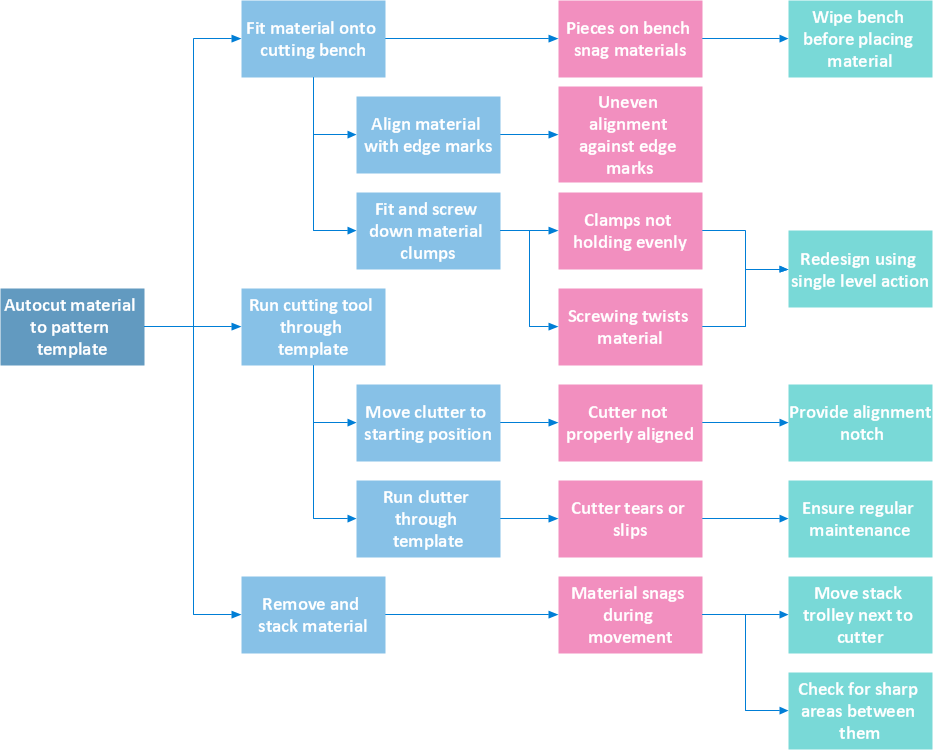
CORRECTIVE ACTIONS PLANNING Risk Diagram (PDPC)
Risk Diagram (PDPC). Analyze problem solving risks and propose preventive actions.
Problem Analysis
Use ConceptDraw PRO for step-by-step analysis of problems and to plan corrective actions.
PROBLEM ANALYSIS Relations Diagram
Analyze Factors Relations. Use the Relations Diagram to create a relations factors map and to identify which factors are “drivers” and “indicators”.
PROBLEM ANALYSIS Root Cause Analysis Tree Diagram
Root Cause Analysis Tree Diagram. Use the Root Cause Diagram to perform visual root cause analysis.
Corrective Action Planning
One of the stages of the problem's solving process scenario is Corrective Action Planning.
Decision Making
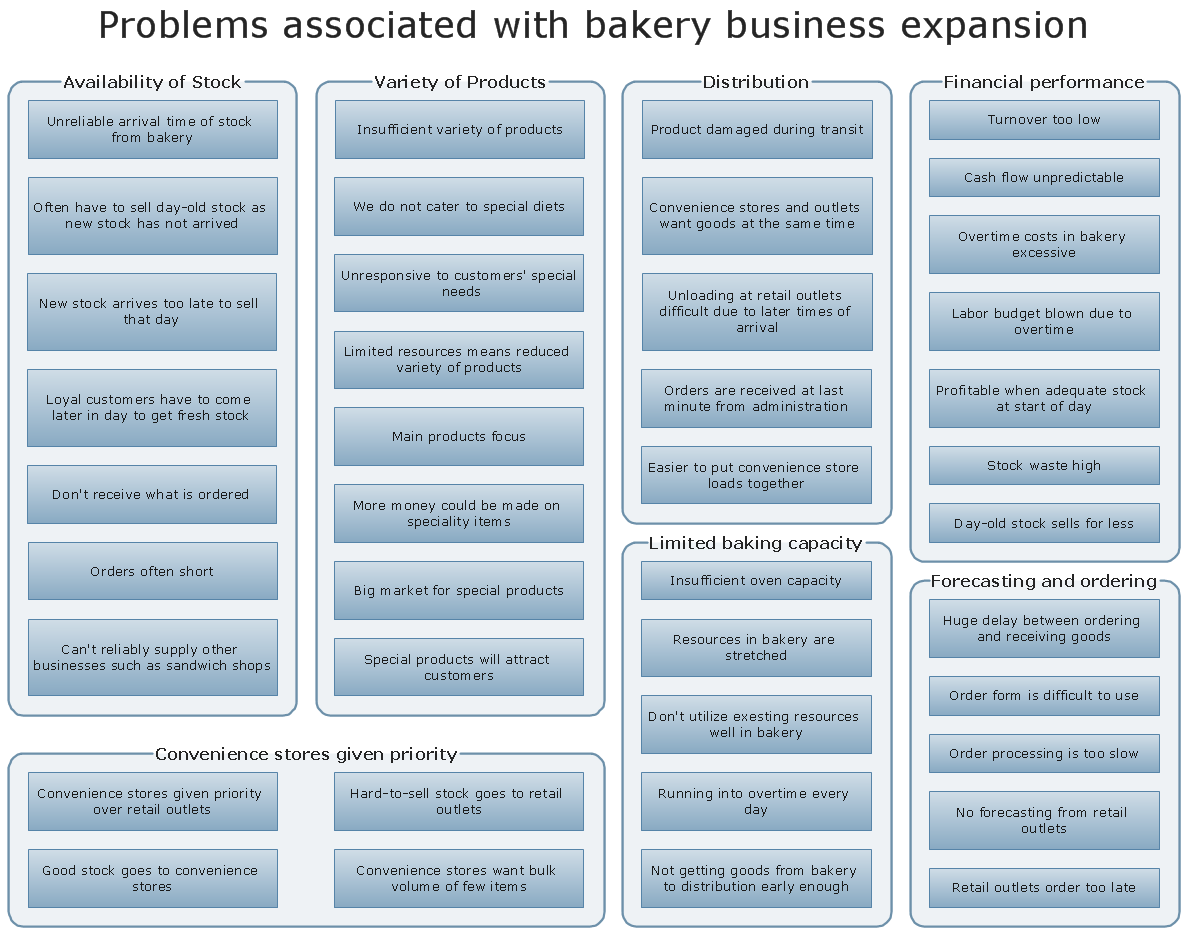
Problem analysis. Affinity Diagram, Gather and structure factors. Create Affinity Diagram using ConceptDraw PRO.
The Action Plan
In practice, the management team makes a decision on a problem in two stages. The first stage is problem analysis and the second stage is action planning.
PROBLEM ANALYSIS Identify and Structure Factors
Identify and Structure Factors.Use the Affinity Diagram to collect and structure factors that impact on a problem.
CORRECTIVE ACTIONS PLANNING PERT Chart
Provide comprehensive visual tools for problem analysis.
CORRECTIVE ACTIONS PLANNING Involvement Matrix
The Involvement Matrix can identify the distribution of responsibilities and identify roles in a group or team. Use the Involvement Matrix to specify roles and responsibilities of actions in problem solving.
Cause & Effect Analysis
Root Cause Analysis Tree Diagram. Use the Root Cause Analysis Diagram to perform visual root cause analysis.
Relationships Analysis
Relations Diagram - factors analysis, factors relations. Create Relations Diagram with ConceptDraw PRO.
Risk Analysis
Risks Diagram. This diagram identifies possible risks in accomplishing corrective actions.
 Business Productivity Area
Business Productivity Solutions extend ConceptDraw products with tools for making presentations, conducting meetings, preparing documents, brainstorming, or building new strategies.
- Seven Management and Planning Tools | Prioritization matrix ...
- Prioritization matrix - Health care problems | Seven Management ...
- Seven Management and Planning Tools | Prioritization matrix ...
- Use a Fishbone Diagram to Attack Complex Problems | Seven ...
- Seven Management and Planning Tools | PROBLEM ANALYSIS ...
- Seven Management and Planning Tools | Root cause analysis tree ...
- PROBLEM ANALYSIS Prioritization Matrix | Seven Management and ...
- CORRECTIVE ACTIONS PLANNING PERT Chart | Seven ...
- Problem solving | Cause and Effect Analysis (Fishbone Diagrams ...
- Seven Management and Planning Tools | PROBLEM ANALYSIS ...
- Seven Management and Planning Tools | Root cause analysis tree ...
- Seven Management and Planning Tools | PROBLEM ANALYSIS ...
- Seven Management and Planning Tools | Cause and Effect Analysis ...
- CORRECTIVE ACTIONS PLANNING Risk Diagram (PDPC) | Risk ...
- Seven Management and Planning Tools | Business Productivity ...
- Seven Management and Planning Tools | Modelling Complex ...
- Seven Management and Planning Tools | PERT chart - Sale ...
- Management Tools Total Quality Management | Seven ...
- Seven Management and Planning Tools | Problem Analysis ...
- Seven Management and Planning Tools | PROBLEM ANALYSIS ...

