Basic Flowchart Symbols and Meaning
Flowcharts are the best for visually representation the business processes and the flow of a custom-order process through various departments within an organization. ConceptDraw PRO diagramming and vector drawing software extended with Flowcharts solution offers the full set of predesigned basic flowchart symbols which are gathered at two libraries: Flowchart and Flowcharts Rapid Draw. Among them are: process, terminator, decision, data, document, display, manual loop, and many other specific symbols. The meaning for each symbol offered by ConceptDraw gives the presentation about their proposed use in professional Flowcharts for business and technical processes, software algorithms, well-developed structures of web sites, Workflow diagrams, Process flow diagram and correlation in developing on-line instructional projects or business process system. Use of ready flow chart symbols in diagrams is incredibly useful - you need simply drag desired from the libraries to your document and arrange them in required order. There are a few serious alternatives to Visio for Mac, one of them is ConceptDraw PRO. It is one of the main contender with the most similar features and capabilities.
Flowchart Programming Project. Flowchart Examples
Create you own flow charts of process-driven software applications using the ConceptDraw PRO diagramming and vector drawing software extended with the Cross-Functional Flowcharts solution from the Business Processes area of ConceptDraw Solution Park. The programming project flow chart example shows the logical process of execution.Functional Block Diagram
You need design the Functional Block Diagram and dream to find the useful tools to draw it easier, quickly and effectively? ConceptDraw PRO offers the Block Diagrams Solution from the "Diagrams" Area which will help you!
 Event-driven Process Chain Diagrams
Event-driven Process Chain (EPC) Diagram is a type of flowchart widely used for modeling in business engineering and reengineering, business process improvement, and analysis. EPC method was developed within the Architecture of Integrated Information Systems (ARIS) framework.
 Logistics Flow Charts
Logistics Flow Charts solution extends ConceptDraw PRO v11 functionality with opportunities of powerful logistics management software. It provides large collection of predesigned vector logistic symbols, pictograms, objects and clipart to help you design with pleasure Logistics flow chart, Logistics process flow diagram, Inventory flow chart, Warehouse flowchart, Warehouse management flow chart, Inventory control flowchart, or any other Logistics diagram. Use this solution for logistics planning, to reflect logistics activities and processes of an enterprise or firm, to depict the company's supply chains, to demonstrate the ways of enhancing the economic stability on the market, to realize logistics reforms and effective products' promotion.
The Best Business Process Modeling Software
ConceptDraw PRO is a best business processes modeling software for graphical documenting processes of the company. ConceptDraw has 142 vector stencils in the 8 libraries that helps you to start using Diagramming Software for designing own Business Process Diagrams.
Amazon Web Services Diagrams diagramming tool for architecture
Amazon Web Services (AWS) offers the reliable and relatively inexpensive cloud computing services. This is the main reason why many large companies prefer to use the Amazon Cloud to storage and operate the data. ConceptDraw PRO diagramming software enhanced with AWS Architecture Diagrams solution provides the powerful AWS diagramming tools to draw the Amazon architecture diagrams and Amazon Web Services planning diagrams, to develop the Architect infrastructure based on AWS in a few minutes. The AWS Architecture Diagrams solution offers variety of built-in samples and templates for several Amazon Web Services products and resources, a wide range of predesigned and recognizable vector graphic icons used for simple designing the Architecture diagrams. The diagrams created in ConceptDraw PRO are professional-looking, helpful when designing and implementing the AWS infrastructure based systems, useful to communicate design, deployment and topology, and apposite for using in presentations, whitepapers, datasheets, posters, and other technical materials you like.How To Make a Concept Map
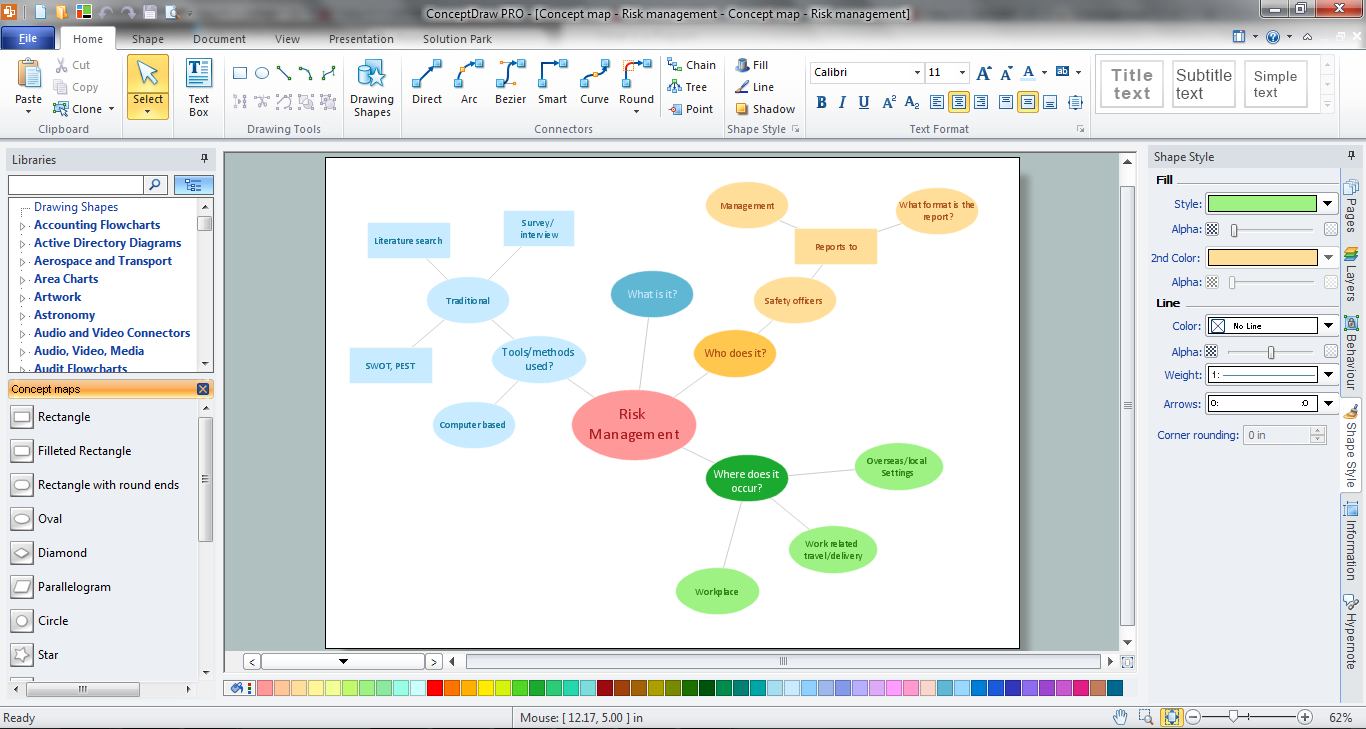
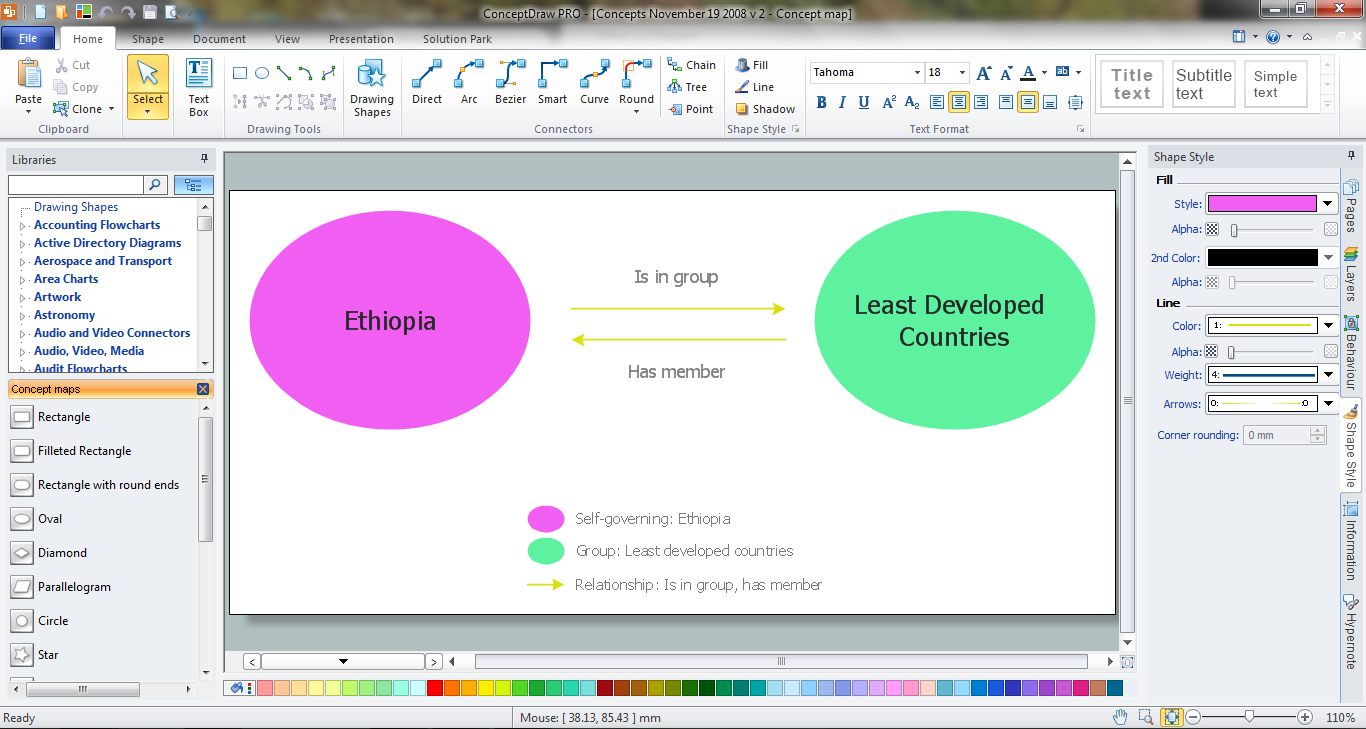
How to make a Concept Map fast and easy? ConceptDraw PRO diagramming and vector drawing software extended with Concept Maps Solution from the "Diagrams" Area is the best choice for those who want design professional looking Concept Map in minutes.Concept Map Maker
ConceptDraw PRO diagramming and vector drawing software extended with Concept Maps Solution from the "Diagrams" Area is a powerful Concept Map Maker.Educational Technology Tools
What are the favorite educational technology tools and techniques for teachers? Of course these are pictures, images and education infographics! ConceptDraw PRO software supplied with Education Infographics Solution from the Business Infographics Area provides powerful drawing tools to help design the education infographics of any complexity.Symboles Organigramme
Les organigrammes sont parfaits pour représenter visuellement des processus operationnels. Par exemple, si vous avez besoin d'afficher le flux d'un processus d'ordre personnalisé par l'entremise de divers opérateurs au sein de votre organisation, vous pouvez utiliser un organigramme. Voir aussi d'autres symboles organigramme: Symboles ordinogramme standard, symboles du flux de travail, Vérification Les symboles du schéma fonctionnel, sOrganigramme comptables des symboles, Organigramme de vente des symboles, Symboles pour organigramme des RH, Carte des symboles de processus, Diagramme de processus opérationnels, Symboles utilisés dans le schéma IDEF0.
 Education Package
Education Package is a comprehensive set of multifarious graphical solutions from ConceptDraw Solution Park, collected together in help to ConceptDraw PRO users working in a field of science, education and training, which is aimed at improving the quality of education and helping to design with ease variety of interesting and colorful educational materials, diagrams, charts and maps. Use it to present the information and knowledge in an interesting, clear, structured and simple form to achieve a success in education and pedagogy, to maintain the interest of students and pupils throughout the whole learning process, at the lectures, lessons and even during independent work with additional materials, to contribute to better perception of scientific information by listeners during the conferences and reports.
- Basic Flowchart Symbols and Meaning | Audit Flowchart Symbols ...
- Geo Map - Europe - France | Flowchart Hexagon
- Data Flow Diagram Symbols. DFD Library | Basic Flowchart ...
- Entity Relationship Diagram Symbols | Basic Flowchart Symbols and ...
- Basic Flowchart Symbols and Meaning | Entity Relationship ...
- Pyramid Diagram | Pyramid Diagram | Process Flowchart | Chart Of ...
- Basic Flowchart Symbols and Meaning | Entity Relationship ...
- Plane geometry - Vector stencils library | Basic Flowchart Symbols ...
- Vicious circle - Crystal diagram | Flowchart Process Example ...
- Ewww Concept Map Of Parrallelogram
- Process Flowchart | Business Process Modeling Software for Mac ...
- Basic Flowchart Symbols and Meaning | Block Diagram Software ...
- Hydraulic schematic | Bank ATM use case diagram | Basic Flowchart ...
- Steps of Accounting Cycle | Flowchart Process Example | Why is it ...
- Process Flowchart | Using Fishbone Diagrams for Problem Solving ...
- Basic Flowchart Symbols and Meaning | Circular diagrams - Vector ...
- Purchasing Flowchart - Purchase Order. Flowchart Examples ...
- Flowchart design. Flowchart symbols, shapes, stencils and icons ...
- Mathematical Diagrams | Mathematics Symbols | Basic Flowchart ...


