This diagram example was redesigned from the Wikimedia Commons file: Operator hierarchy - natural hierarchy rearranged.gif.
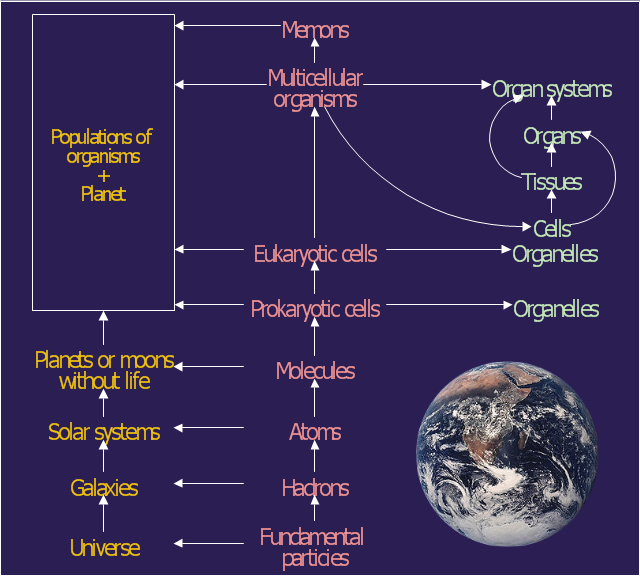
The diagram shows rearrangement of the classical ecological/ system hierarchy. From left to right the columns represent interaction systems, operators and internal differentiations (Gerard Jagers op Akkerhuis).
The diagram was published at page 249 of Jagers op Akkerhuis, G.A.J.M. (2010). The operator hierarchy: a chain of closures linking matter, life and artificial intelligence. PhD thesis Radboud university Nijmegen, the Netherlands: 286 pp.
[commons.wikimedia.org/ wiki/ File:Operator_ hierarchy_ -_ natural_ hierarchy_ rearranged.gif]
The astronomic diagram example "Operator hierarchy - Natural hierarchy rearranged" was created using the ConceptDraw PRO diagramming and vector drawing software extended with the Astronomy solution from the Science and Education area of ConceptDraw Solution Park.
Rearrangement of the classical ecological/system hierarchy
Venn Diagram Examples for Problem Solving. Computer Science. Chomsky Hierarchy

This circular arrows diagram sample shows the process of emergency management involving four phases: Mitigation, Preparedness, Response, and Recovery. It was designed on the base of the webpage "Emergency Management" on the website of the Downey City Hall, California, U.S.
"The process of emergency management involves four phases: Mitigation, Preparedness, Response, and Recovery. ...
Mitigation efforts attempt to prevent hazards from developing into disasters altogether, or to reduce the effects of disasters when they occur. The mitigation phase differs from the other phases because it focuses on long-term measures for reducing or eliminating risk. ...
In the preparedness phase, emergency managers develop plans of action for when the disaster strikes. ...
The response phase includes the mobilization of the necessary emergency services and first responders in the disaster area. This is likely to include a first wave of core emergency services, such as firefighters, police and EMS crews. ...
The aim of the recovery phase is to restore the affected area to its previous state. It differs from the response phase in its focus; recovery efforts are concerned with issues and decisions that must be made after immediate needs are addressed. Recovery efforts are primarily concerned with actions that involve rebuilding destroyed property, re-employment, and the repair of other essential infrastructure."
[downeyca.org/ gov/ emergency/ default.asp]
"Disaster management (or emergency management) is the creation of plans through which communities reduce vulnerability to hazards and cope with disasters. Disaster management does not avert or eliminate the threats; instead, it focuses on creating plans to decrease the effect of disasters. Failure to create a plan could lead to human mortality, lost revenue, and damage to assets. Currently in the United States 60 percent of businesses do not have emergency management plans. Events covered by disaster management include acts of terrorism, industrial sabotage, fire, natural disasters (such as earthquakes, hurricanes, etc.), public disorder, industrial accidents, and communication failures." [Emergency management. Wikipedia]
The arrow circle diagram example "Emergency management process" was created using the ConceptDraw PRO diagramming and vector drawing software extended with the Circular Arrows Diagrams solution from the area "What is a Diagram" of ConceptDraw Solution Park.
Arrow circle diagram
Used Solutions
The vector stencils library "Sales department" contains 49 company department icons.
Use these sales pictograms to draw your sales flowcharts, workflow diagrams and process charts with the ConceptDraw PRO diagramming and vector drawing software.
The vector stencils library "Sales department" is included in the Sales Flowcharts solution from the Marketing area of ConceptDraw Solution Park.
Accounting

Accounts payable

Accounts receivable

Audit

Bank

Board of directors

Copy center

Customer service operator

Customer service technician

Data center

Delivery

Design

Devices management

Distribution

Distribution

Employee

Engineering

Facilities

Finance

Human resource

Devices management

Information systems

International division

International marketing

International sales

Inventory

Legal department

Mail room

Mail service

Management

Manufacturing

Marketing

Motorpool

Online service

Packaging

Payroll

Publications

Purchasing

Quality assurance

Receiving

Reception

Research and development

Sales growth

Scales

Security

Shipping

Suppliers

Telecommunication

Warehouse

The vector stencils library "Value stream mapping" contains 43 VSM symbols.
Use it for drawing value stream maps in the ConceptDraw PRO diagramming and vector drawing software extended with the Value Stream Mapping solution from the Quality area of ConceptDraw Solution Park.
www.conceptdraw.com/ solution-park/ business-value-stream-mapping
Use it for drawing value stream maps in the ConceptDraw PRO diagramming and vector drawing software extended with the Value Stream Mapping solution from the Quality area of ConceptDraw Solution Park.
www.conceptdraw.com/ solution-park/ business-value-stream-mapping
Inventory

Inventory

Information Flow

Shipment

Shipment

Material Flow
Material Pull

FIFO Line
Truck shipment/Logistics

Customer/Supplier

Dedicated Process

Shared Process
Supermarket Parts

Data Box
Workcell

Kaizen Burst

Operator

Other
Production Control
Manual Info

Electronic Information Flow

Production Kanban

Withdrawal Kanban

Signal Kanban
Kanban Post

Sequenced Pull

Load Levelling

MRP/ERP
Go-See

Pull Arrow
Manual Info

Pull Arrow
Timeline Total
Ship
Forklift Truck

Plane

Process with Data
Timeline
Timeline

Supermarket, 2

Supermarket, 3

Safety stock, 2

Safety stock, 3

Venn Diagram Examples for Problem Solving. Venn Diagram as a Truth Table

Business Process Flowchart Symbols

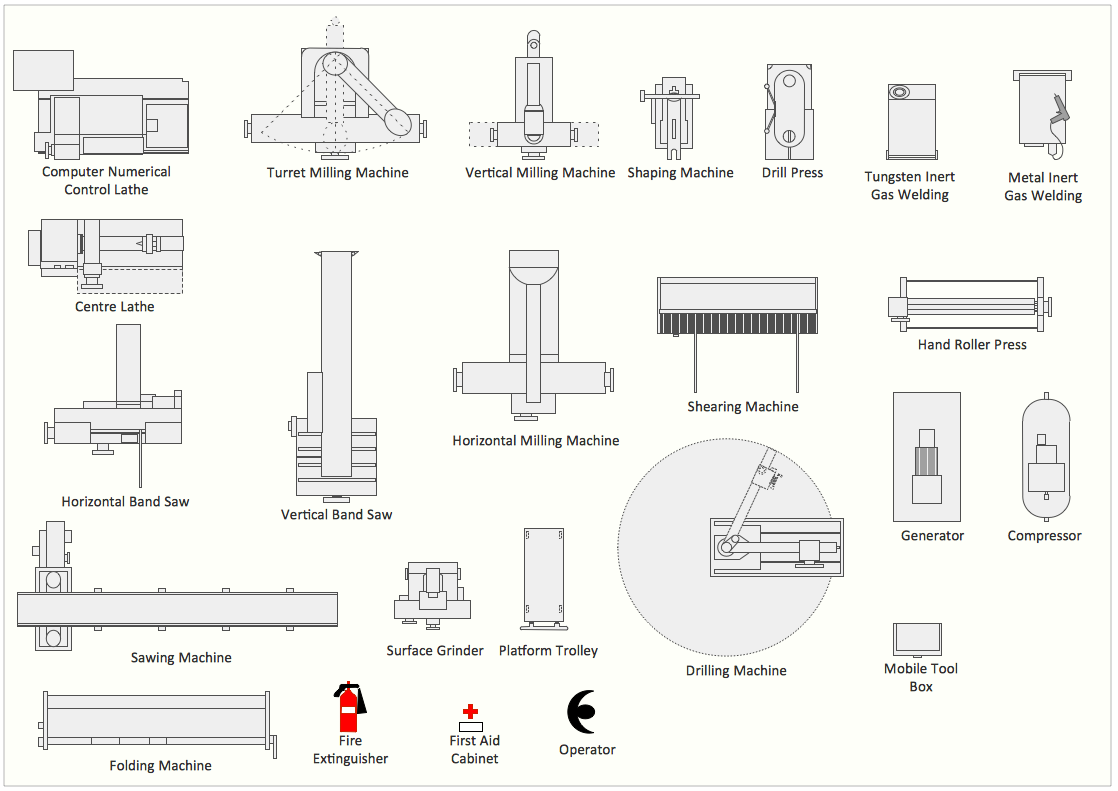
Interior Design Machines and Equipment - Design Elements
Types of Flowcharts


Affinity Diagram

- Operator hierarchy - Natural hierarchy rearranged
- Operator hierarchy - Natural hierarchy rearranged | Astronomy ...
- Proton-proton chain reaction diagram | Operator hierarchy - Natural ...
- Hydraulic schematic | Operator hierarchy - Natural hierarchy ...
- Operator
- Process Flowchart | C N C Machine Operator Codes Symbols Photos
- Emergency management process | Alarm Operator Response
- And Operator
- Plant Operator Pnd Diagram In Oil Ana Gas
- Software Diagram Examples and Templates | Er Diagram Prepaid ...