This site uses cookies. By continuing to browse the ConceptDraw site you are agreeing to our Use of Site Cookies.

How to Create Presentation of Your Project Gantt Chart

During the planning, discussing and execution of a project you may need to prepare a presentation using project views such as the Gantt Chart, Multiproject Dashboard or Resource Usage View. It’s easy do with ConceptDraw PROJECT!

Gantt chart examples

All Gantt charts were made using ConceptDraw PROJECT. ConceptDraw PROJECT works both on Windows and Mac OS X. It allows to schedule a voluntary number of projects in a single Workspace document and lets easily share tasks and resources among them. ConceptDraw PROJECT shares files among Windows and Mac OS X.

What Constitutes a Project?

Separated into categories of Basic, Intermediate, and Advanced categories, the new instructional videos about ConceptDraw PROJECT cover a huge breadth of topics, explaining how to use project management software. Users new to ConceptDraw PROJECT will find the Basic lessons an essential platform for familiarizing themselves with the programs′s functions and found it simple project management software. This video lesson is the first in Basic lessons series tells about affordable simple project management software, it may be used as an intro for what is project management using simple project management sample. ConceptDraw PROJECT is excellent portfolio project management software, this lessons explains how to use project management software for small business in case of multi project environment.
what is software project management

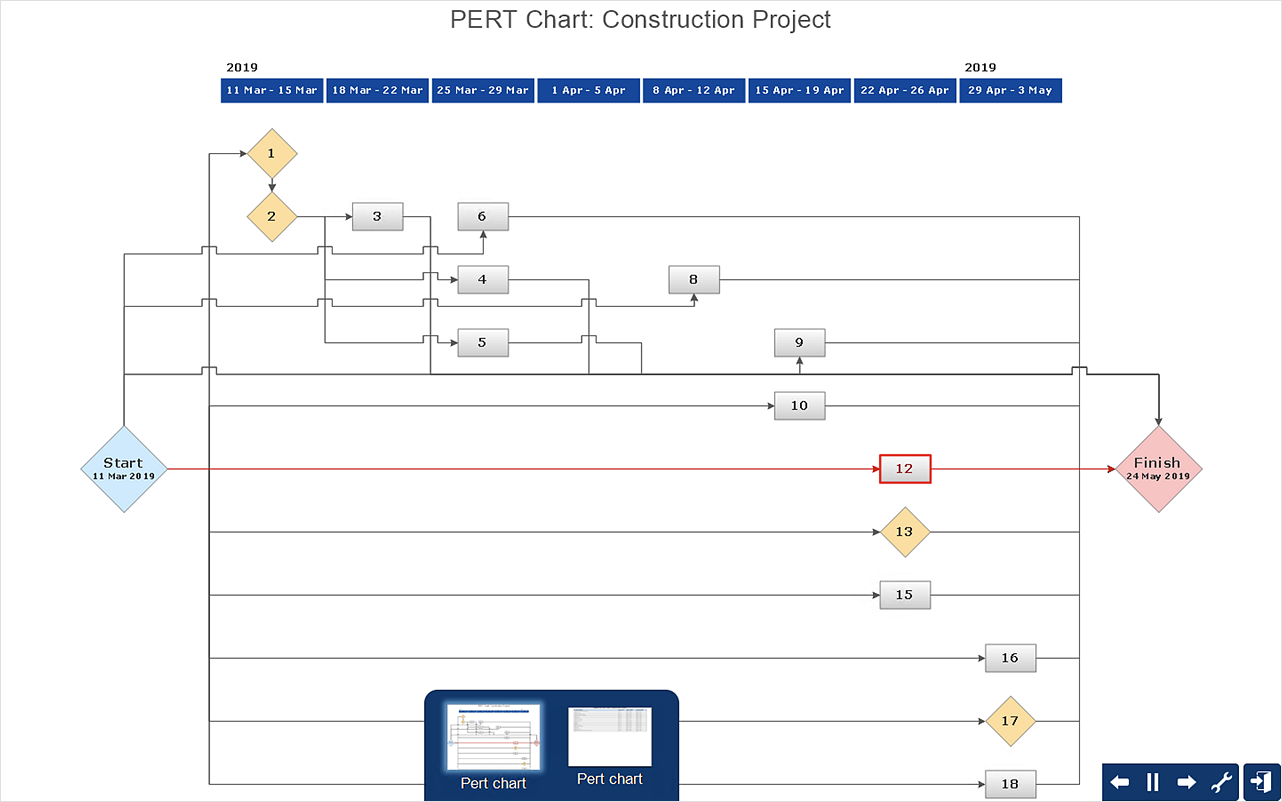
Program Evaluation and Review Technique (PERT) with ConceptDraw DIAGRAM

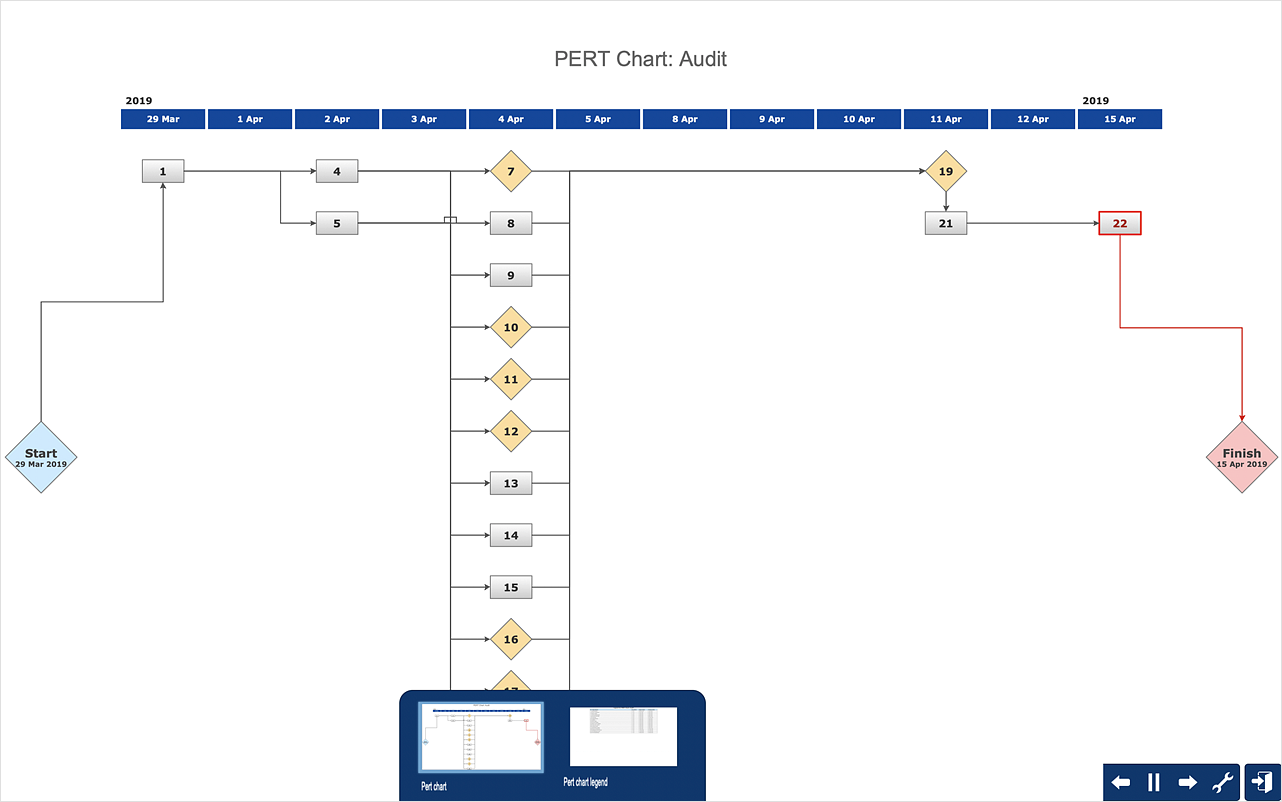
Program Evaluation and Review Technique (abbr. PERT) is a method developed by Ministry of Defense of the USA in 1958 for the project of creation the missile system Polaris. PERT diagram is one of the tools for project management that lets greatly simplify the planning and scheduling of large and complex projects. PERT diagram provides evaluation of project run-time and labor forces, it helps to analyze the time necessary for execution each of project tasks and the whole project, and to calculate the project critical path. PERT chart depicts the set of tasks connected each other in order of their execution and is constructed according to one of definite rules - AOA (activity on arrow) or AON (activity on node). It doesn't give you ready concrete decisions, but helps to find them. Design easy the PERT diagrams in ConceptDraw DIAGRAM software enhanced with Seven Management and Planning Tools solution from Management area of ConceptDraw Solution Park. You have a possibility to build the PERT chart of any type, but AON variant is easier for building and perception.

 pert chart, project management chart, network diagram project management, pert diagram, precedence diagram, project timeline, gantt diagram, project network diagram, gantt chart Project Diagrams

 pert chart, project management chart, network diagram project management, pert diagram, precedence diagram, project timeline, gantt diagram, project network diagram, gantt chart
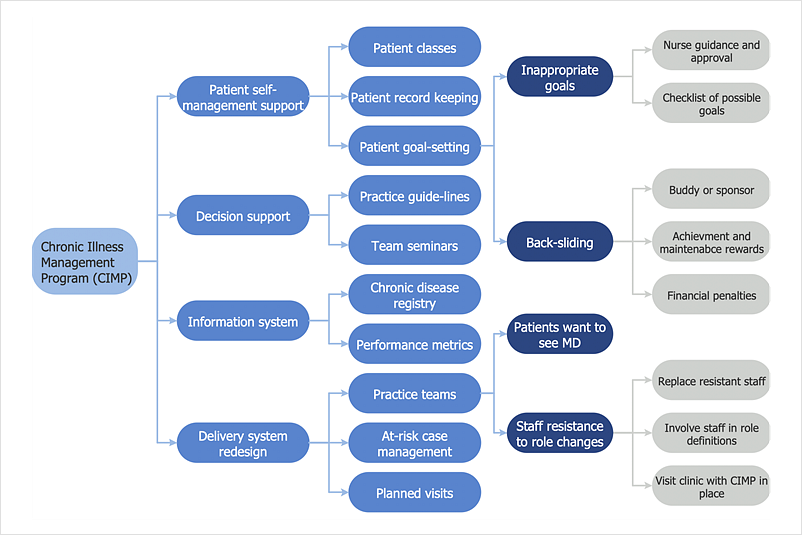
The Project Diagrams solution extends the ConceptDraw DIAGRAM software functionality with special tools, large set of samples pre-made in ConceptDraw DIAGRAM and ConceptDraw MINDMAP, and collection of predesigned vector shapes, arrows, table and frame objects for easy drawing the Project Diagrams of different kinds, Hierarchical Charts, Influence Diagrams, Work Breakdown Structures (WBS), Organization Breakdown Structures (OBS), and Resource Breakdown Structures (RBS), PERT Chart or PERT Diagram, Project Management Chart, Project Network Diagram, Network Diagram Project Management, Project Timeline, Precedence Diagram, Gantt Diagram or Gantt Chart. Plan your project, visualize the main stages, and track your project’s implementation effectively with ConceptDraw DIAGRAM. Use also ability to autogenerate Project Diagrams from ConceptDraw MINDMAP to ConceptDraw DIAGRAM.

project management, scrum, agile, business Project Management Package

project management, scrum, agile, business
Project Management Package includes a large set of graphical solutions from the ConceptDraw Solution Park. They are selected specially to help in completing the business and management goals, creating business models and modeling business processes, analyzing business progress and efficiency of projects implementation. The tools of this package's solutions are helpful to create number of diagrams and dashboards including Management Diagrams, Business diagrams, Bubble diagrams, Circle-spoke diagrams, Circular arrows diagrams, Venn diagrams, Scrum charts, Kanban boards, Business Intelligence maps, Business Metric charts, Dynamic charts, Project diagrams, Hierarchical charts, Influence diagrams, Work Breakdown Structures (WBS), Resource Breakdown Structures (RBS), PERT Diagrams, Project management charts, Project timelines, Gantt Charts, Funnel diagrams, Stakeholder Onion diagrams, and many more.

Managing the task list

Four lessons explaining how to manage your task list in a Gantt chart. You will learn how to adjust your Gantt chart view, how to add/delete tasks or subtasks, how to change tasks hierarchy, how to show/hide subtasks.

Business diagrams & Org Charts with ConceptDraw DIAGRAM

The business diagrams are in great demand, they describe the business processes, business tasks and activities which are executed to achieve specific organizational and business goals, increase productivity, reduce costs and errors. They let research and better understand the business processes. ConceptDraw DIAGRAM is a powerful professional cross-platform business graphics and business flowcharting tool which contains hundreds of built-in collections of task-specific vector stencils and templates. They will help you to visualize and structure information, create various Business flowcharts, maps and diagrams with minimal efforts, and add them to your documents and presentations to make them successful. Among them are Data flow diagrams, Organization charts, Business process workflow diagrams, Audit flowcharts, Cause and Effect diagrams, IDEF business process diagrams, Cross-functional flowcharts, PERT charts, Timeline diagrams, Calendars, Marketing diagrams, Pyramids, Target diagrams, Venn diagrams, Comparison charts, Analysis charts, Dashboards, and many more. Being a cross-platform application, ConceptDraw DIAGRAM is very secure, handy, free of bloatware and one of the best alternatives to Visio for Mac users.
Draw Business Process Diagrams

PERT Chart Software

PERT Chart Software - Activity Network and Project Evaluation and Review Technique, or PERT, charts are a way of documenting and analyzing the tasks in a project. ConceptDraw DIAGRAM is a powerful diagramming and vector drawing software for designing professional looking PERT Charts quick and easy.

PERT Chart

A PERT (Program Evaluation Review Technique) Chart is a popular project management tool that is used to represent all tasks required to be performed for the successful project’s complete. This technique was developed to greatly simplify the planning and scheduling of complex projects. The large projects involve the phases consisting of numerous tasks, the tasks are usually of different types, there can be the parallel tasks among which are executed simultaneously and not dependent on the completion of other tasks. However, the most part of tasks depends on the execution of the rest and so must be completed in a certain sequence, which is clearly visible on a PERT Chart.

ConceptDraw PROJECT Project Management Software Tool

ConceptDraw PROJECT is simple project management software. If you are on the fast track in your career and start facing such challenges as coordination many people, coordination tasks and works, manage project with a great deal of time and money involved - it is the right time to get Project management tool involved in your work.

Gantt charts for planning and scheduling projects

ConceptDraw PROJECT is an excellent simple project scheduling software. It maintain classic project gantt charts and the line of professional reports on resources usage. It include handy critical path scheduling software tools and diagraming tools which helps prepare the presentation of project status. It include project tracking dashboard to keep project metrics upto date, also it have handy feature to export project management dashboard in excel file.

Examples of Flowcharts, Org Charts and More

ConceptDraw DIAGRAM covers a broad spectrum of business graphics categories and offers at ConceptDraw STORE enormous online collection of pictorial examples and samples for different thematics and application areas. It is a plentiful source of inspiration and wonderful examples of professionally designed diagrams, flowcharts, UML diagrams, organizational charts, databases, ERDs, network diagrams, business charts, different thematic charts, schematics, infographics and plans developed specially for knowledge workers, engineers, managers, businessmen, marketing specialists, analytics, scientists, students, professors, journalists and also for a large number of other people that every day use various diagrams and drawings in their work and life activity. Each of these examples is a real art, all they are well thought-out and designed without efforts with help of powerful tools of ConceptDraw DIAGRAM software. ConceptDraw examples display all variety of tasks, possibilities and results that ConceptDraw Product Line lets achieve fast and easy. ConceptDraw is one of the best Visio alternatives for Mac. It open all Visio formats like.vsdx,.vss,.vdx files and allows you to export files to Visio formats.
What is ConceptDraw OFFICE

How to Report Task's Execution with Gantt Chart

ConceptDraw PROJECT’s powerful reporting engine lets you generate a set of tabular reports with just one click, or visualize your project as Radial Tasks Structures, Work Breakdown Structures and Resource Calendars. It also provides you with dynamic Project Dashboards.

How to Discover Critical Path on a Gantt Chart

ConceptDraw PROJECT is the Gantt chart software that implements critical path method to provide the user with a wide set of project management tools.
"Project planning is part of project management, which relates to the use of schedules such as Gantt charts to plan and subsequently report progress within the project environment.
Initially, the project scope is defined and the appropriate methods for completing the project are determined. Following this step, the durations for the various tasks necessary to complete the work are listed and grouped into a work breakdown structure. Project planning is often used to organize different areas of a project, including project plans, work loads and the management of teams and individuals. The logical dependencies between tasks are defined using an activity network diagram that enables identification of the critical path. Float or slack time in the schedule can be calculated using project management software. Then the necessary resources can be estimated and costs for each activity can be allocated to each resource, giving the total project cost. At this stage, the project schedule may be optimized to achieve the appropriate balance between resource usage and project duration to comply with the project objectives. Once established and agreed, the project schedule becomes what is known as the baseline schedule. Progress will be measured against the baseline schedule throughout the life of the project. Analyzing progress compared to the baseline schedule is known as earned value management.
The inputs of the project planning phase include the project charter and the concept proposal. The outputs of the project planning phase include the project requirements, the project schedule, and the project management plan." [Project planning. Wikipedia]
The flow chart example "Project planning process" was created using the ConceptDraw PRO diagramming and vector drawing software extended with the Flowcharts solution from the area "What is a Diagram" of ConceptDraw Solution Park.
Flowchart - Project planning process
Flowchart - Project planning process, terminator, process,
Used Solutions

Project — Working With Tasks

A full-featured project management solution with all the necessary functions right at your fingertips. Generates an extensive variety of reports on project and task statuses. These videos provide a series of lessons that will enhance the understanding of all our users, from people just starting out with the software, through to expert users.

Product Overview

The role of ConceptDraw MINDMAP is to organize and plan idea development and communicate between process participants. Mind maps are convenient to prepare presentations for team and management and send task lists and related information.