DroidDia PRO unlocker
Droiddia allows you to make flow charts org charts venn diagrams mindmaps and do other diagrams with no constrains and as little effort as possible.The vector stencils library "Cisco people" contains 17 pictogram symbols and clipart icons of people for drawing Cisco computer network diagrams.
The symbols example "Cisco people - Vector stencils library" was created using the ConceptDraw PRO diagramming and vector drawing software extended with the Cisco Network Diagrams solution from the Computer and Networks area of ConceptDraw Solution Park.
www.conceptdraw.com/ solution-park/ computer-networks-cisco
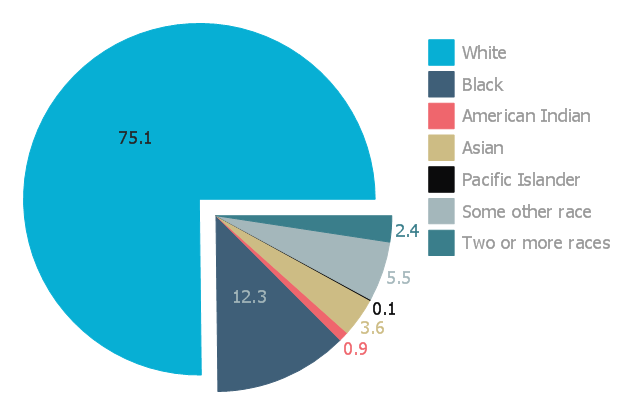
This exploded pie chart sample shows the racial make-up of the U.S. in 2000. It was designed on the base of the Wikimedia Commons file: Percentages of the us population by race - 2000.png.
[commons.wikimedia.org/ wiki/ File:Percentages_ of_ the_ us_ population_ by_ race_ -_ 2000.png]
"The United States Census Bureau defines White people as those having origins in any of the original peoples of Europe, the Middle East, or North Africa. It includes people who reported "White" or wrote in entries such as Irish, German, Italian, Lebanese, Near Easterner, Arab, or Polish. Whites constitute the majority of the U.S. population, with a total of about 245,532,000 or 77.7% of the population as of 2013. There are 62.6% Whites when Hispanics who describe themselves as "white" are taken out of the calculation. Despite major changes due to illegal and legal immigration since the 1960s and the higher birth-rates of nonwhites, the overall current majority of American citizens are still white, and English-speaking, though regional differences exist." [Demography of the United States. Wikipedia]
The exploded pie chart example "Percentages of the U.S. population by race" was created using the ConceptDraw PRO diagramming and vector drawing software extended with the Pie Charts solutiton of the Graphs and Charts area in ConceptDraw Solution Park.
The vector stencils library "Professions" contains 58 people clipart images of different professions you can use in your presentations, illustrations and infographics.
"Electronic clip art is available in several different file formats. It is important for clip art users to understand the differences between file formats so that they can use an appropriate image file and get the resolution and detail results they need.
Clip art file formats are divided into 2 different types: bitmap or vector graphics. ...
In contrast to the grid format of bitmap images, Vector graphics file formats use geometric modeling to describe an image as a series of points, lines, curves, and polygons. Because the image is described using geometric data instead of fixed pixels, the image can be scaled to any size while retaining "resolution independence", meaning that the image can be printed at the highest resolution a printer supports, resulting in a clear, crisp image. Vector file formats are usually superior in resolution and ease of editing as compared to bitmap file formats, but are not as widely supported by software and are not well-suited for storing pixel-specific data such as scanned photographs. In the early years of electronic clip art, vector illustrations were limited to simple line art representations." [Clip art. Wikipedia]
The clip art example "Professions - Vector stencils library" was created using the ConceptDraw PRO diagramming and vector drawing software extended with the People solution from the Illustration area of ConceptDraw Solution Park.
www.conceptdraw.com/ solution-park/ illustrations-people
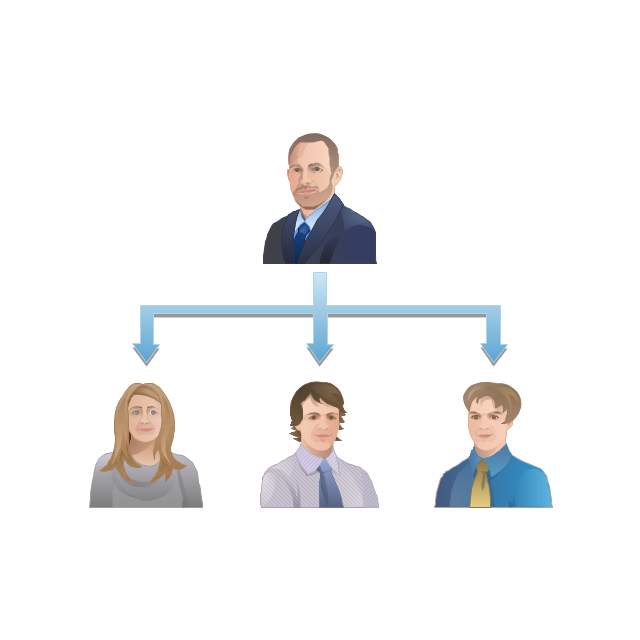
The vector stencils library "Business people" contains 36 business people icons.
Use it to design your business and finance illustrations and infographics with ConceptDraw PRO diagramming and vector drawing software.
The vector stencils library "Business people" is included in the Business and Finance solution from the Illustration area of ConceptDraw Solution Park.
Use it to design your business and finance illustrations and infographics with ConceptDraw PRO diagramming and vector drawing software.
The vector stencils library "Business people" is included in the Business and Finance solution from the Illustration area of ConceptDraw Solution Park.
The vector stencils library "People pictograms" contains 20 icons of men and women symbols. Use it to draw your pictorial infograms. The example "People pictograms - Vector stencils library" was created using the ConceptDraw PRO diagramming and vector drawing software extended with the Pictorial infographics solution from the area "What is infographics" in ConceptDraw Solution Park.
 iPhone User Interface
iPhone User Interface solution extends ConceptDraw PRO v10 software with templates, samples and libraries with large quantity of vector stencils of graphical user interface elements, Apps icons, UI patterns for designing and prototyping of the iOS applic
The vector stencils library "People" contains 49 people clipart images and figures you can use in your presentations, illustrations and infographics.
"Clip art, in the graphic arts, refers to pre-made images used to illustrate any medium. Today, clip art is used extensively in both personal and commercial projects, ranging from home-printed greeting cards to commercial candles. Clip art comes in many forms, both electronic and printed. However, most clip art today is created, distributed, and used in an electronic form. Since its inception, clip art has evolved to include a wide variety of content, file formats, illustration styles, and licensing restrictions. Clip art is generally composed exclusively of illustrations (created by hand or by computer software), and does not include stock photography." [Clip art. Wikipedia]
The clip art example "People - Vector stencils library" was created using the ConceptDraw PRO diagramming and vector drawing software extended with the People solution from the Illustration area of ConceptDraw Solution Park.
www.conceptdraw.com/ solution-park/ illustrations-people
The vector stencils library "Business people pictograms" contains 14 icons of business people.
Use it to draw your pictorial infographics.
The example "Business people pictograms - Vector stencils library" was created using the ConceptDraw PRO diagramming and vector drawing software extended with the Pictorial infographics solution from the area "What is infographics" in ConceptDraw Solution Park.
The vector stencils library "Workflow diagrams" contains 54 symbol icons of workflow diagrams.
The workflow diagrams represent information flow, automation of business processes, business process re-engineering, accounting, management, and human resources tasks in industry, business, and manufacturing.
Use this library to draw workflow diagrams in the ConceptDraw PRO diagramming and vector drawing software extended with the Workflow Diagrams solution from the Business Processes area of ConceptDraw Solution Park.
www.conceptdraw.com/ solution-park/ business-process-workflow-diagrams
The vector stencils library "Scrum workspace" contains 21 icons.
Use this clipart set to design your agile software development diagrams and infographics with ConceptDraw PRO software.
"... a list of all the things that ... should be visible within the ideal agile workspace:
Big Visible Charts. ... the sprint burndown chart, showing the number of hours remaining as of each day of the current sprint. ... big visible charts showing the number of passing customer acceptance tests, the pass/ fail status of tests by day, sprint and release burndown charts, number of new stories introduced to the product backlog per sprint, and more.
Additional feedback devices. In addition to big, visible charts, it is common for an agile team to use additional visual feedback devices in their workspace. One of the most common is a lava lamp that is turned on whenever the automated build is broken.
... flashing red traffic lights to indicate exceptional conditions such as an issue on a production server. Also popular are ambient orbs and Nabaztag rabbits, which are wireless programmable devices that can also be configured to change colors, speak messages, or wiggle their ears as a team desires. ...
Everyone on your team. Each person on the team should ideally be able to see each other person on the team. This absolutely includes the ScrumMaster and ideally includes the product owner. ...
The sprint backlog. One of the best ways to ensure that everything necessary is completed in the sprint is to make the sprint backlog visible. The best way to do that is by displaying the sprint backlog on a wall, ideally in the form of a task board ...
The product backlog. One problem with running an endless series of sprints is that each can feel disconnected or isolated from the whole of a planned released or related set of new capabilities. A good way to reduce the impact of this problem is by displaying the product backlog somewhere clearly visible. ... tack the index cards with those upcoming user stories on a wall where all can see them. This allows team members to see how the user stories they are working on in the current sprint relate to others that are coming soon.
At least one big white board. ... Locating this in the team’s common workspace encourages spontaneous meetings." [mountaingoatsoftware.com/ blog/ the-ideal-agile-workspace]
The clip art sample "Design elements - Scrum workspace" is included in the Scrum solution from the Project Management area of ConceptDraw Solution Park.
- Man Png Clipart Black And White
- People pictograms - Vector stencils library | Cisco people - Vector ...
- People pictograms - Vector stencils library | People pictograms ...
- Symbol Email Transparent Png
- Flowchart design. Flowchart symbols, shapes, stencils and icons ...
- Project Management Icon Vector Png
- Person Vector Png
- Human Resources Vector Icon Png
- Winner Icon Png
- Business people pictograms - Vector stencils library | Process ...
- Percentage Chart Png
- Courier Icon Png
- Person Icon Png Transparent
- Cisco People . Cisco icons , shapes, stencils and symbols | Design ...
- Png Vector Graphics People
- Business Vector Png
- White Location Icon Png
- Professions - Vector stencils library | People - Vector stencils library ...
- Mobile Image Reader Green Icon Png
- People pictograms - Vector stencils library | People pictograms ...
.jpg)

