Root Cause Tree Diagram

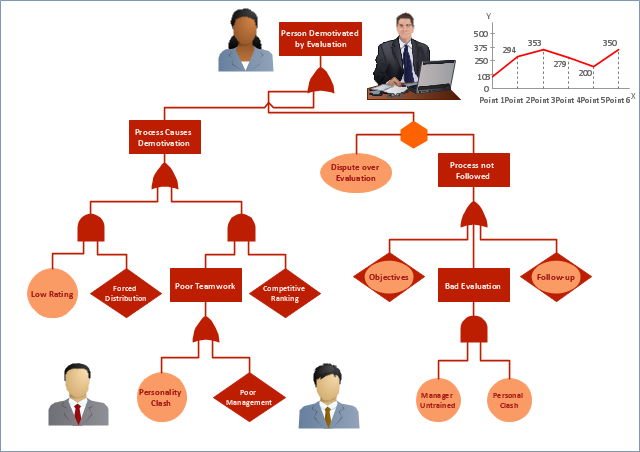
 Fault Tree Analysis Diagrams
This solution extends ConceptDraw DIAGRAM.5 or later with templates, fault tree analysis example, samples and a library of vector design elements for drawing FTA diagrams (or negative analytical trees), cause and effect diagrams and fault tree diagrams.
HelpDesk
How To Create Root Cause Analysis Diagram Using Solutions

Process Flowchart


Root Cause Tree Diagram
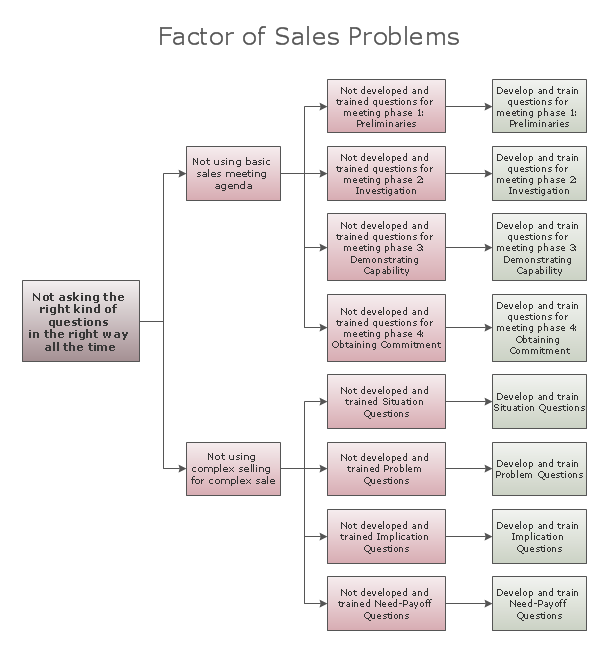
"Process Decision Program Chart (PDPC).
A useful way of planning is to break down tasks into a hierarchy, using a tree diagram. The PDPC extends the tree diagram a couple of levels to identify risks and countermeasures for the bottom level tasks. Different shaped boxes are used to highlight risks and identify possible countermeasures (often shown as 'clouds' to indicate their uncertain nature). The PDPC is similar to the Failure Modes and Effects Analysis (FMEA) in that both identify risks, consequences of failure, and contingency actions; the FMEA also rates relative risk levels for each potential failure point." [Seven Management and Planning Tools. Wikipedia]
The Risk diagram (process decision program chart, PDPC) determines the risks when corrective action is not performed correctly. Also, it helps develop descriptions for preventive actions at the level of execution.
The Risk diagram (PDPC) template for the ConceptDraw PRO diagramming and vector drawing software is included in the solution "Seven Management and Planning Tools" from the Management area of ConceptDraw Solution Park.
Risk diagram
---template.png--diagram-flowchart-example.png)
Fault tree analysis diagrams solution extends ConceptDraw PRO software with templates, samples and library of vector stencils for drawing the FTA diagrams.
Fault Tree
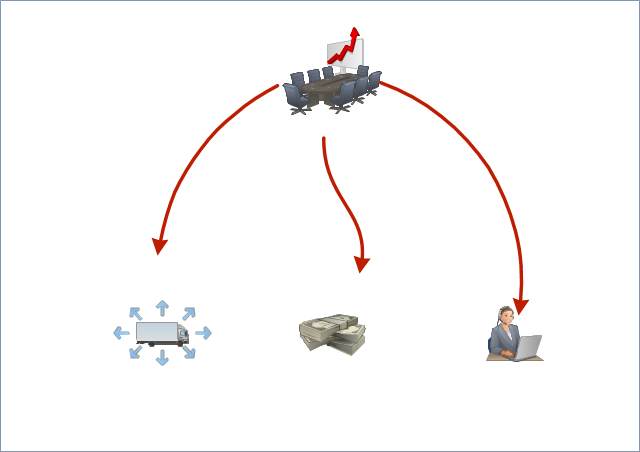
Workflow
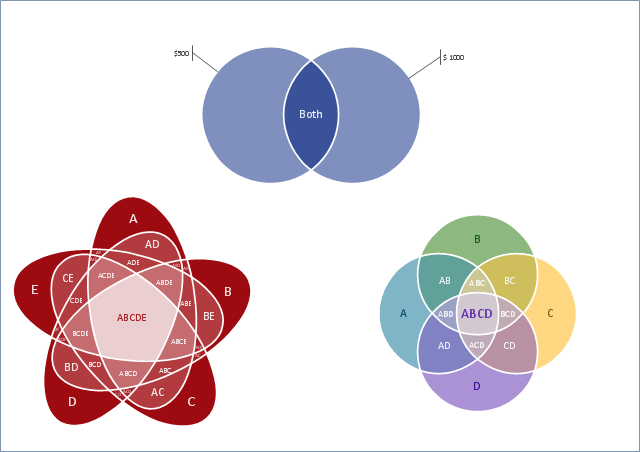
Cash Venn
Used Solutions
 Word Exchange
This solution extends ConceptDraw MINDMAP software with the ability to quickly create the framework for a future article or book, fill the structure with ideas, and use it to produce an MS Word document with just a simple click of the mouse.
Context Diagram Template

This template shows the Context Diagram. It was created in ConceptDraw DIAGRAM diagramming and vector drawing software using the Block Diagrams Solution from the “Diagrams” area of ConceptDraw Solution Park. The context diagram graphically identifies the system. external factors, and relations between them. It’s a high level view of the system. The context diagrams are widely used in software engineering and systems engineering for designing the systems that process the information.
Chemical Engineering

- Fault Tree Analysis Diagrams | Word Exchange | Sport Field Plans ...
- Word Tree Generator Linguistics
- Tree Diagram Examples Word
- Draw Tree Diagram Word
- Affinity Diagram | Affinity Diagram | Root Cause Tree Diagram ...
- macOS User Interface | Chess | Word Exchange | Create Folder Tree ...
- Tree Diagram Word
- How to Create a Fault Tree Analysis Diagram (FTD) in ConceptDraw ...
- Free Sentence Diagrammer | Sentence Diagram | Tree Diagrams ...