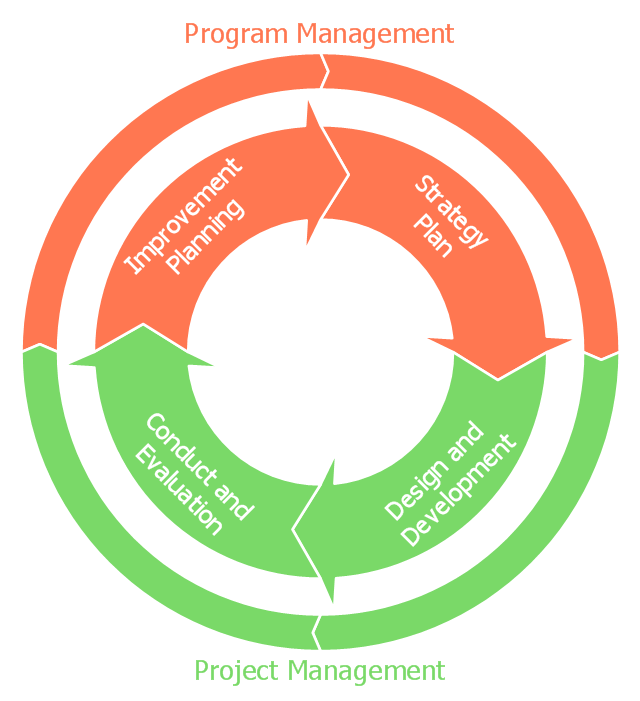
Pyramid Diagram. Project Management Triangle
Pyramid Diagrams. Project management triangle diagramCollaborative Project Management via Skype. Organize and Run
Collaborative Project Management via Skype mind map - ConceptDraw MINDMAP example
 Seven Management and Planning Tools. ConceptDraw.com
Seven Management and Planning Tools solution extends ConceptDraw PRO
and ConceptDraw MINDMAP with features, templates, samples and libraries of
Bar Diagrams for Problem Solving. Business Management
Bar Diagrams for Problem Solving - business management bar charts
 Business Package for Management . ConceptDraw.com
Business Package for Management . 20 solutions, 86 libraries, 2 035 vector
stensils and icons, 269 examples and templates. Graphics Package includes
Software Work Flow Process in Project Management with Diagram
Software Work Flow Process in Project Management with Diagram
 Total Quality Management Diagrams Solution. ConceptDraw.com
Total Quality Management Diagrams solution extends ConceptDraw PRO
software with samples, templates and vector stencils library for drawing the TQM
Quality Project Management with Mind Maps. The best Quality Mind
Mindmap template - Problem to be solvedTypes of Flowchart - Overview
Whether you need to show the relationship between some business process and responsible people for managing it correctly, structure the departments and improve your productivity, ConceptDraw PRO is always there for you as it was created especially for such purposes. There are many types of flowcharts nowadays that you can make using this software such as: basic, process, document, program, system, highlight one, sales charts and IDEF, as well as cross functional, procedure or data flow, SDL and workflow diagrams. Creating nicely looking flowcharts is simple with help of pre-made examples and layouts which are important part of the extension called Solution park. Draw your own sales processes, information flow charts, business process automation or re-engineering, use it in accounting, management or human resources and feel the difference to if you made boring reports with no charts. To trace documentation movement such as payroll information or interoffice mails, to show the relation between major parts of same system or systems, to picture and understand the process of making goods or services, to describe efficiency or manage the transport logistics – flowcharts are the best solution for that and the best software for making them is ConceptDraw PRO. Try it and you’ll be satisfied!Disaster management does not avert or eliminate the threats; instead,
Wikipedia] The diagram example "Emergency management exercise cycle" was
created
Organizational Structure Total Quality Management . Total Quality
Organizational Structure Total Quality Management- Manufacturing 8 Ms fishbone diagram - Template | Management ...
- Human Resource Development | HR Flowcharts | Gant Chart in ...
- Bar Diagrams for Problem Solving. Create event management bar ...
- HR management process - Flowchart | Types of Flowchart ...
- Total Quality Management TQM Diagrams | Pyramid Diagram | TQM ...
- Basic Flowchart Symbols and Meaning | Project management life ...
- Fish Bone Diagram In Quality Management
- Sales Process Management | Copying Service Process Flowchart ...
- Dashboard Project Management Kpi
- Chart Of Management Information System With Diagram
- Block Diagram For Library Management System
- Conceptdraw.com: Mind Map Software, Drawing Tools | Project ...
- Project management life cycle - Flowchart | Basic Flowchart Symbols ...
- Seven Management and Planning Tools | 7 Management ...
- State Diagram Example - Online Store | Stakeholder Management ...
- Total Quality Management Value | Probability Quality Control Tools ...
- Workflow Management Systems
- HR Flowcharts | HR Management Software | HR management ...
- Seven Management and Planning Tools | Seven Basic Tools of ...
- Project Management Dashboards Examples


