 Timeline Diagrams Solution. ConceptDraw.com
Timeline Diagrams solution extends ConceptDraw DIAGRAM diagramming
software with samples, templates and libraries of specially developed smart
vector
HelpDesk
Creating a Timeline Diagram. ConceptDraw HelpDesk
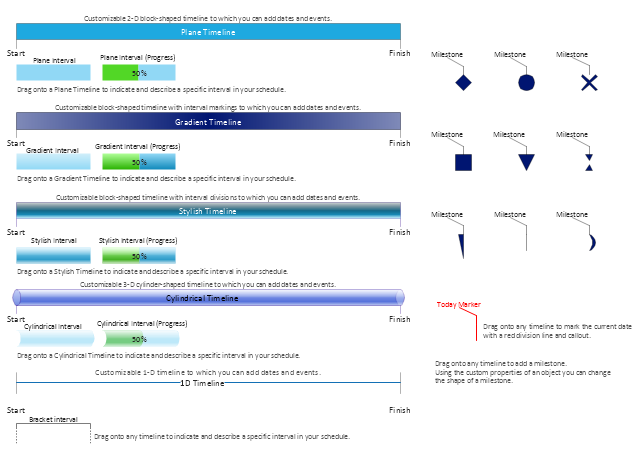
A Timeline is a chart which displays a project plan schedule in chronological order. A Timeline is used in project management to depict project milestones andThe vector stencils library " Timelines and milestones" contains 24 shapes of time
scales with start and finish dates, time interval bars with progress indication
Timeline charts presents events and time periods on a chronological scale. They
are used in project management to visualize project milestones and upper level
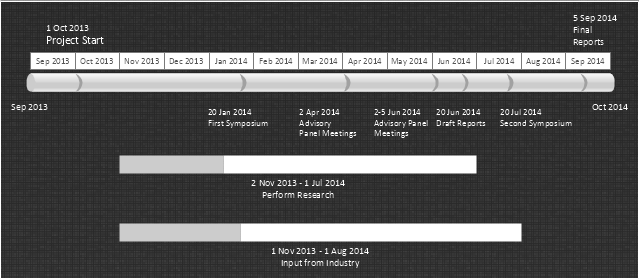
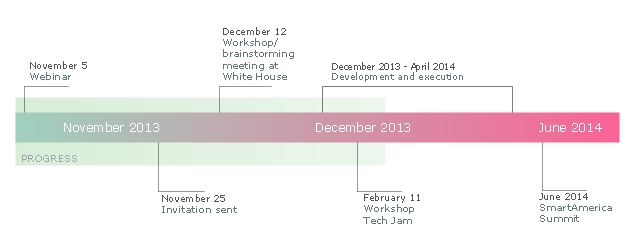
This sample was created on the base of the figure illustrating the webpage "
SmartAmerica Challenge Timeline " from the website of the National Institute of
Timeline charts presents events and time periods on a chronological scale. They
are used in project management to visualize project milestones and upper level
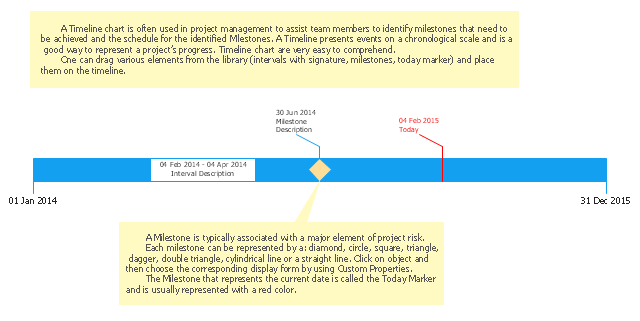
The vector stencils library " Timelines and milestones" contains 24 shapes of
timelines , time intervals, milestones. Use it for drawing timeline and milistone
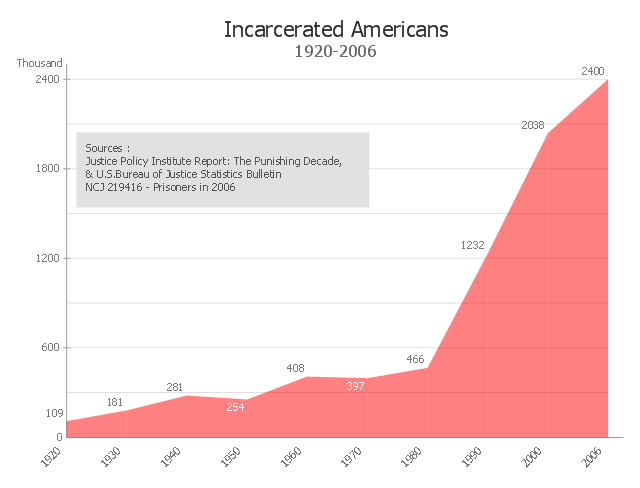
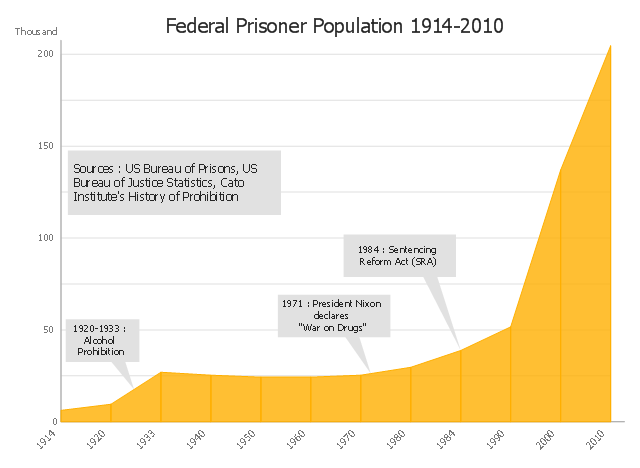
[commons.wikimedia.org/wiki/File:Federal_timeline_US_prisoners.gif] The area
chart example "Federal timeline US prisoners" was created using the
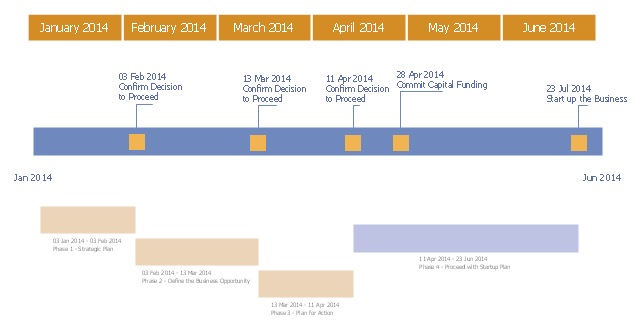
Wikipedia] The timeline diagram example "New business project plan" was
with the Timeline Diagrams solution from the Management area of ConceptDraw
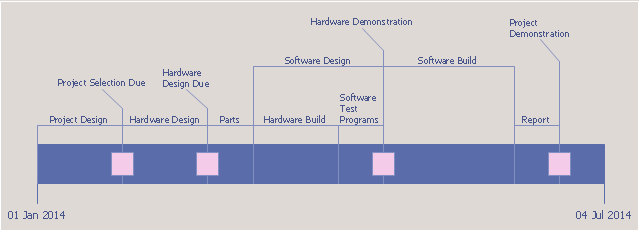
Wikipedia] The project plan timeline diagram example "Request for proposal
extended with the Timeline Diagrams solution from the Management area of
Wikipedia] The timeline diagram example "Project schedule" was created using
the Timeline Diagrams solution from the Management area of ConceptDraw
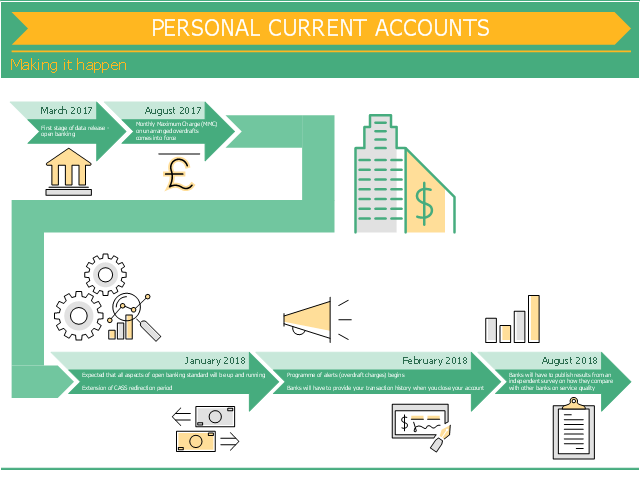
[Personal account. Wikipedia] The finance infographic sample "Personal current
accounts timeline " was designed using ConceptDraw PRO software extended
What is the project timeline and when will particularly meaningful points, referred
to as milestones, be complete?" [Project plan. Wikipedia] The timeline diagram
Timeline charts presents events and time periods on a chronological scale. They
are used in project management to visualize project milestones and upper level
This area chart sample shows the timeline of total number of inmates in U.S.
prisons, jails, and juvenile facilities from 1920 to 2006. It was redesigned from the
- Business Process Mapping — How to Map a Work Process | How to ...
- CS Odessa Has Updated Timeline Diagrams Solution for ...
- Project Timeline | Timeline Diagrams | Timeline Examples | Visio ...
- Timeline Diagrams | Line Graphs | Basic Line Graphs | Time Line ...
- How to Create a Timeline Diagram | Project Timeline | How to Make ...
- Timeline Diagrams | Time Line Chart For Library Management System
- Timeline Examples | Project Timeline | Timeline Diagrams | Visio ...
- Timeline Diagrams | Fishbone Diagrams | Draw Timeline And ...
- Project Timeline | Timeline Examples | How to Make a Timeline ...
- Fishbone Diagrams | How Is A Timeline Graph Applied To Problem ...
- Timeline Diagrams | How to Create a Timeline Diagram | How to ...
- Timeline Examples | Project Timeline | How to Make a Timeline ...
- Timeline Chart In Software Engineering
- Project Timeline | How to Create a Timeline Diagram | Timeline ...
- Project Timeline | How to Make a Timeline | Timeline Diagrams ...
- Timeline Diagrams | Cafe and Restaurant Floor Plans | Business ...
- How to Create a Timeline Diagram in ConceptDraw PRO | Timeline ...
- ATM Sequence diagram | ATM UML Diagrams | Timeline Diagrams ...
- Project Timeline | Timeline Examples | Timeline Diagrams ...
- Timeline diagram | Project timeline diagram | Timeline Diagrams ...




.png--diagram-flowchart-example.png)
