ConceptDraw PROJECT is a comprehensive multi-project software tool, available for Windows and macOS. PROJECT is well equipped for managing projects, tasks, and resources. It is easy to learn and use. The main force of PROJECT is visual tools. If you want to experience the full functionality and benefits of ConceptDraw PROJECT, you need to use it in conjunction with MINDMAP and DIAGRAM. ConceptDraw PROJECT provides a full visibility of all the essential elements of your project and ensures your control over resources and budget.
Multi-Project Dashboard
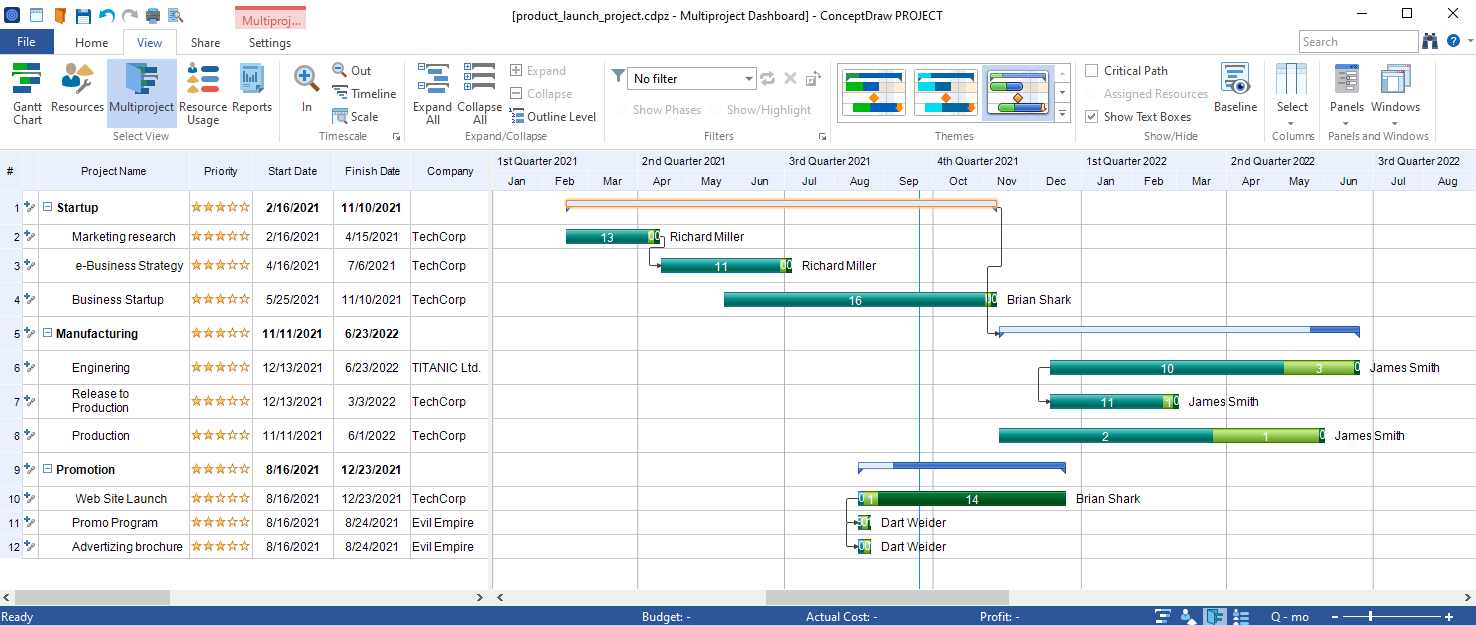
A multi-project workspace allows you to manage multiple projects from a single file. You can group and establish links between projects to better organize a complex project structure.
Gantt Chart
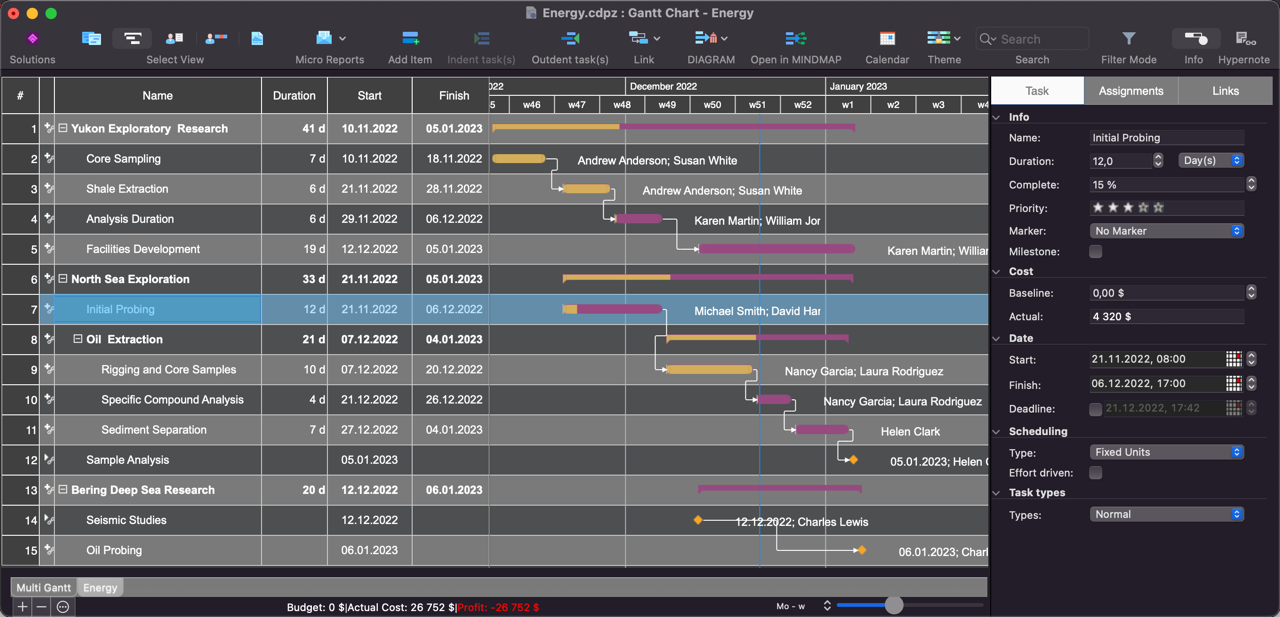
Gantt Chart view allows you to allocate tasks, assign resources and manage their overloading in a simple graphic format.
Resources Allocation and Resource Usage Tracking
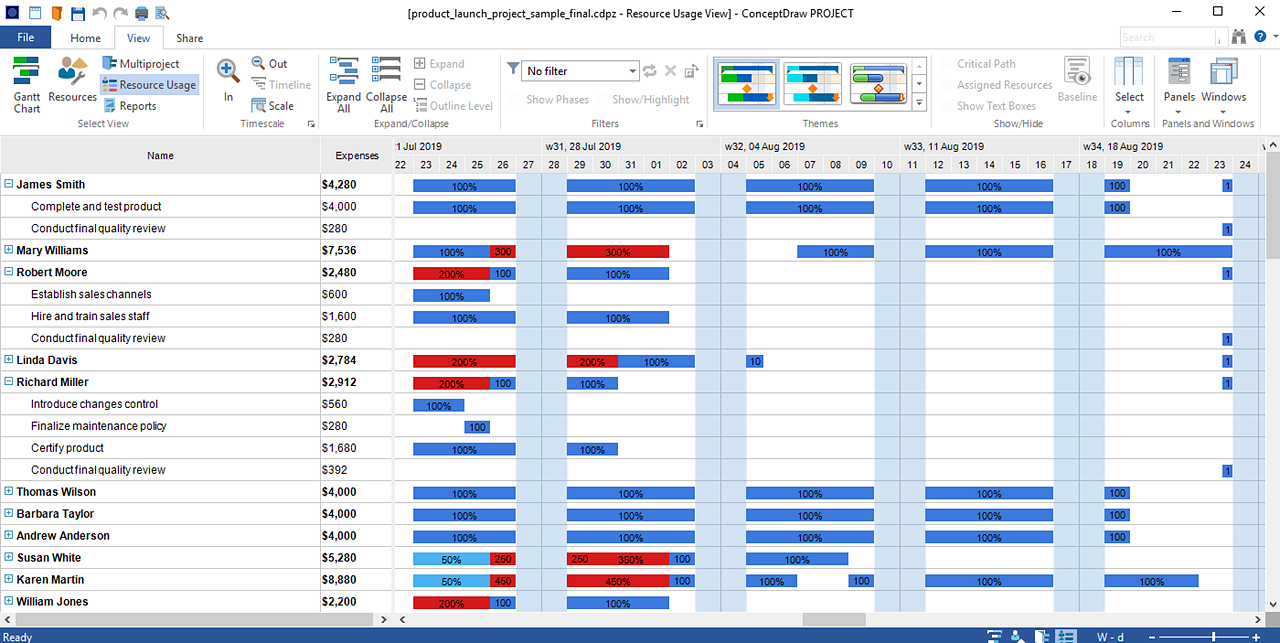
Resource List stores the complete information on overall resources (human, material and financial) available to assign in multiple projects. In the Resource Usage view, the loads and availability of resources of all types (human, material and financial) contained in the resource list are displayed. Resource view allows you to manage assignments for each of the resources so that you can efficiently distribute their usage.
Split and Recurring Tasks
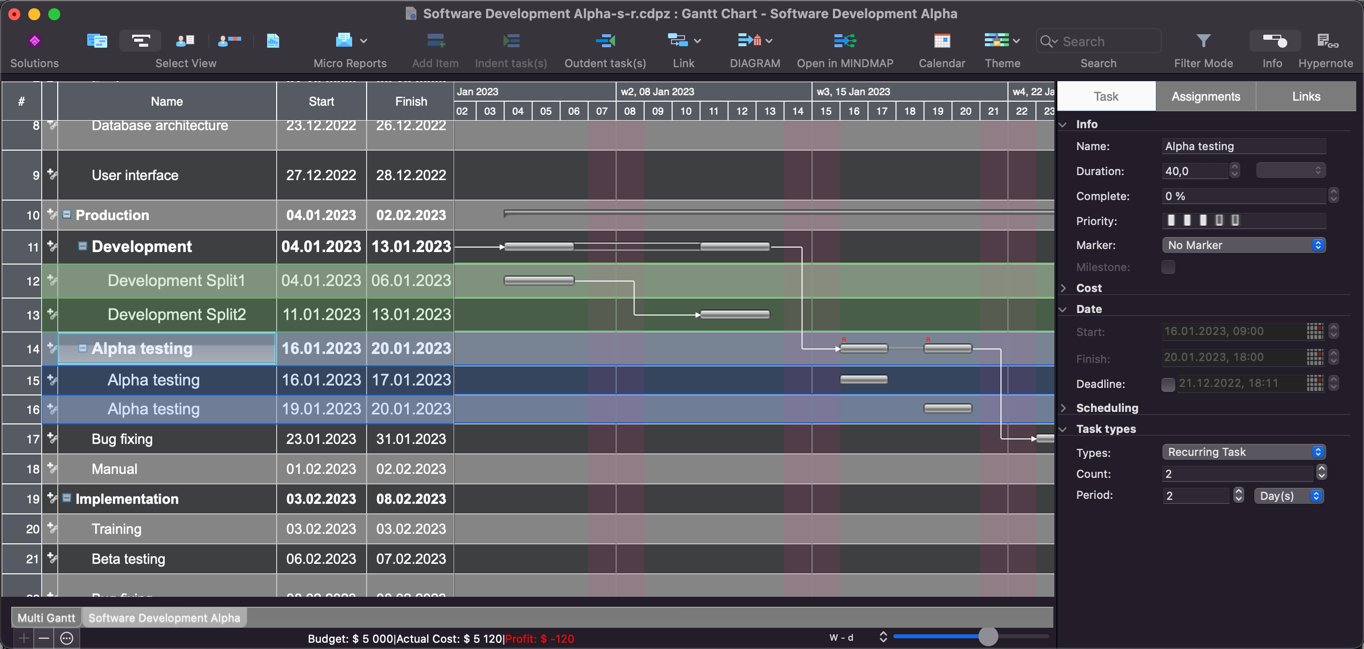
The flexible task management capabilities allow you to split a task when the work for it in a project should be started, then interrupted, and finally, resumed at a later term. Creating recurring tasks helps you easily schedule project tasks that occur on a regular basis.
Filters for Tasks and Resources
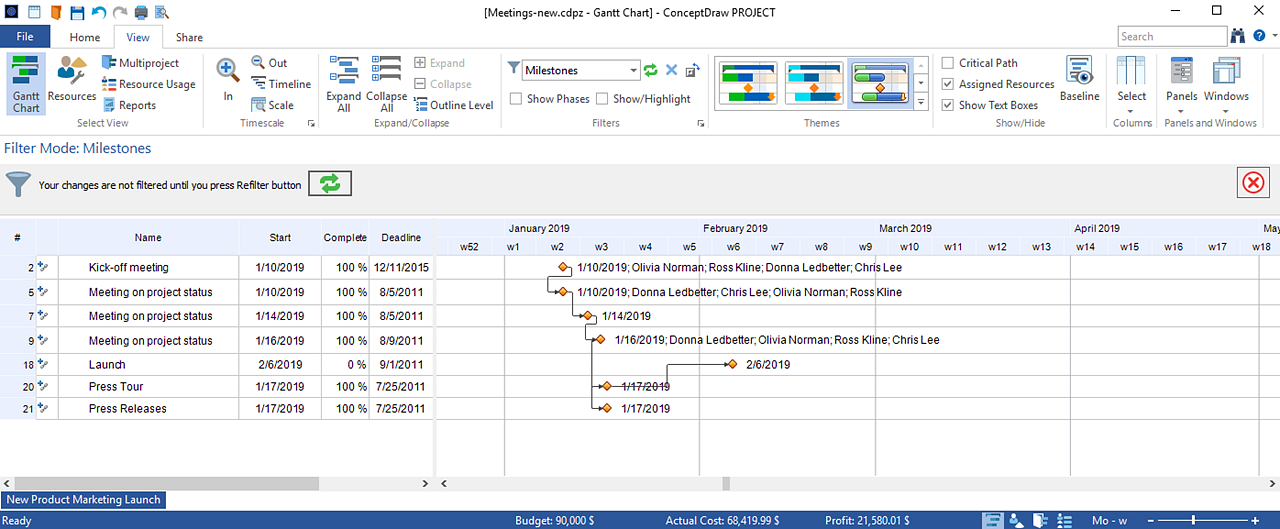
With ConceptDraw PROJECT, you can filter the view of the project so that you only see the milestones, critical tasks, or other information that’s most important in the current moment. You can use a set of simple embedded filters for viewing specific aspects of tasks or resources. For more complicated issues, you can apply a filter wizard that enables the creation of filters based on specific conditions. You can apply filters to tasks, resources, and even projects to hide all unnecessary information and focus on particular results and tasks.
Hyperlinks and Text Notes
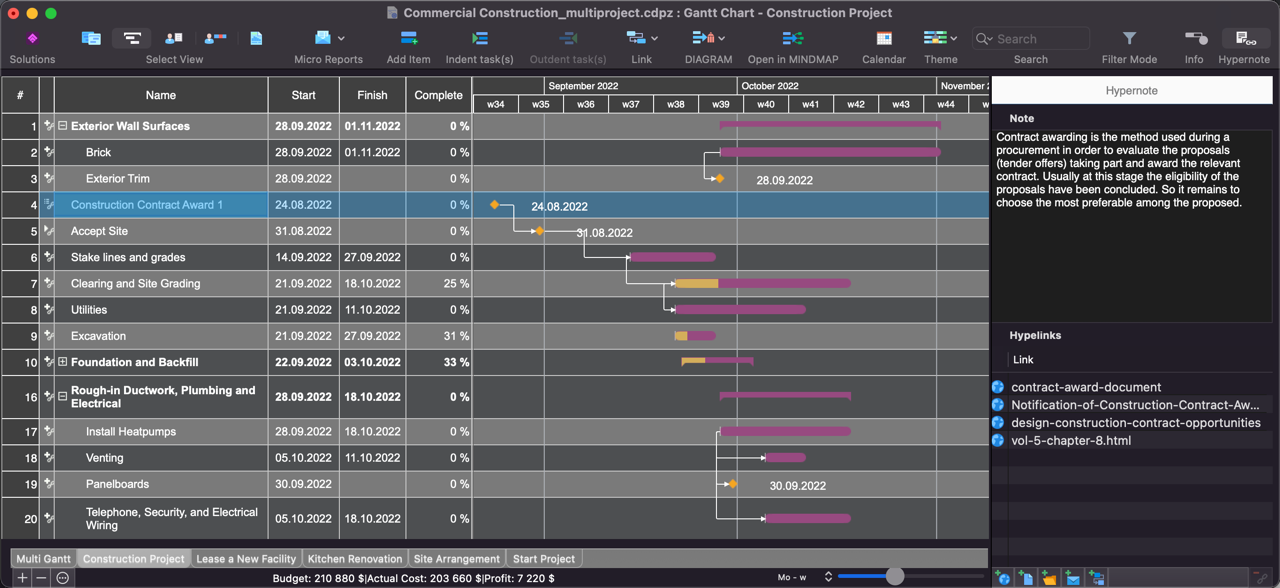
Hypernote is the combination of a text note with multiple hyperlinks. Multiple hyperlinks connect project documentation to tasks, phases, resources. You can link URL, e-mail, file, folder, Project, Task, Resource. Adding text notes will help to explain more about hyperlinks.
Project Management Diagrams and Dashboards
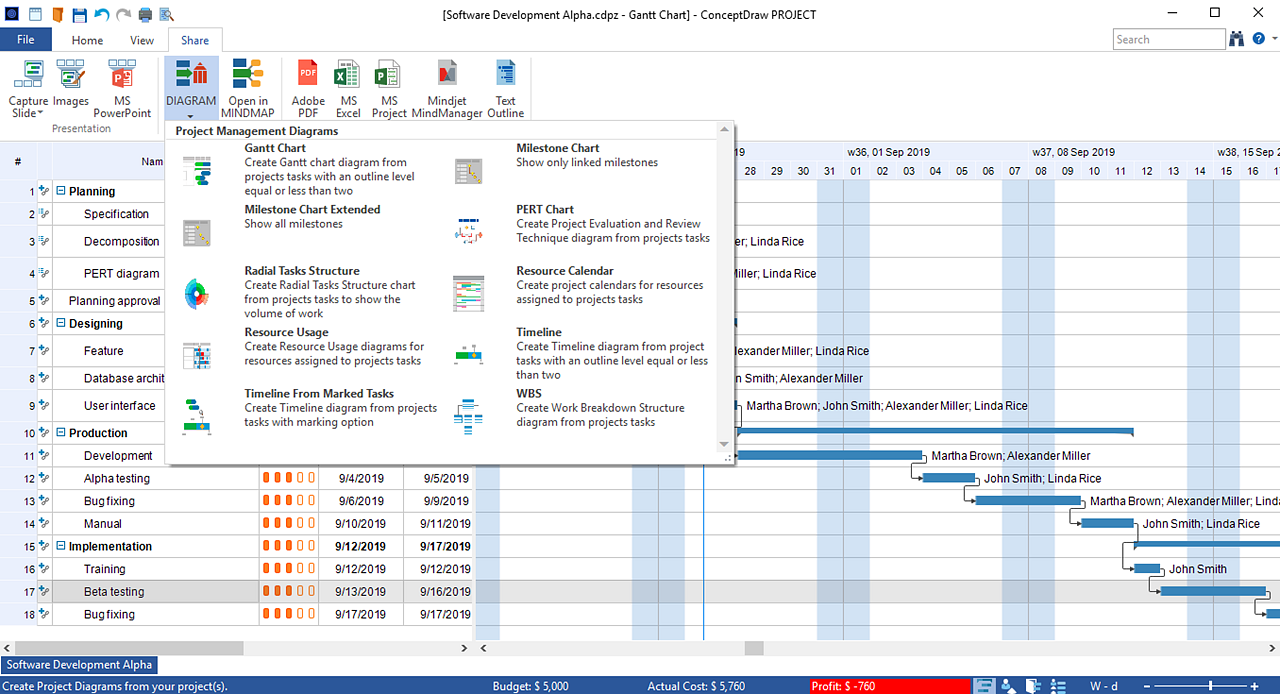
The PM Dashboards solution allows generating visual project dashboards: Common Project Dashboard, Radar Chart, and Tactical Dashboard. Project Dashboards are the helpful tool for tracking project progress and catching critical points. The dashboards are opened as ConceptDraw DIAGRAM documents (CDDZ). Project management diagrams give you the ability to view at a detailed level project attributes such as project scope, logical connections in the project, critical paths, key events on the timeline, milestones, tasks, calendars for work, and resource utilization. The project diagrams are generated as ConceptDraw DIAGRAM files (CDDZ).
Visual Reports
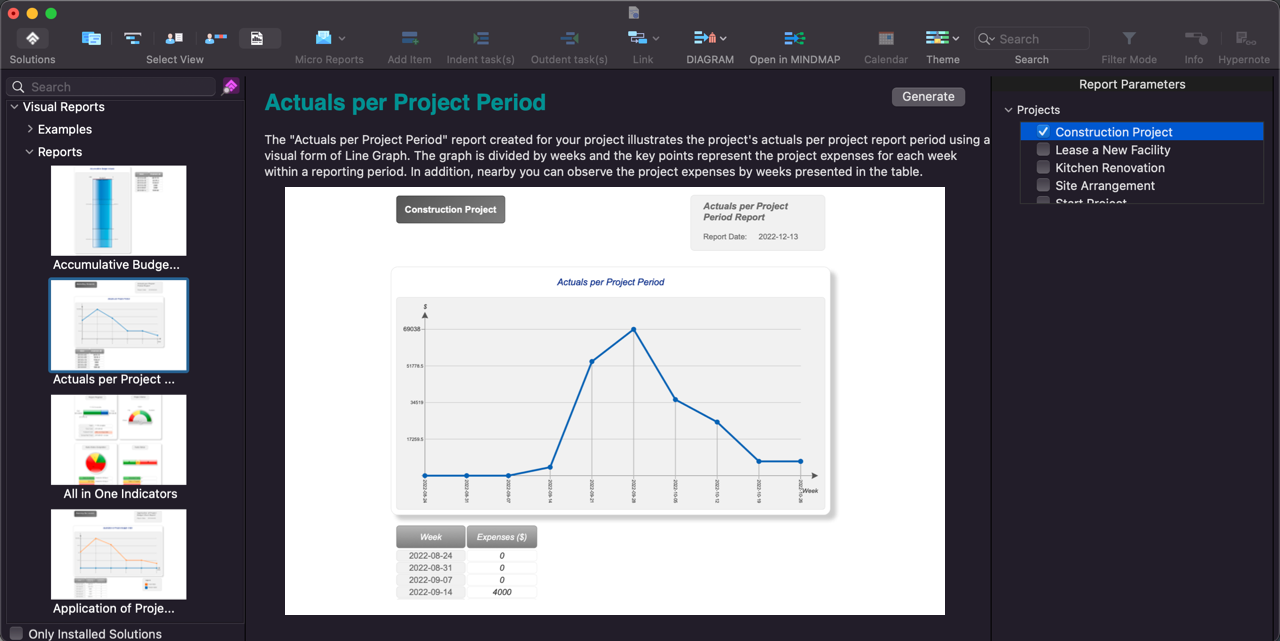
Visualization in project management practice integrates data visualization tools with traditional project reporting. Visual reports with ConceptDraw PROJECT and ConceptDraw DIAGRAM provide graphical visual representations of information, data, and knowledge intended to present complex information quickly and clearly. ConceptDraw PROJECT offers several types of visual reports that can help to assess visually the difference between planned and actual project data. The visual reports are generated as ConceptDraw DIAGRAM files (CDDZ).
Tabular Reports
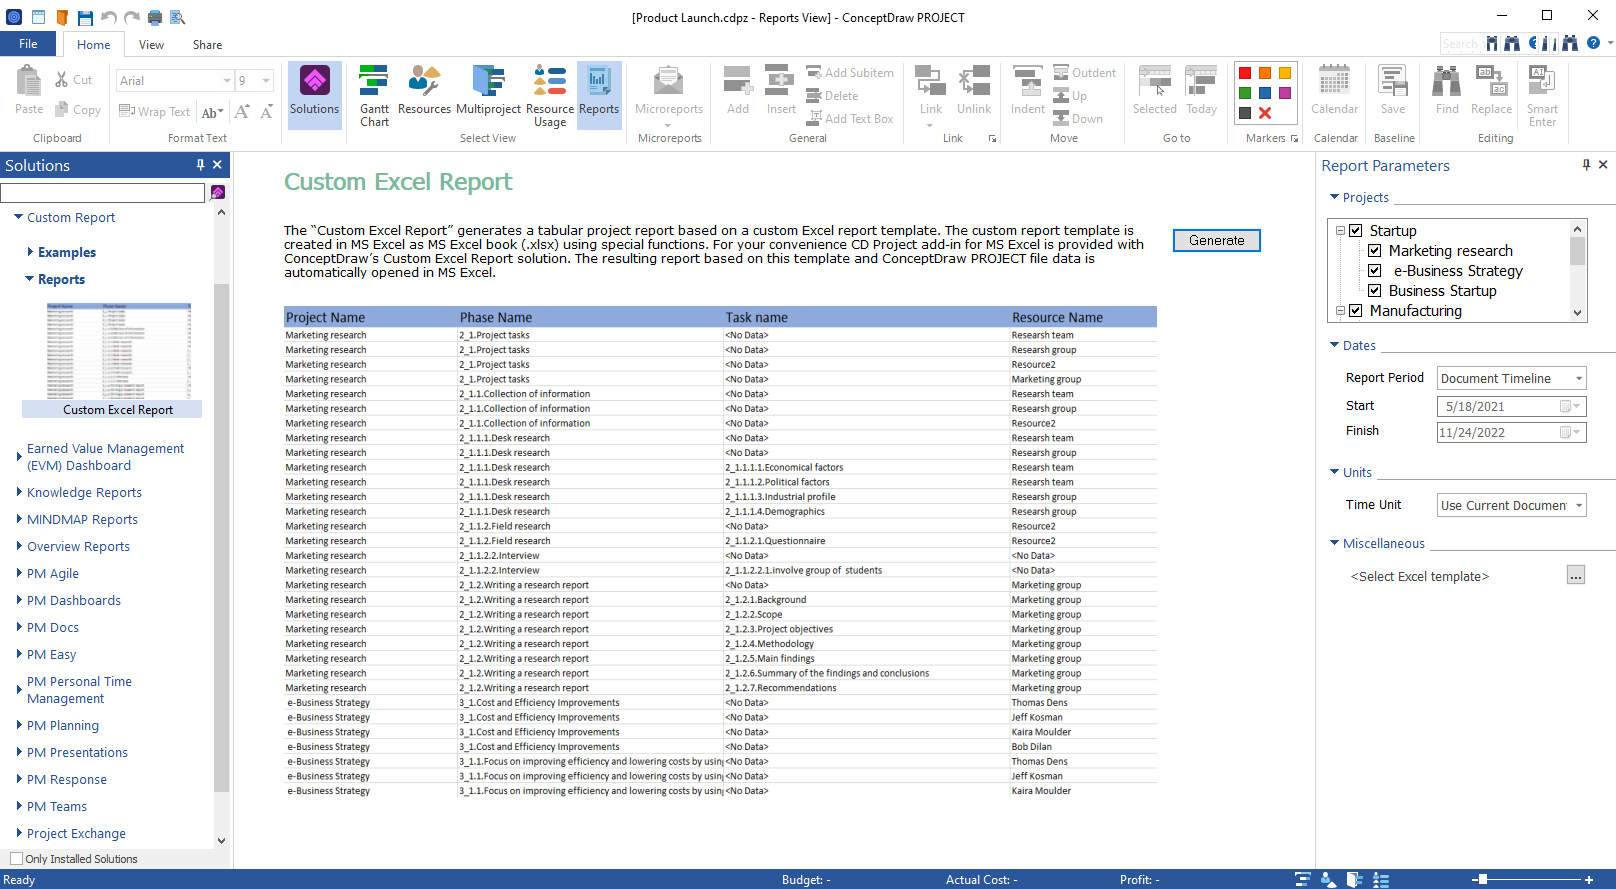
ConceptDraw PROJECT offers a number of ways to report the project status with traditional tabular reports. The Solutions panel provides a vast array of choices for reporting on your project status. Tabular reports are generated as electronic spreadsheets in MS Excel format (XLSX). There are more than 30 predefined tabular reports, along with the ability to construct custom reports, provided with the Custom Excel Report solution. All possible tabular reports templates are combined into 7 case-oriented solutions.
Mind Map Reports
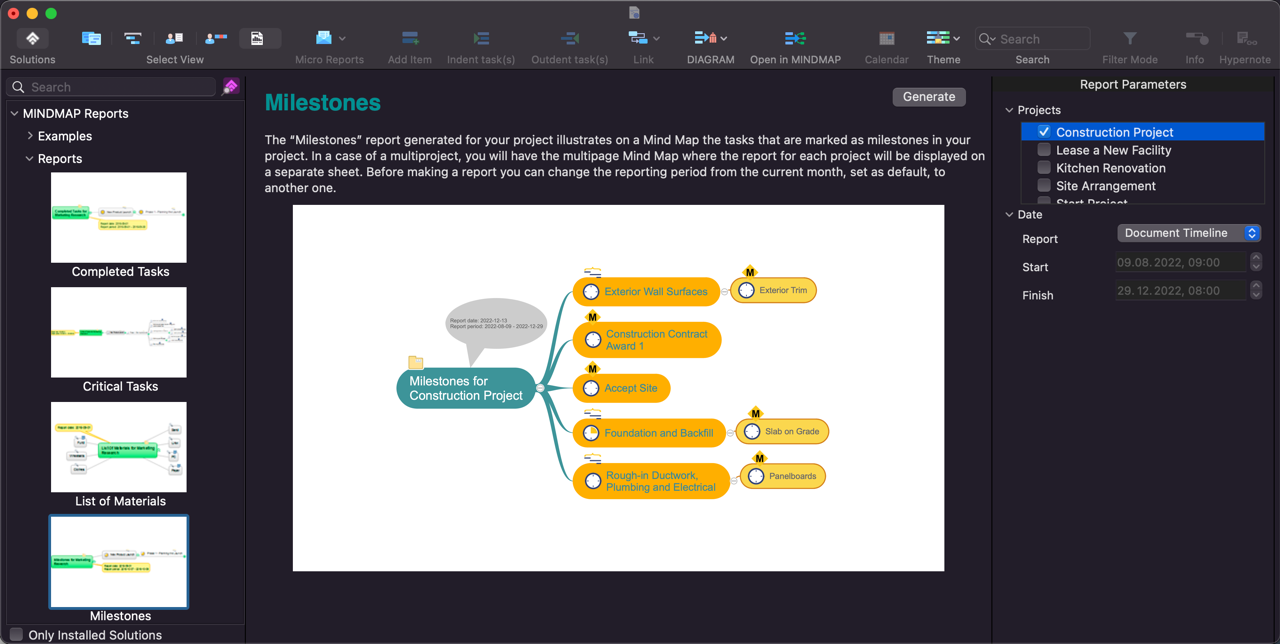
Visual thinking is the natural process of how the human brain captures, processes, and understands the information flow. Mind Mapping is exactly the visual thinking tool that can be applied in project management practice with the greatest success. The use of Mind Mapping in a project management practice facilitates idea-development processes, helps to support the management of high volumes of disparate data, and boosts communications among the members of the project team. Micro-reports by ConceptDraw PROJECT are automatically generated e-mail messages with the text and mind map, attached. The reporting mind maps are generated as ConceptDraw MINDMAP files (CDMZ). Micro-reports are used to be an effective visual tool for communicating project information among a diverse audience that includes project teams, and stakeholders.
Role-based Access
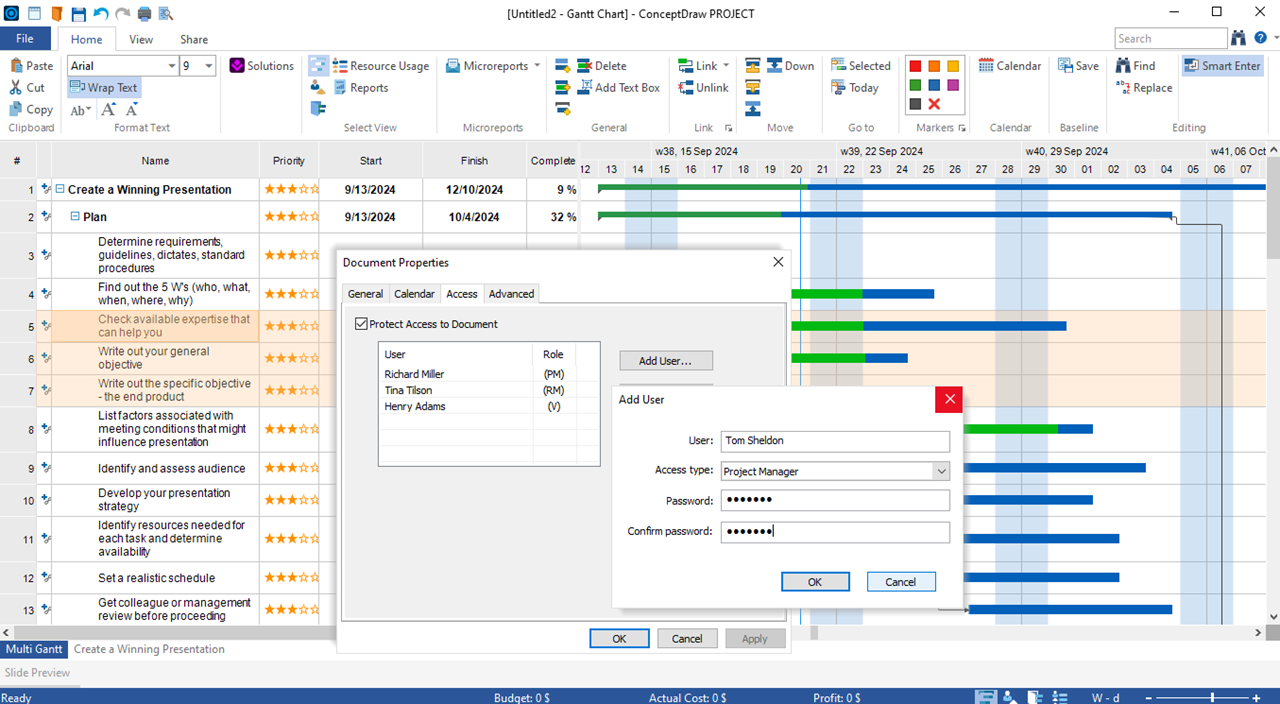
The interaction between project participants is an essential element of workflow. The project workflow often requires that different project participants may have varying access levels to the project file. The project manager can assign different role-based access to project team members. This helps to organize collaboration within a project team better.
Customizable Printing
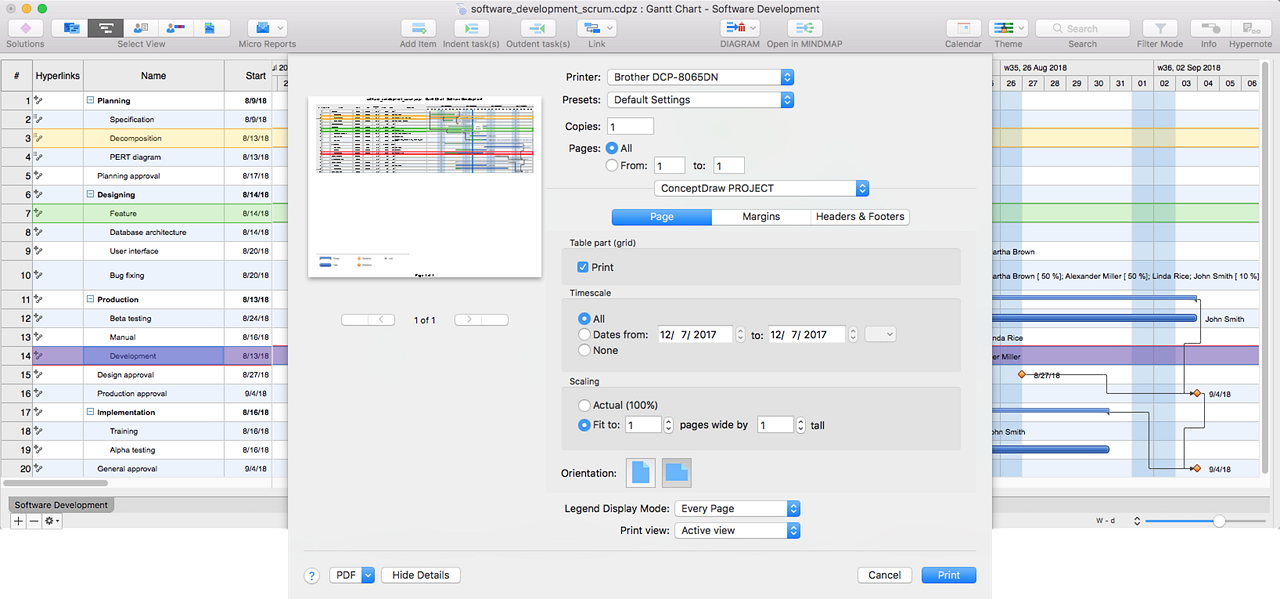
Printing is still commonly used to present project information. Sometimes It can be the most effective approach because reading is still a popular way to assimilate information. With ConceptDraw PROJECT, you can print all the views: Multi-project, Gantt, and Resources views. Thus, you can present the exact information that you want to share.
Import and Export
ConceptDraw PROJECT has the ability to import and export a number of usable formats, providing users with powerful flexibility in collaboration:
- Import/Export MS Project
- Import/Export MS Excel
- Import/Export MindManager
- Import/Export ConceptDraw MINDMAP
- Export Gantt Chart as an image
