- Electric and Telecom Plans Free
- Fire and Emergency Plans Free
- Floor Plans Free
- Plant Layout Plans Free
- School and Training Plans Free
- Seating Plans Free
- Security and Access Plans Free
- Site Plans Free
- Sport Field Plans Free
- Business Process Diagrams Free
- Business Process Mapping Free
- Classic Business Process Modeling Free
- Cross-Functional Flowcharts Free
- Event-driven Process Chain Diagrams Free
- IDEF Business Process Diagrams Free
- Logistics Flow Charts Free
- Workflow Diagrams Free
- ConceptDraw Dashboard for Facebook Free
- Mind Map Exchange Free
- MindTweet Free
- Note Exchange Free
- Project Exchange Free
- Social Media Response Free
- Active Directory Diagrams Free
- AWS Architecture Diagrams Free
- Azure Architecture Free
- Cisco Network Diagrams Free
- Cisco Networking Free
- Cloud Computing Diagrams Free
- Computer Network Diagrams Free
- Google Cloud Platform Free
- Interactive Voice Response Diagrams Free
- Network Layout Floor Plans Free
- Network Security Diagrams Free
- Rack Diagrams Free
- Telecommunication Network Diagrams Free
- Vehicular Networking Free
- Wireless Networks Free
- Comparison Dashboard Free
- Composition Dashboard Free
- Correlation Dashboard Free
- Frequency Distribution Dashboard Free
- Meter Dashboard Free
- Spatial Dashboard Free
- Status Dashboard Free
- Time Series Dashboard Free
- Basic Circle-Spoke Diagrams Free
- Basic Circular Arrows Diagrams Free
- Basic Venn Diagrams Free
- Block Diagrams Free
- Concept Maps Free
- Family Tree Free
- Flowcharts Free
- Basic Area Charts Free
- Basic Bar Graphs Free
- Basic Divided Bar Diagrams Free
- Basic Histograms Free
- Basic Line Graphs Free
- Basic Picture Graphs Free
- Basic Pie Charts Free
- Basic Scatter Diagrams Free
- Aerospace and Transport Free
- Artwork Free
- Audio, Video, Media Free
- Business and Finance Free
- Computers and Communications Free
- Holiday Free
- Manufacturing and Maintenance Free
- Nature Free
- People Free
- Presentation Clipart Free
- Safety and Security Free
- Analog Electronics Free
- Audio and Video Connectors Free
- Basic Circuit Diagrams Free
- Chemical and Process Engineering Free
- Digital Electronics Free
- Electrical Engineering Free
- Electron Tube Circuits Free
- Electronic Block Diagrams Free
- Fault Tree Analysis Diagrams Free
- GHS Hazard Pictograms Free
- Home Automation and Wiring Free
- Mechanical Engineering Free
- One-line Diagrams Free
- Power Сircuits Free
- Specification and Description Language (SDL) Free
- Telecom and AV Circuits Free
- Transport Hazard Pictograms Free
- Data-driven Infographics Free
- Pictorial Infographics Free
- Spatial Infographics Free
- Typography Infographics Free
- Calendars Free
- Decision Making Free
- Enterprise Architecture Diagrams Free
- Fishbone Diagrams Free
- Organizational Charts Free
- Plan-Do-Check-Act (PDCA) Free
- Seven Management and Planning Tools Free
- SWOT and TOWS Matrix Diagrams Free
- Timeline Diagrams Free
- Australia Map Free
- Continent Maps Free
- Directional Maps Free
- Germany Map Free
- Metro Map Free
- UK Map Free
- USA Maps Free
- Customer Journey Mapping Free
- Marketing Diagrams Free
- Matrices Free
- Pyramid Diagrams Free
- Sales Dashboard Free
- Sales Flowcharts Free
- Target and Circular Diagrams Free
- Cash Flow Reports Free
- Current Activities Reports Free
- Custom Excel Report Free
- Knowledge Reports Free
- MINDMAP Reports Free
- Overview Reports Free
- PM Agile Free
- PM Dashboards Free
- PM Docs Free
- PM Easy Free
- PM Meetings Free
- PM Planning Free
- PM Presentations Free
- PM Response Free
- Resource Usage Reports Free
- Visual Reports Free
- House of Quality Free
- Quality Mind Map Free
- Total Quality Management TQM Diagrams Free
- Value Stream Mapping Free
- Astronomy Free
- Biology Free
- Chemistry Free
- Language Learning Free
- Mathematics Free
- Physics Free
- Piano Sheet Music Free
- Android User Interface Free
- Class Hierarchy Tree Free
- Data Flow Diagrams (DFD) Free
- DOM Tree Free
- Entity-Relationship Diagram (ERD) Free
- EXPRESS-G data Modeling Diagram Free
- IDEF0 Diagrams Free
- iPhone User Interface Free
- Jackson Structured Programming (JSP) Diagrams Free
- macOS User Interface Free
- Object-Role Modeling (ORM) Diagrams Free
- Rapid UML Free
- SYSML Free
- Website Wireframe Free
- Windows 10 User Interface Free
Event-driven Process Chain Diagrams
Event-Driven Process Chain (EPC) Diagram is a special type of flowchart widely used for modeling in business engineering and reengineering, business process improvement, analyzing and redesigning business processes, and implementation of the enterprise resource planning (ERP). The most well-known modeling methodologies at the moment are ARIS (Architecture of Integrated Information Systems), SADT (Structured Analysis and Design Technique), and UML (Unified Modeling Language). The EPC method was developed within the ARIS framework and is one of the most popular modern methods that make it easy and convenient to simulate business processes.
Within the EPC method, a special EPC graphic standard or EPC notation was developed and allows describing the processes unequivocally, presenting them in a form understandable to all participants of the process or project. The EPC modeling notation is focused on building the interaction algorithms in the process of performing a specific work and is ideal for description scenarios and procedures. Modeling using EPC notation is a sequence of actions within a single business process that are performed by employees, offices or departments, and provides a link between organizational and functional models.
EPC diagrams help in enterprise resource planning, in visualizing business process workflows using building blocks such as functions, events, and connectors (AND, OR, XOR), and also in modeling the SAP R/3 system and redesigning business processes.
Event-Driven Process Chain Diagrams solution extends ConceptDraw DIAGRAM functionality with numerous collections of event driven process chain templates, samples of EPC engineering and modeling the business processes. It also includes a vector shape library for drawing EPC diagrams and EPC flowcharts of any complexity. This solution is one of EPC IT solutions that assist marketing experts, business specialists, engineers, educators and researchers in resources planning and helps improve business processes using the EPC flowchart or EPC diagram. Use the EPC solutions tools to build a chain of events and functions, to illustrate in detail the structure of a business process control flow, to accurately describe people and tasks for execution of the business processes. Apply it to identify the inefficient business processes in the enterprise and take the corresponding measures required to make them efficient.
-
Install this solution Free -
What I need to get started -
Solution Requirements - This solution requires the following products to be installed:
ConceptDraw DIAGRAM v18 - This solution requires the following products to be installed:
-
Compatibility - Sonoma (14), Sonoma (15)
MS Windows 10, 11 - Sonoma (14), Sonoma (15)
-
Support for this Solution -
Helpdesk
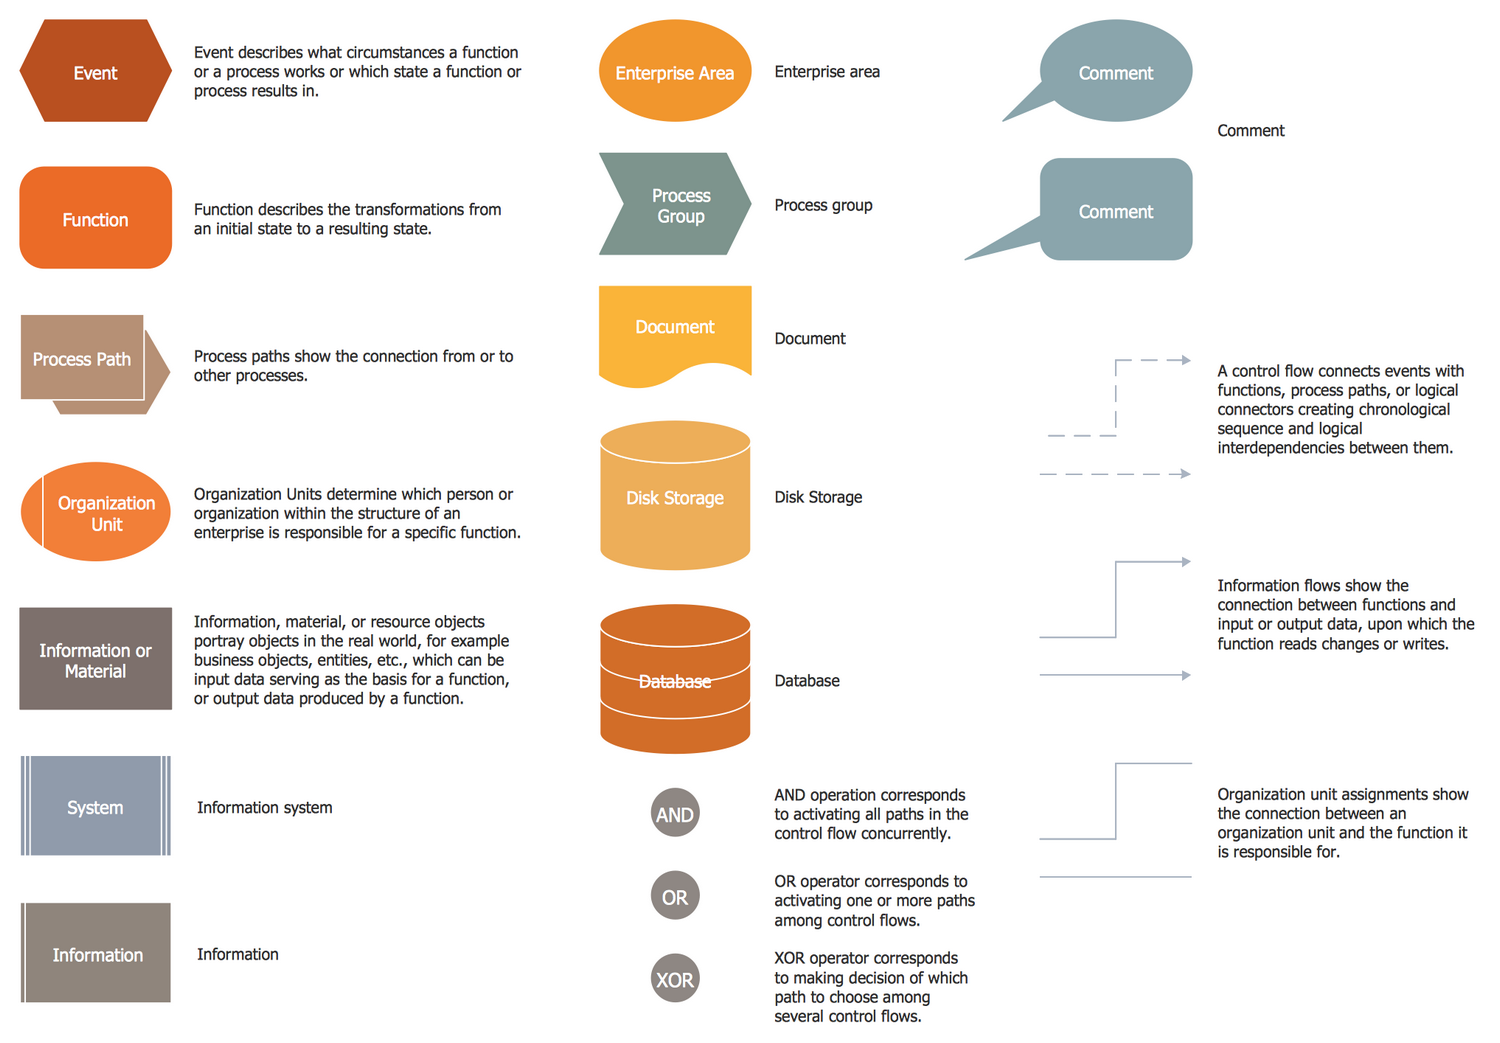
The Event-driven Process Chain Diagrams solution contains 10 examples and 1 library containing 22 vector graphics and objects.
Design Elements — Event-driven Process Chain Diagrams (EPC)
Related News:
CS Odessa opens new Business Process Section, with Event-driven Process Chains (EPC) Solution in ConceptDraw Solution ParkEvent-driven Process Chain Diagrams Examples
There are a few samples that you see on this page which were created in the ConceptDraw DIAGRAM application by using the Event-driven Process Chain Diagrams (EPC) solution. Some of the solution's capabilities as well as the professional results you can achieve are all demonstrated here on this page.
All source documents are vector graphic documents that are always available for modifying, reviewing and/or converting to many different formats, such as MS PowerPoint, PDF file, MS Visio, and many other graphic files from the ConceptDraw Solution Park or ConceptDraw STORE. The Event-driven Process Chain Diagrams (EPC) solution is available to all ConceptDraw DIAGRAM users to install and use while working with ConceptDraw DIAGRAM software for creating diagrams and drawings.
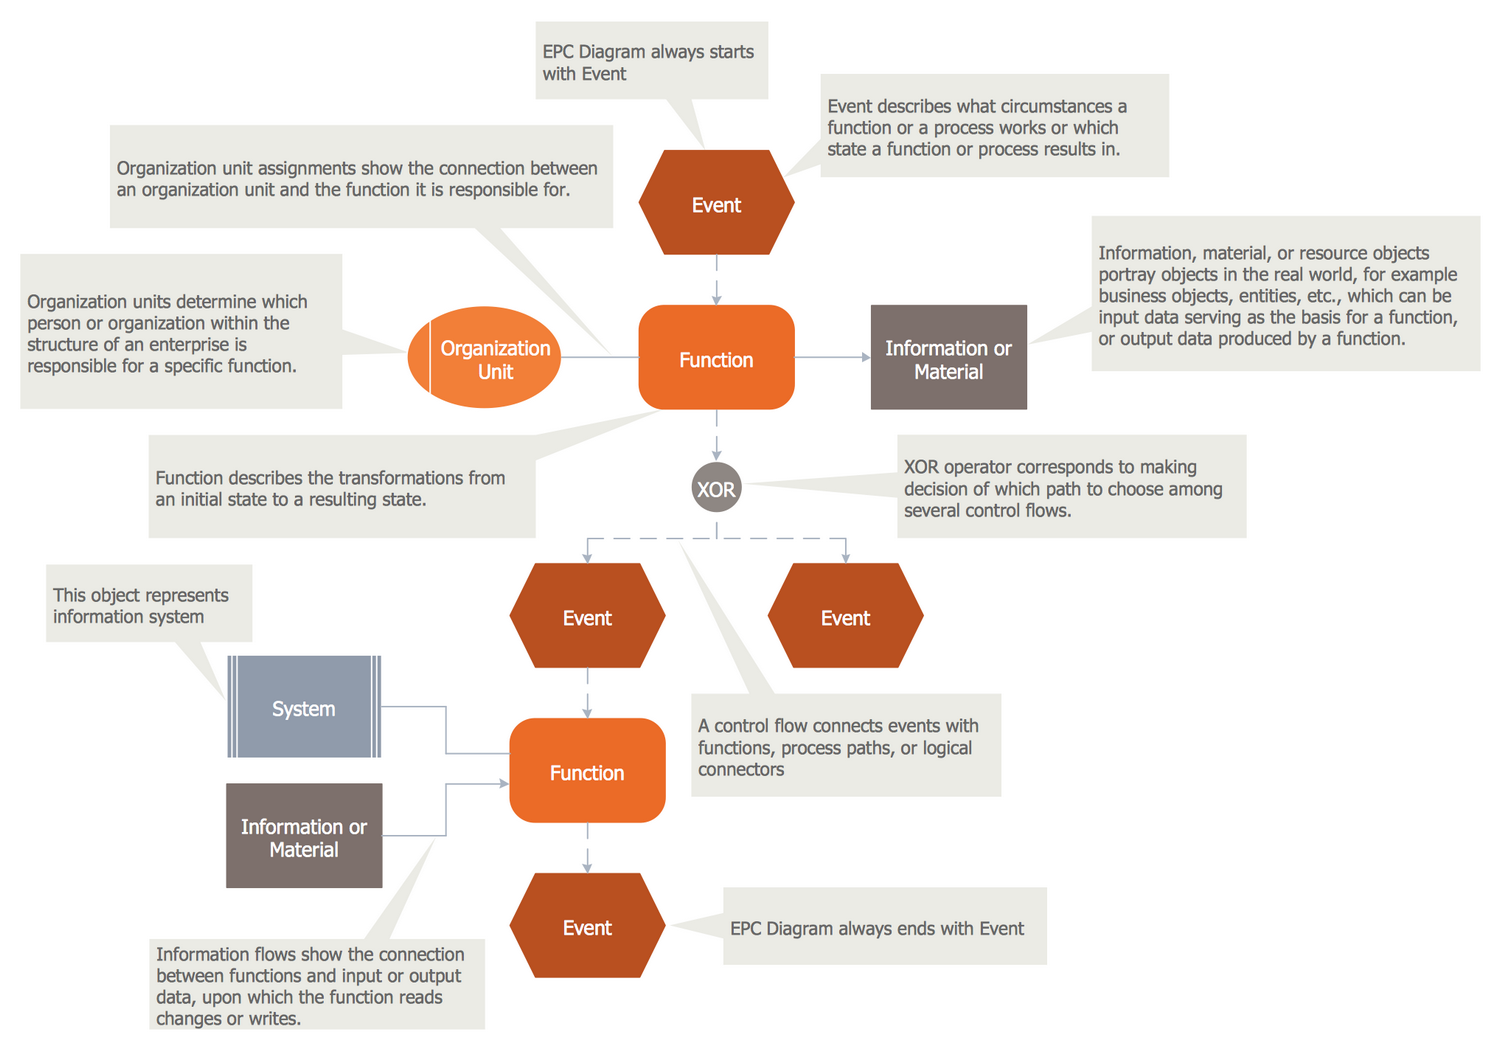
Template 1: Event-driven Process Chain (EPC) Diagram
This template of EPC Diagram is contained in the Event-driven Process Chain (EPC) Diagrams solution located in the ConceptDraw Solution Park. It helps you draw EPC diagrams using ConceptDraw DIAGRAM quickly and easily.
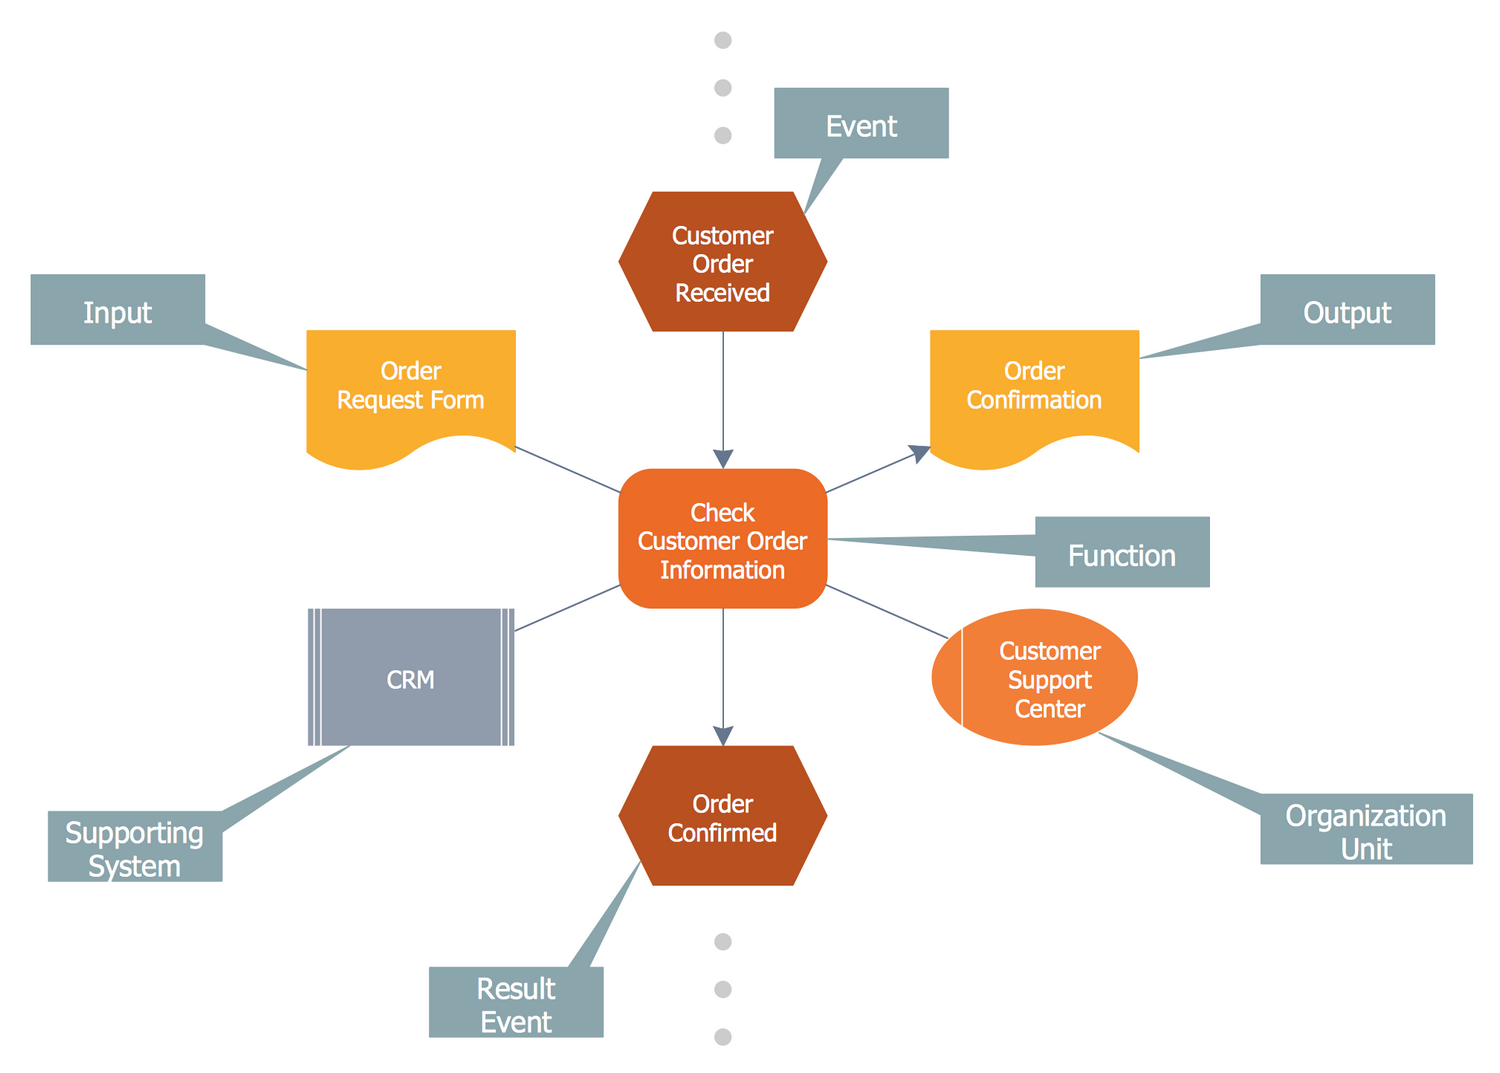
This Event-driven Process Chain (EPC) template explains the meanings of all variety of EPC design elements. The EPC method was developed within the ARIS (Architecture of Integrated Information Systems) framework. For EPC diagrams constructing is applied a common set of event-driven process chain elements that allow making the EPC diagrams of any configurations. Each EPC diagram starts and ends with events represented by hexagon shapes. The function describes the transformations from the initial state to the final state and is indicated by the rounded rectangle. The organization unit represented by an oval shape determines which person or organization within the structure of an enterprise is responsible for a specific function. The system object represents the information system, information flows show the connection between functions and input or output data, upon which the function reads changes or writes. The logical operators represented in the circles are also used extensively in EPC diagrams.
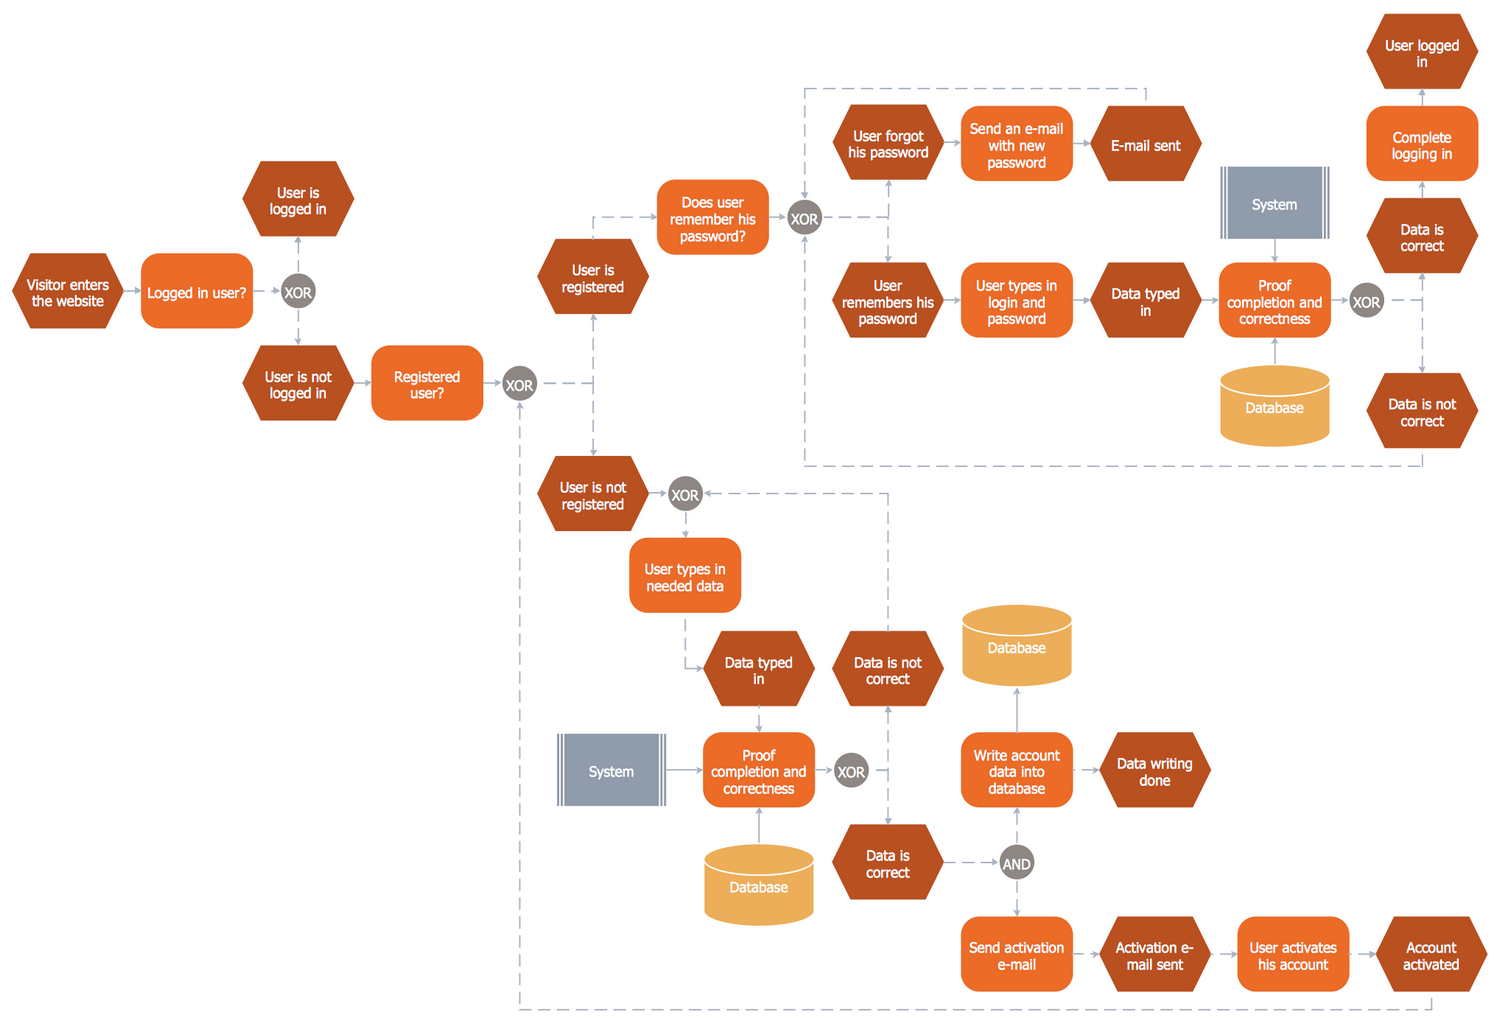
Example 1: EPC diagram — Login and Registration Processing
This diagram was created in ConceptDraw DIAGRAM using the EPC Diagrams library from the Event-driven Process Chain Diagrams solution. An experienced user spent 20 minutes creating this sample.
This computer security EPC Diagram sample clearly illustrates a step by step login and registration processing procedure and depicts how all events can impact the process flow. The login and registration are the basis of computer security they allow you to restrict access to a computer system or other restricted area, allowing the individual access to a computer system only for certain people. During the process of signing in or logging into the system, the user is identified and authenticated based on the data entered by the user. If the user is not logged in, it is checked whether he is registered and for what reason the log in was not performed. And so on, you can see all the registration process steps in the diagram. After completing the work in the system, when the access is no longer needed, the user can easily log out. The use of ConceptDraw DIAGRAM connectors to create EPC diagram is an intuitive and time-saving solution.
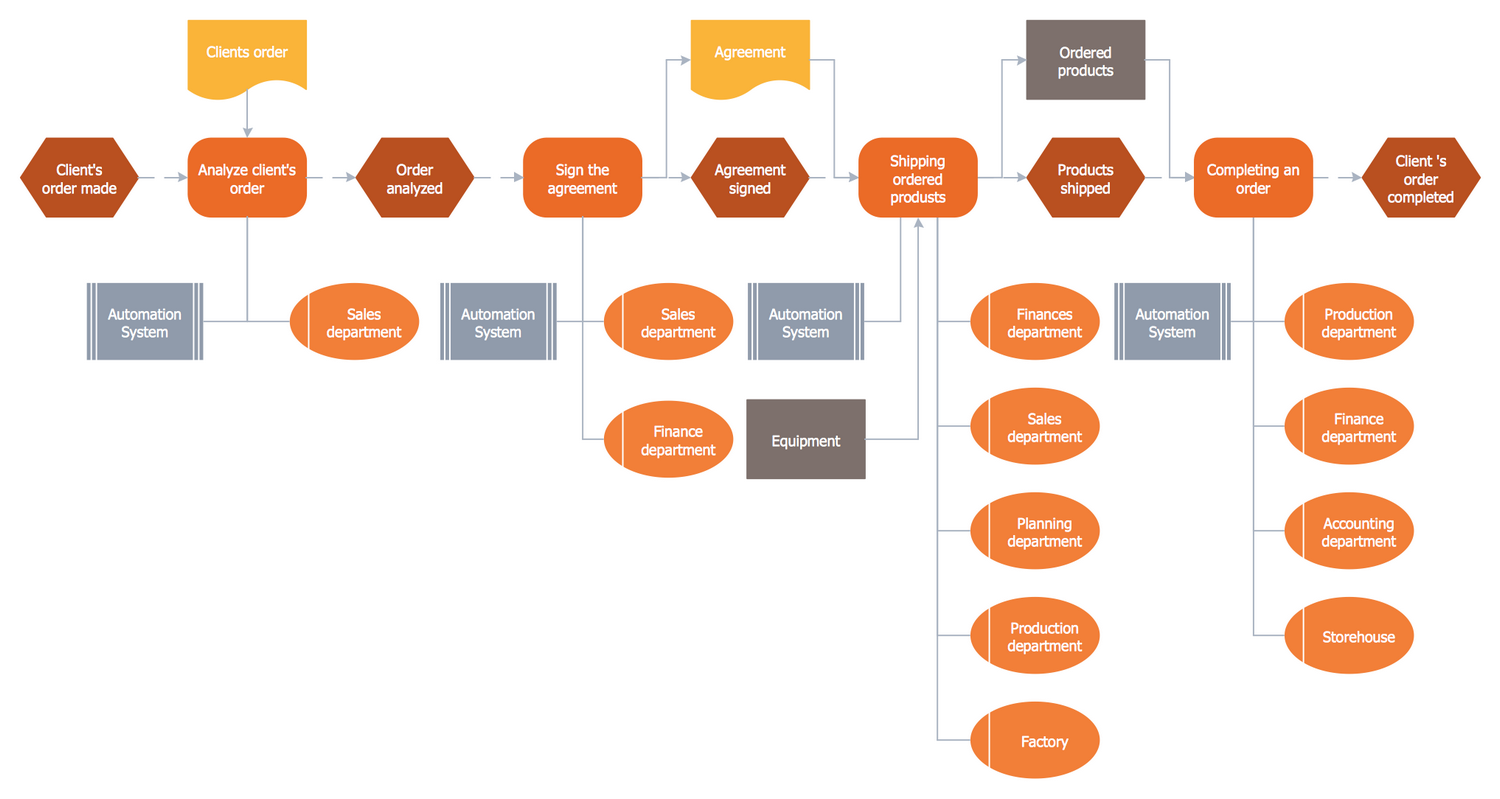
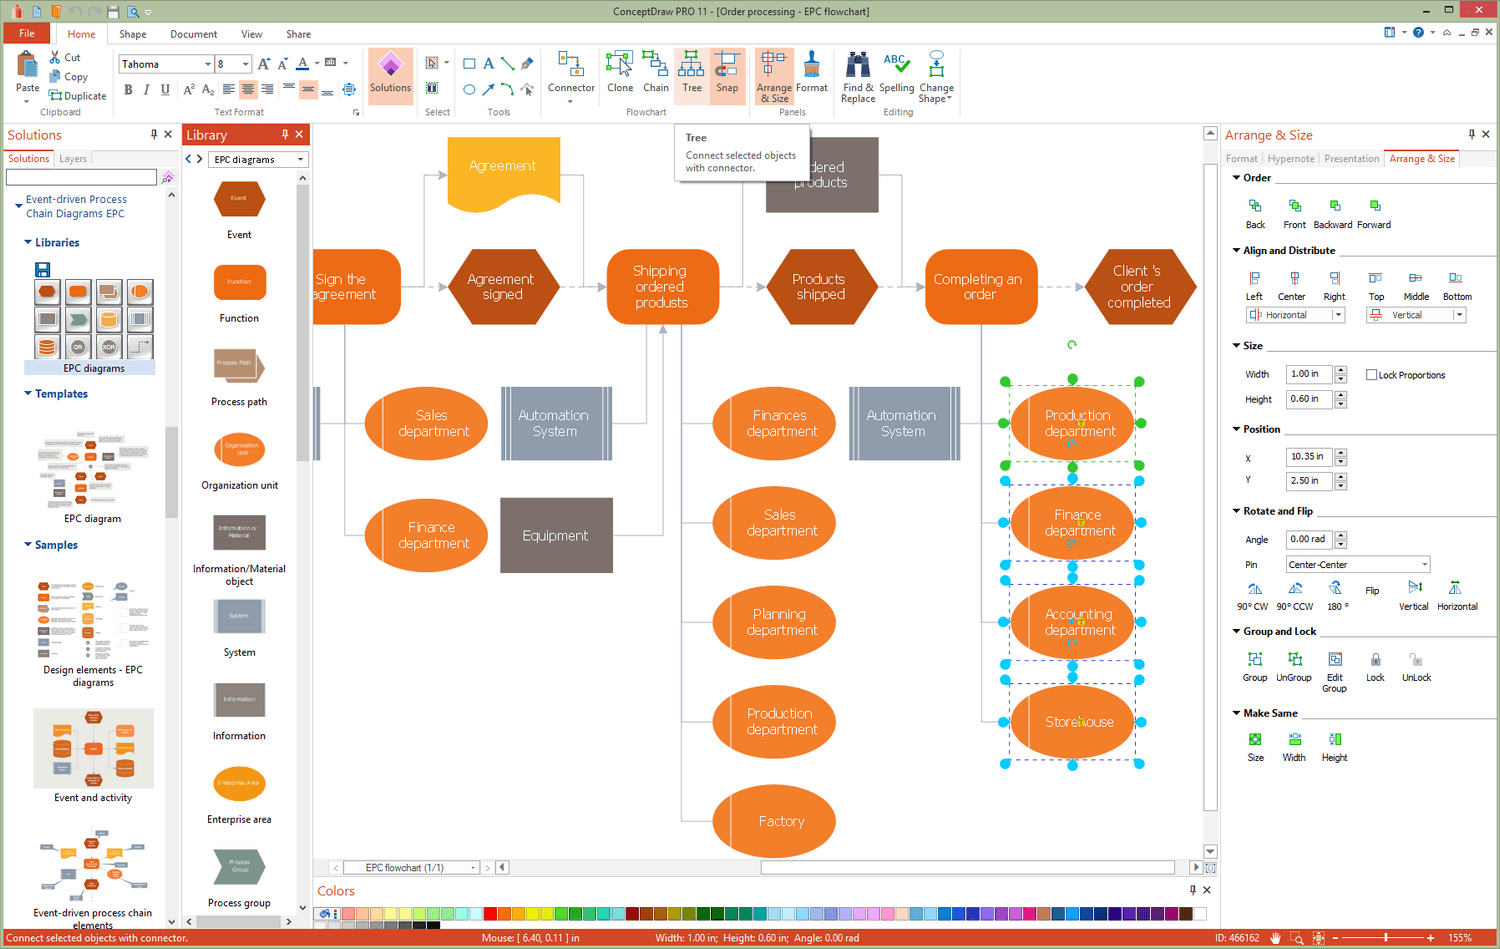
Example 2: EPC Diagram — Order Processing
This diagram was created in ConceptDraw DIAGRAM using the EPC Diagrams library from the Event-driven Process Chain Diagrams solution. An experienced user spent 10 minutes creating this sample.
This example shows the Business process modeling (BPM) Event-driven Process Chain Diagram that clearly illustrates an order processing procedure step by step. The order processing is one of the main functions in the process of order fulfillment. The order processing is understood as a complete set of measures, starting from the moment of receiving the order from the buyer and ending with its implementation, including picking, packing, delivering the packed items to a shipping carrier, as well as delivering and transfer the goods to the consumer. The order processing takes some time, but the faster it happens, the more satisfied the customers are, and the higher the success of the producers is. The main steps of the order processing are the following: making an order by the client, order’s analysis, signing the agreement, shipping ordered products, and completing the order. This EPC diagram can be used as visual material for employee training or as a source for any automation initiative.
Example 3: EPC Diagram — Image Processing
This diagram was created in ConceptDraw DIAGRAM using the EPC Diagrams library from the Event-driven Process Chain Diagrams solution. An experienced user spent 15 minutes creating this sample.
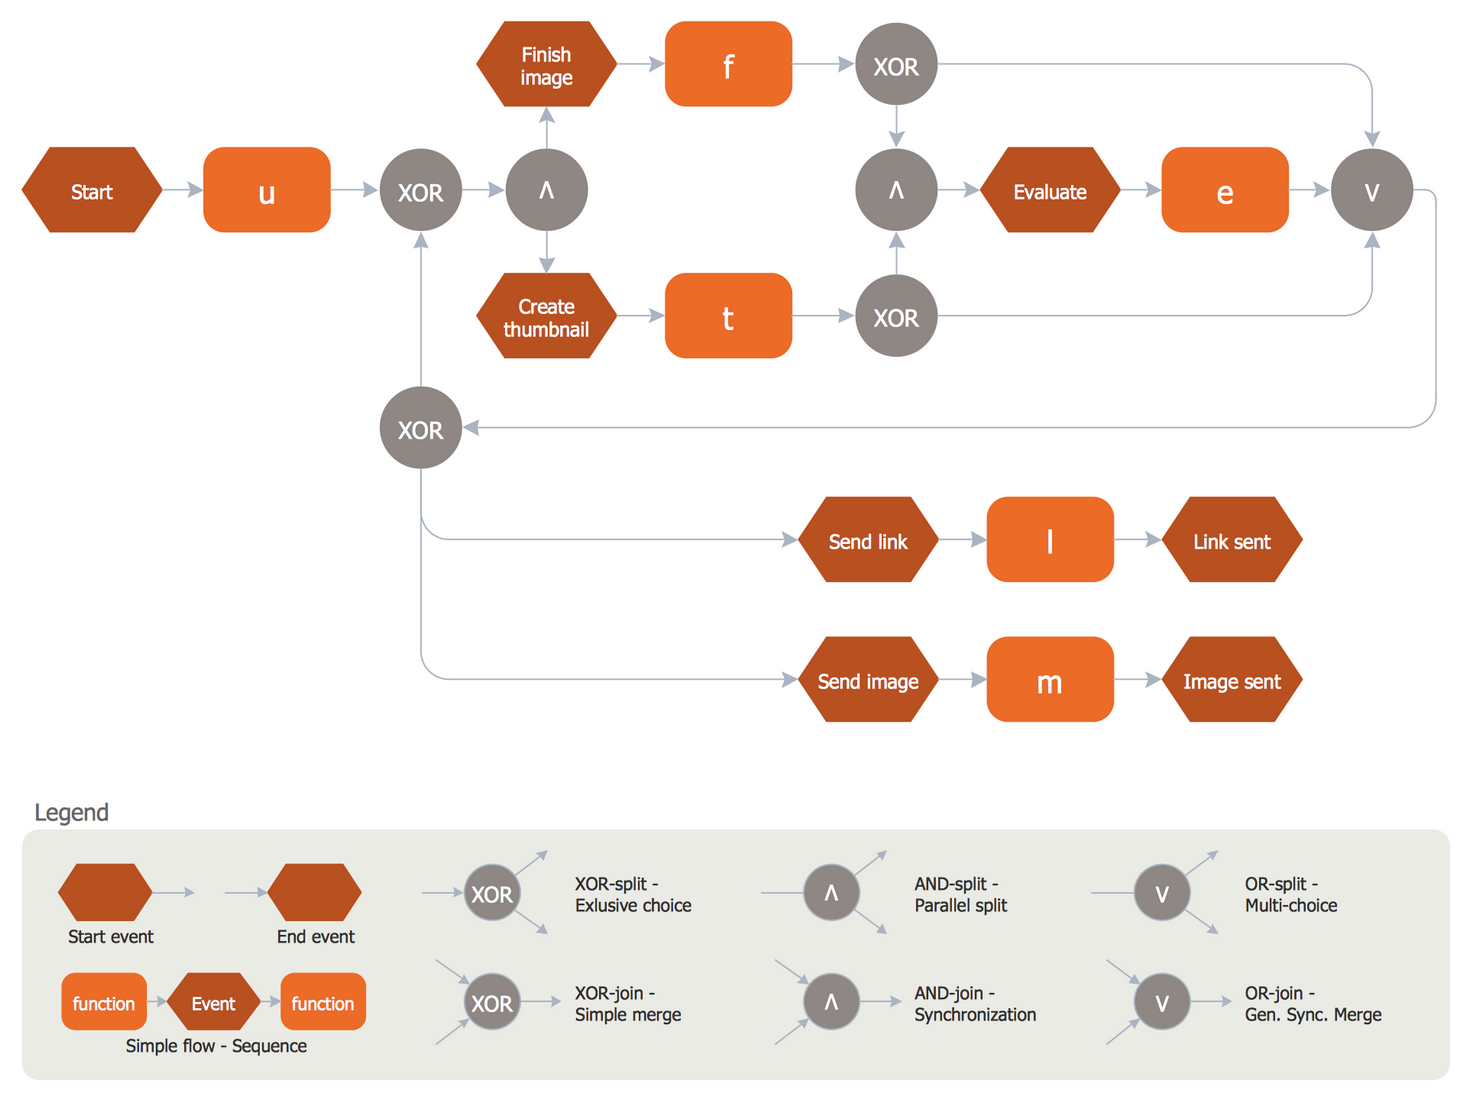
This EPC diagram depicts the image processing flow and was created based on illustration published in the article "Methods for the specification and verification of business processes. 19 — Event-driven process chains. Roberto Bruni. 2011". The business process is a sequence of alternating events and functions using the logical relationships AND, OR, XOR represented in the circles according to the event-driven process chain notation. It is convenient to use the EPC IT solutions, EPC method and EPC notation for representing the domain concepts and aspects of the business processes, and for configuring the Enterprise Resource Planning (ERP) implementation. The colors of shapes offered by the EPC Diagrams library from the ConceptDraw's Event-driven Process Chain Diagrams solution significantly differ, thus the event shapes have a brown color, the function shapes are orange, and logical operators are colored by grey. The legend clearly describes all the elements and symbols used in the diagram. It is recommended to create legends to clarify your technical schemes of the EPC.
Example 4: EPC Diagram — Main Process
This diagram was created in ConceptDraw DIAGRAM using the EPC Diagrams library from the Event-driven Process Chain Diagrams solution. An experienced user spent 10 minutes creating this sample.
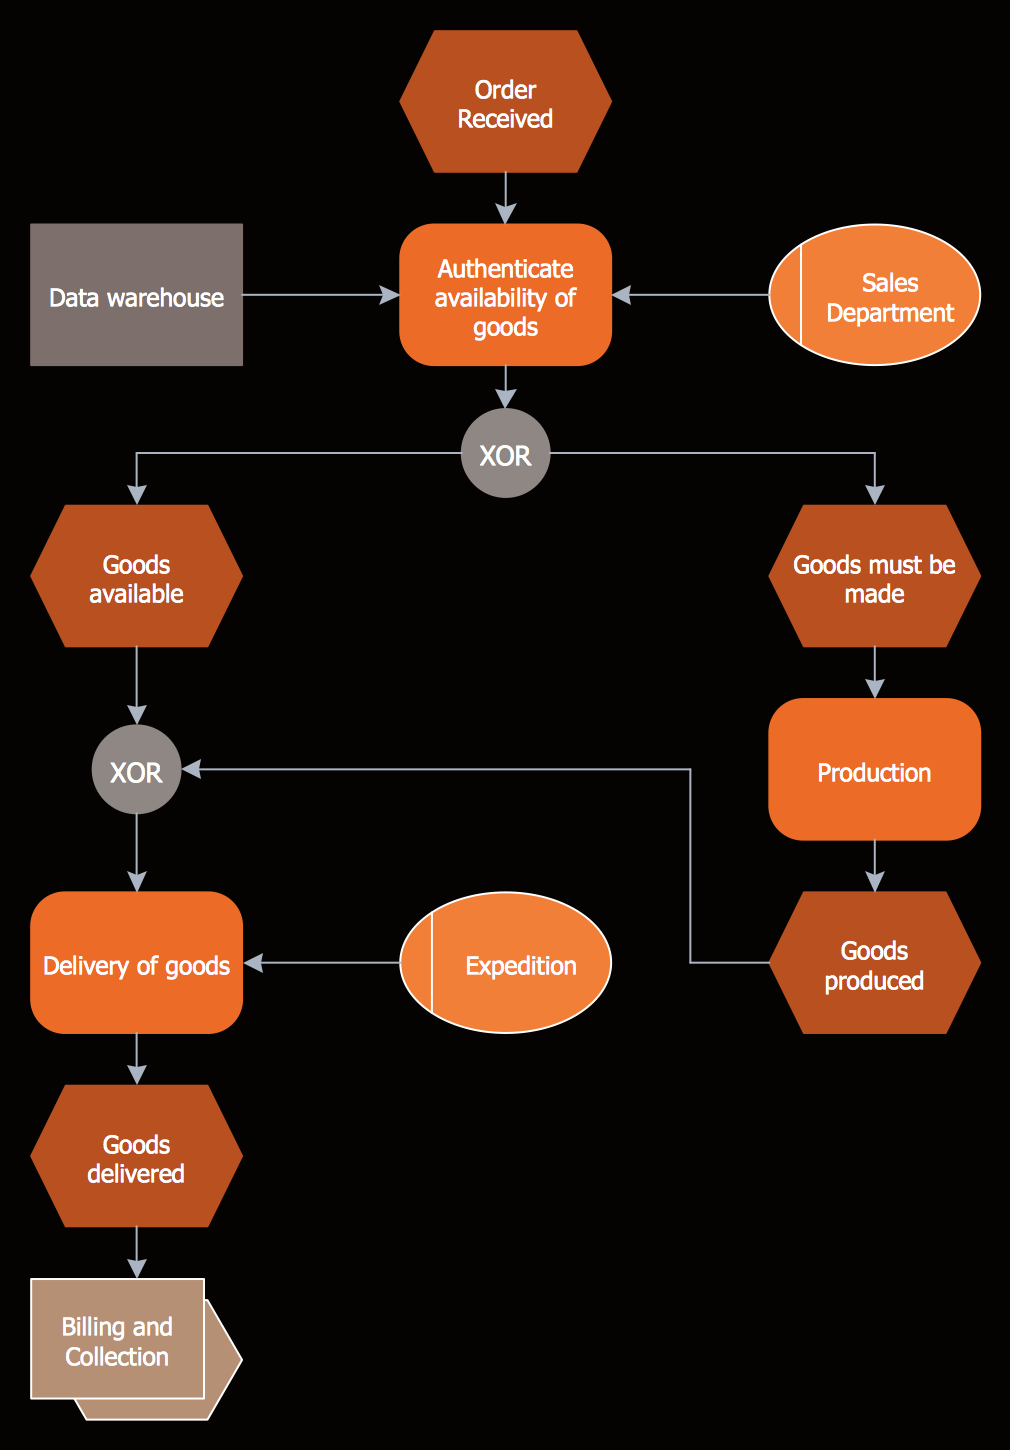
This EPC diagram sample demonstrates the main process of supplying goods and was designed on the base of the Wikimedia Commons file "EPC priklad1.png". The key points in this diagram are the XOR operations used when the function is completed and executing one of two chains of events. The flow starts with receiving an order for some goods by the company. At the next stage, the order is processed. First, the availability of goods is recognized, they may be available or must be made. You can see the XOR operator and both these options, one of which will be executed. If the goods are available, this means that they are in a warehouse and can be delivered immediately. If the goods are to be manufactured, then the nested production process is started, and when the goods are produced they will also be delivered. You can experiment with the colors of objects, background, and fonts to find the best and most attractive version for your diagram.
Example 5: EPC Diagram — Wikipedia Editing Process
This diagram was created in ConceptDraw DIAGRAM using the EPC Diagrams library from the Event-driven Process Chain Diagrams solution. An experienced user spent 10 minutes creating this sample.
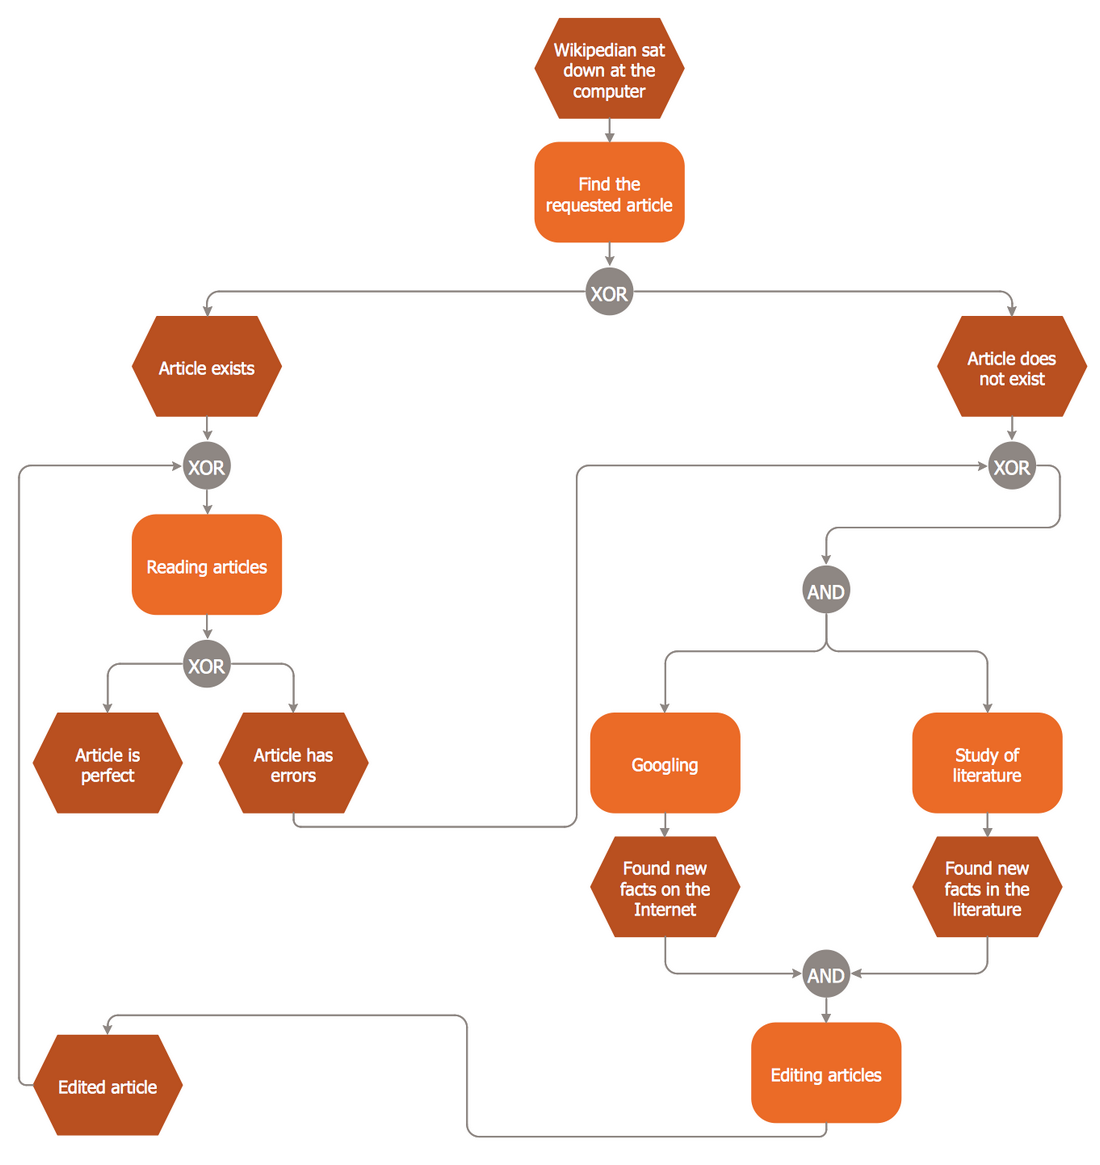
This Event-driven Process Chain Diagram was designed on the base of the “EPC diagram.png” Wikimedia Commons file and illustrates in detail the process of editing articles on Wikipedia helping to understand better this process that may seem rather complicated at a first glance. The XOR and AND operators are used in this diagram. You can see that there are several reasons for editing articles on Wikipedia, these are the errors in articles, or new facts received from the literature or Internet that should to be added to the corresponding article. Typically, anyone can edit any unprotected page with a goal to improve it, at this some pages on Wikipedia are protected from editing. There are used two methods for editing articles on Wikipedia: classic editing through the wiki markup (wikitext) or with new VisualEditor (VE). Use this diagram as a quick guide to make Wikipedia articles perfect.
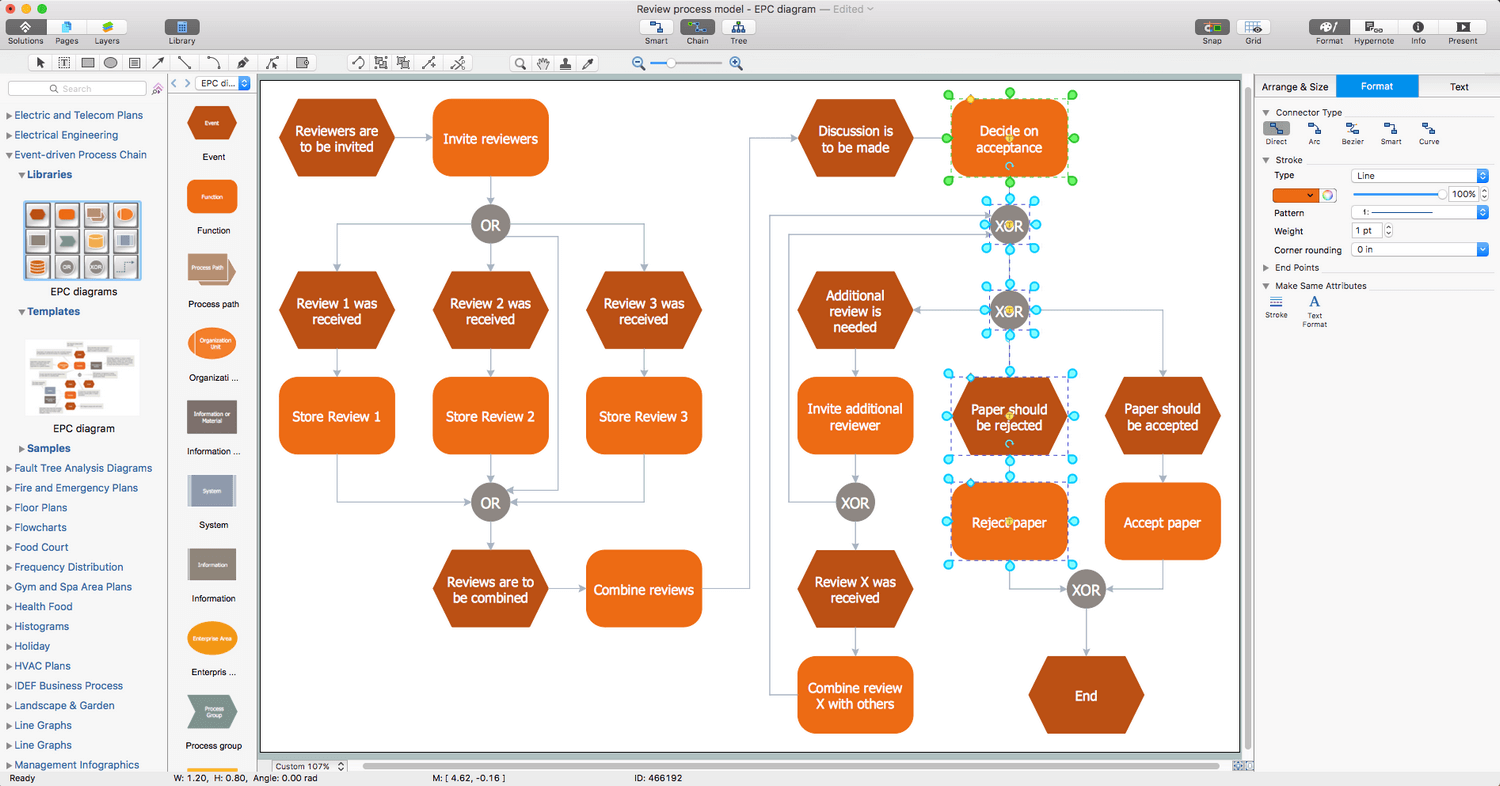
Example 6: EPC Diagram — Review Process Model
This diagram was created in ConceptDraw DIAGRAM using the EPC Diagrams library from the Event-driven Process Chain Diagrams solution. An experienced user spent 10 minutes creating this sample.
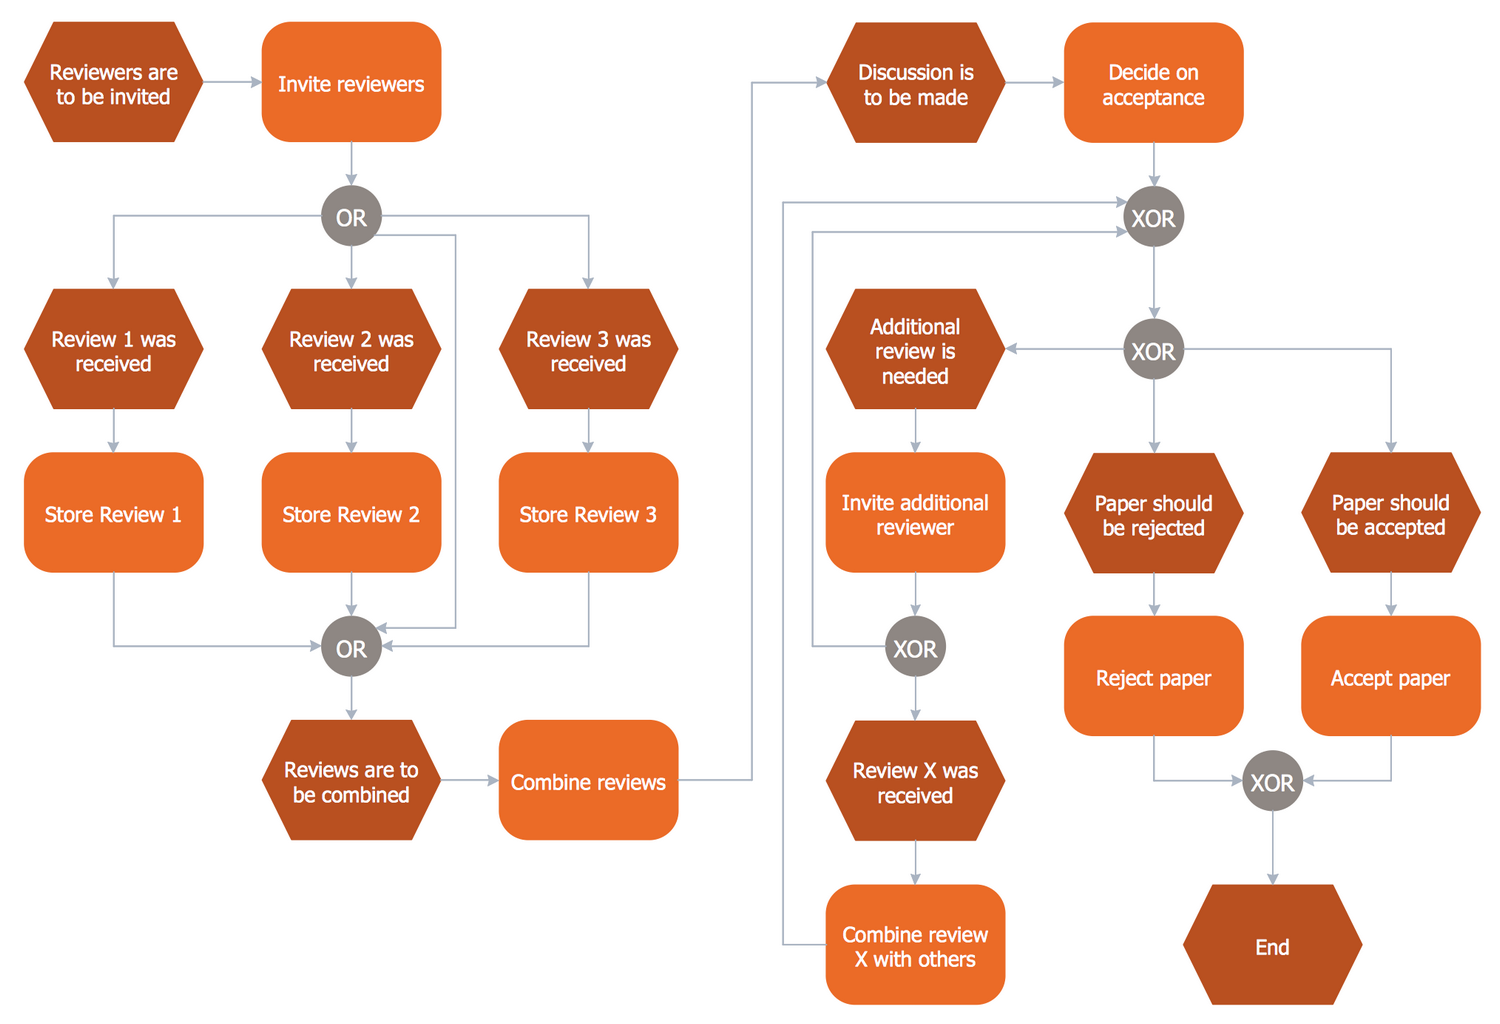
This Event-driven process chain (EPC) diagram sample shows the review process model. It was constructed based on illustration for the "Interoperability in the ProM Framework" article published by H.M.W. Verbeek, B.F. van Dongen, J. Mendling, and W.M.P. van der Aalst on the CEUR Workshop Proceedings (CEUR-WS.org) website. The process begins with the inviting reviewers. Each paper is reviewed by three people; these reviews are stored and then combined. After discussion, you may need to invite another reviewer for an additional review. As a result, the paper may be rejected or accepted. Each activity in this Event-driven process chain (EPC) diagram is represented by a function and depicted as the rounded rectangle, the events are represented by hexagons. The shapes are joined by connectors, among which you can find XOR, OR, and AND. For convenience, the shapes used to create the EPC diagram differ not only by their shape but also by color.
Example 7: Event-driven Process Chain Elements
This diagram was created in ConceptDraw DIAGRAM using the EPC Diagrams library from the Event-driven Process Chain Diagrams solution. An experienced user spent 10 minutes creating this sample.
This diagram sample demonstrates the set of event-driven process chain elements. Being designed on the base of the "Elements of an Event-driven Process Chain.svg" Wikimedia Commons file, it uses the common designations for the basic EPC elements and represents all them in a clear and understandable view. The events are represented by hexagons and are the states that occur before or after a function, and fix some parameters in a certain moment. The functions are represented by rounded rectangles. The events are passive elements while the functions are active. The next element is the organizational unit displayed as an oval, which represents a position in the organization or unit that performs certain functions. Such event driven process chain elements as input, output, supporting system, result event are also presented in this diagram. The logical relationships between the main elements (events and functions) are described by logical connectors in the EPC diagrams, and allow splitting the control flow from one to two or more flows and their synchronizing as well.
Example 8: EPC Diagram — Nested Process
This diagram was created in ConceptDraw DIAGRAM using the EPC Diagrams library from the Event-driven Process Chain Diagrams solution. An experienced user spent 10 minutes creating this sample.
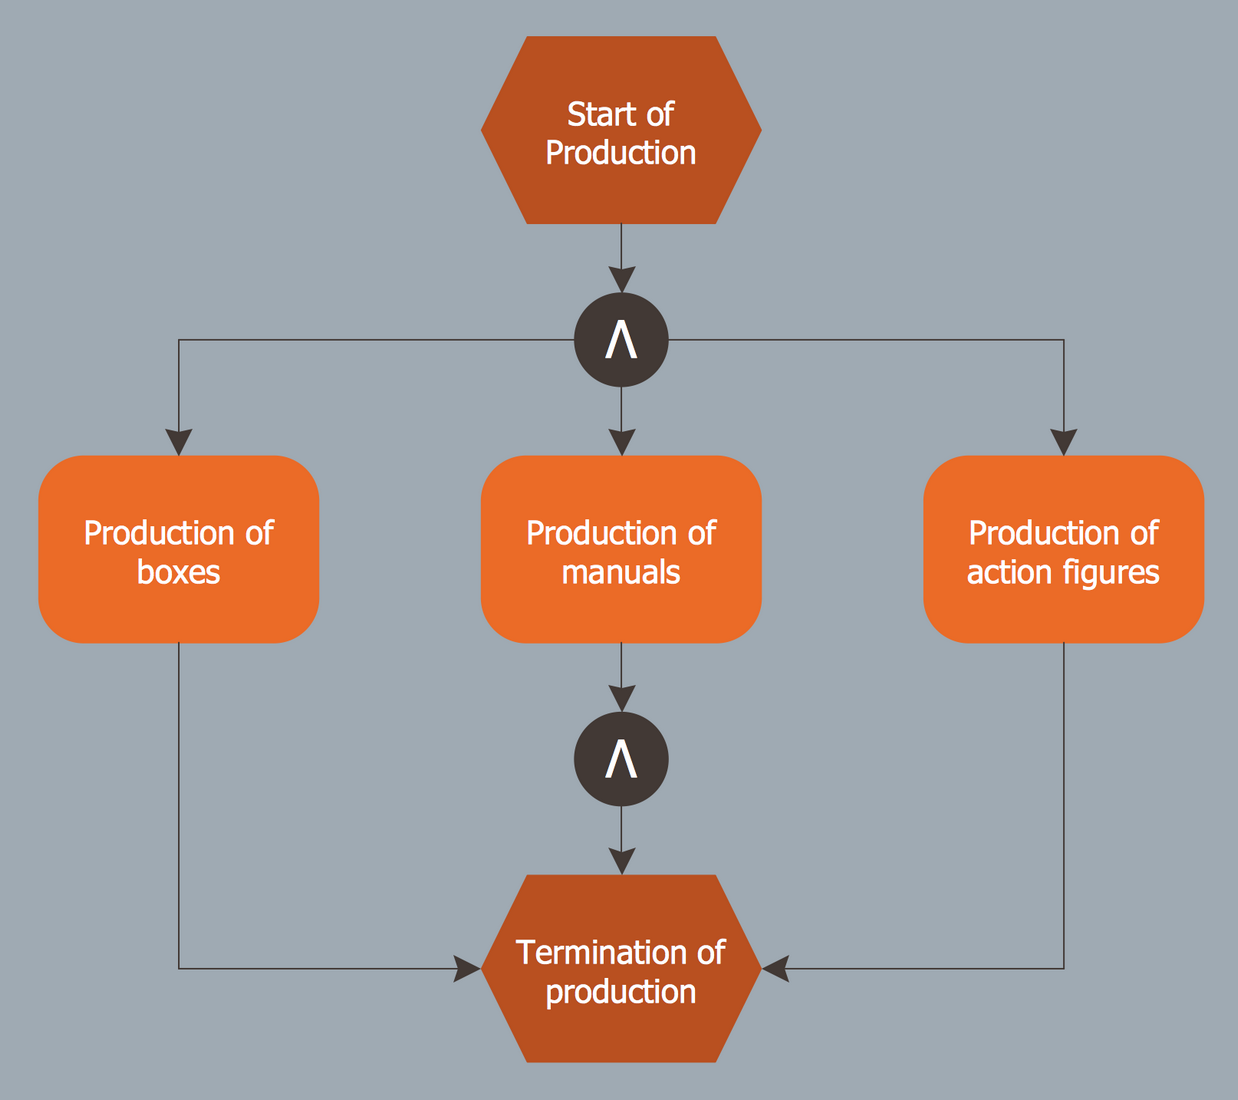
This Event-driven process chain (EPC) diagram sample was designed based on the Wikimedia Commons file "EPC priklad2.png" and represents the nested production process. The nested process is a process that is under a certain action, while it is either large enough or not so important to be included in the main business process. The nested process keeps the diagram strict and clear, makes it easily readable and understandable. If we are talking about a complex and long process, with the help of nested processes it can be easily structured by dividing into the parts and allocating the subprocesses. The presented process starts with the 'Start of production' event, which was called from the main process. Then, this process is divided into three streams: 'Production of boxes', 'Production of manuals', 'Production of action figures' which then need to be combined again, after which the 'Termination of production' event occurs, the subprocess is completed and the main process continues to run.
Example 9: EPC Diagram — Order Processing
This diagram was created in ConceptDraw DIAGRAM using the EPC Diagrams library from the Event-driven Process Chain Diagrams solution. An experienced user spent 10 minutes creating this sample.
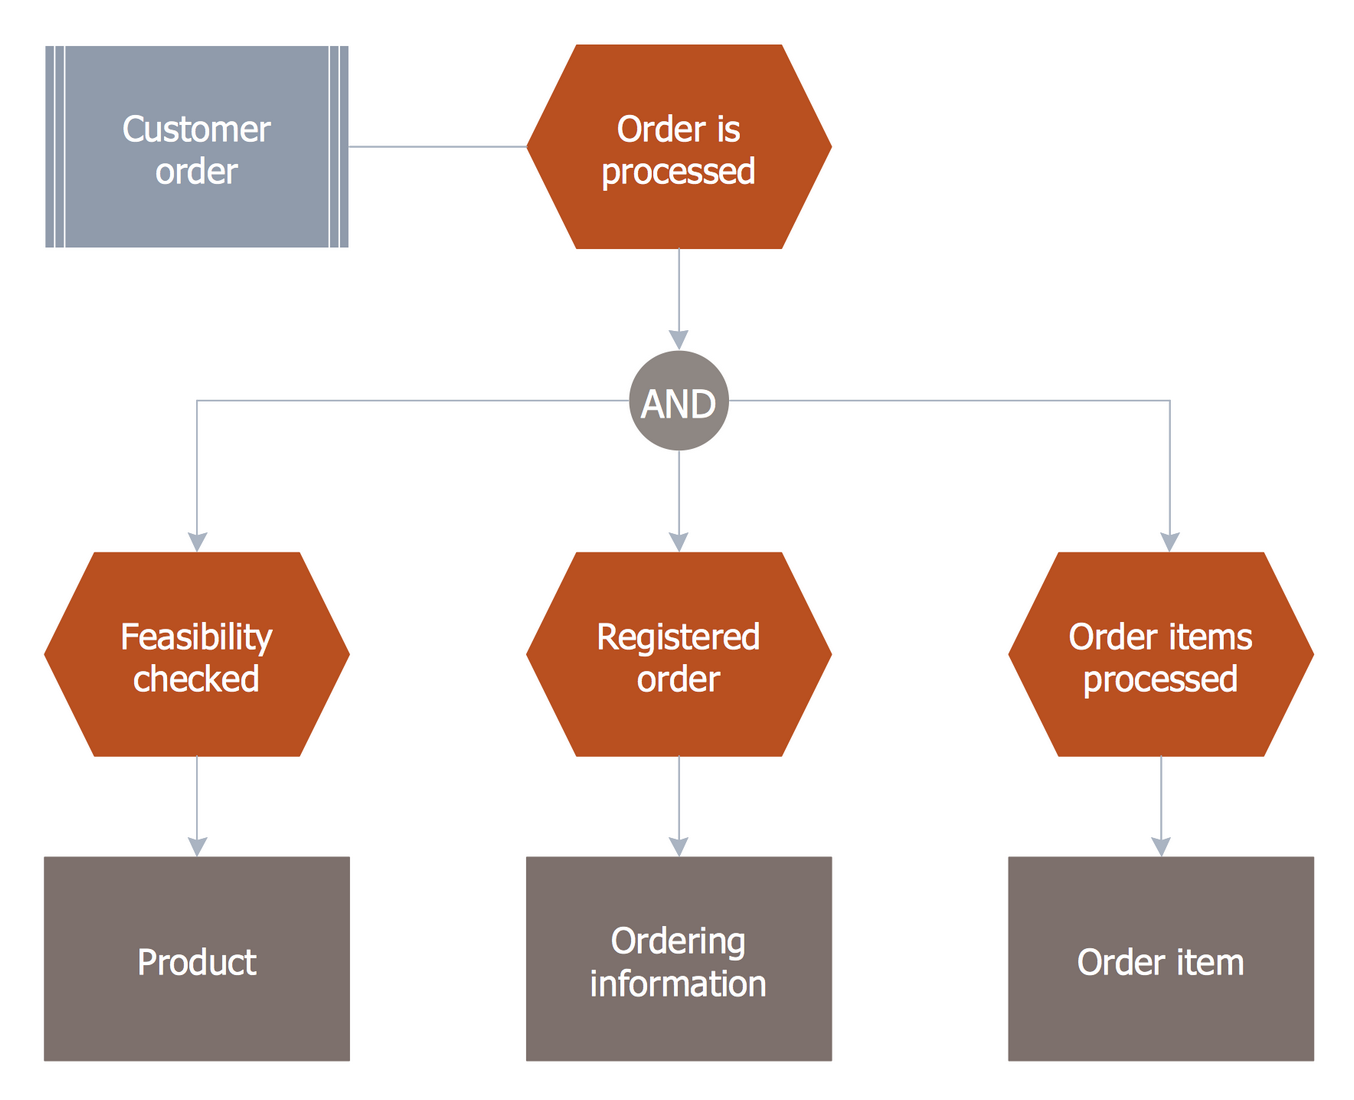
This Business process modeling (BPM) event-driven process chain (EPC) diagram sample illustrates the order processing flow. The process starts from the moment when a customer makes an order, then this order is processed and divided into three flows: ‘Feasibility checked’, ‘Registered order’, and ‘Order items processed’. The output data of the process are the product, ordering information, and order item. The logical operator AND is used in this diagram and lets one represent the parallel flows, to depict the separation of simultaneous flows of an activity and to synchronize these flows. It is convenient to describe the business processes of an organization using the EPC notation, which is a generally accepted standard for outlining the organization's activities, and even more convenient and efficient is to have the specialized drawing tools, professional EPC solutions and the ready-made Event-driven process chain vector design shapes offered by ConceptDraw's Event-driven Process Chain Diagrams solution that allows constructing the EPC flowcharts literally in minutes.
Example 10: EPC Diagram — Event and Activity
This diagram was created in ConceptDraw DIAGRAM using the EPC Diagrams library from the Event-driven Process Chain Diagrams solution. An experienced user spent 10 minutes creating this sample.
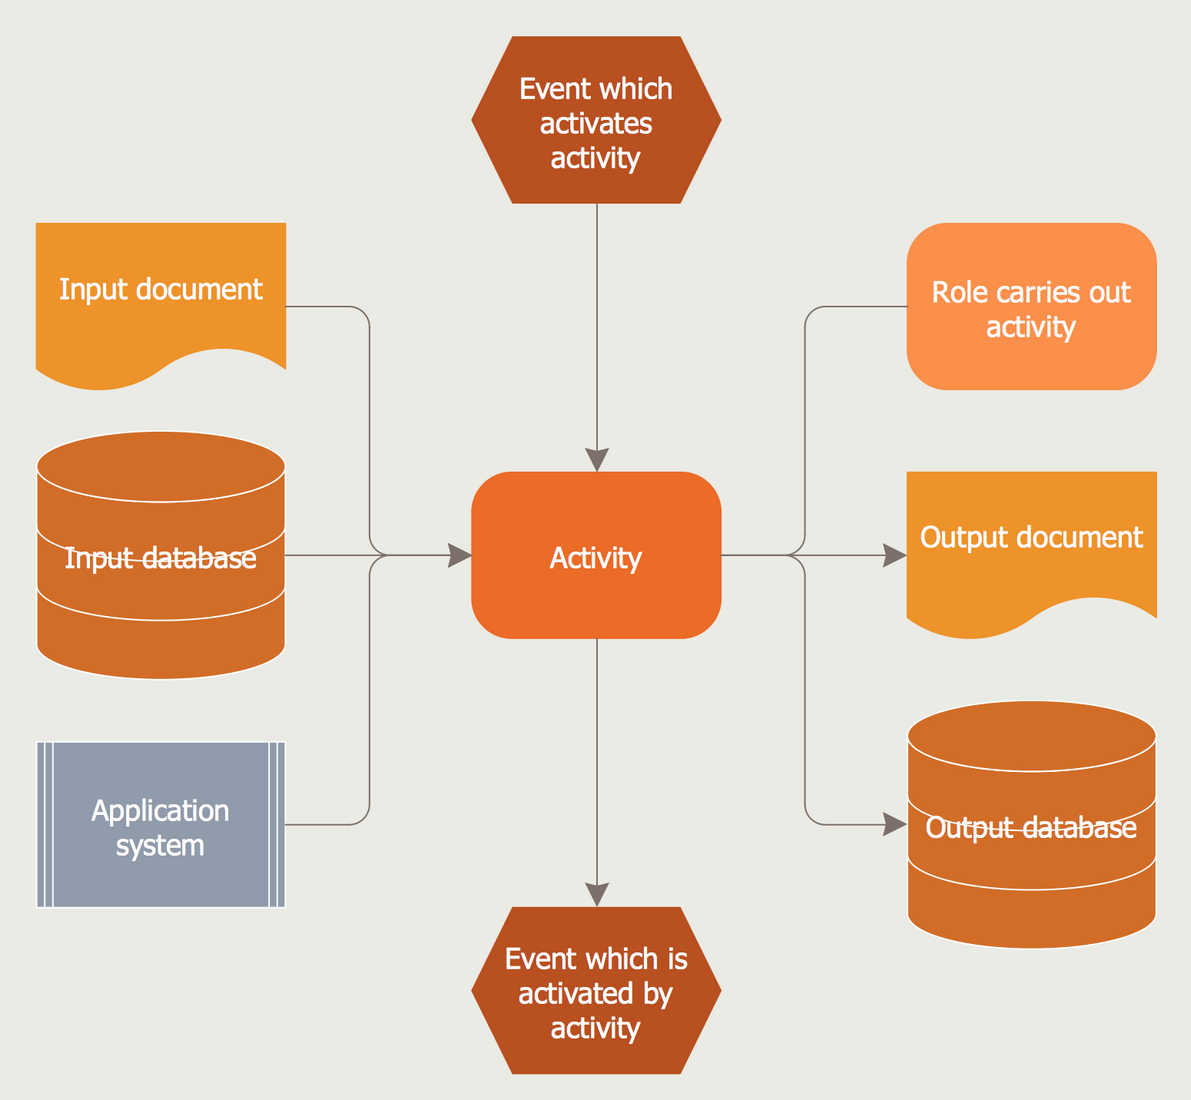
This EPC diagram sample was constructed based on the "Example of the EPC diagram" illustration published at the "Methodological guidelines and recommendations for efficient and rational governance of patient registries" article on the Parent-Wiki website. This EPC that is the main ARIS model for representing processes depicts the events and activities, and relationships between them. It is a dynamic model that unites the static resources of the business and organizes them to perform the different tasks or activities increasing the business value. You can see the activity in the middle of the diagram, at the top there is an event that activates the action, and below is the event that is activated by the action. When an event activates an action, it creates one or more new events. Since incoming items are input document, input database, and application system, as the output you can see the output database, output document, and the role that carries out activity.
Inside
What I Need to Get Started
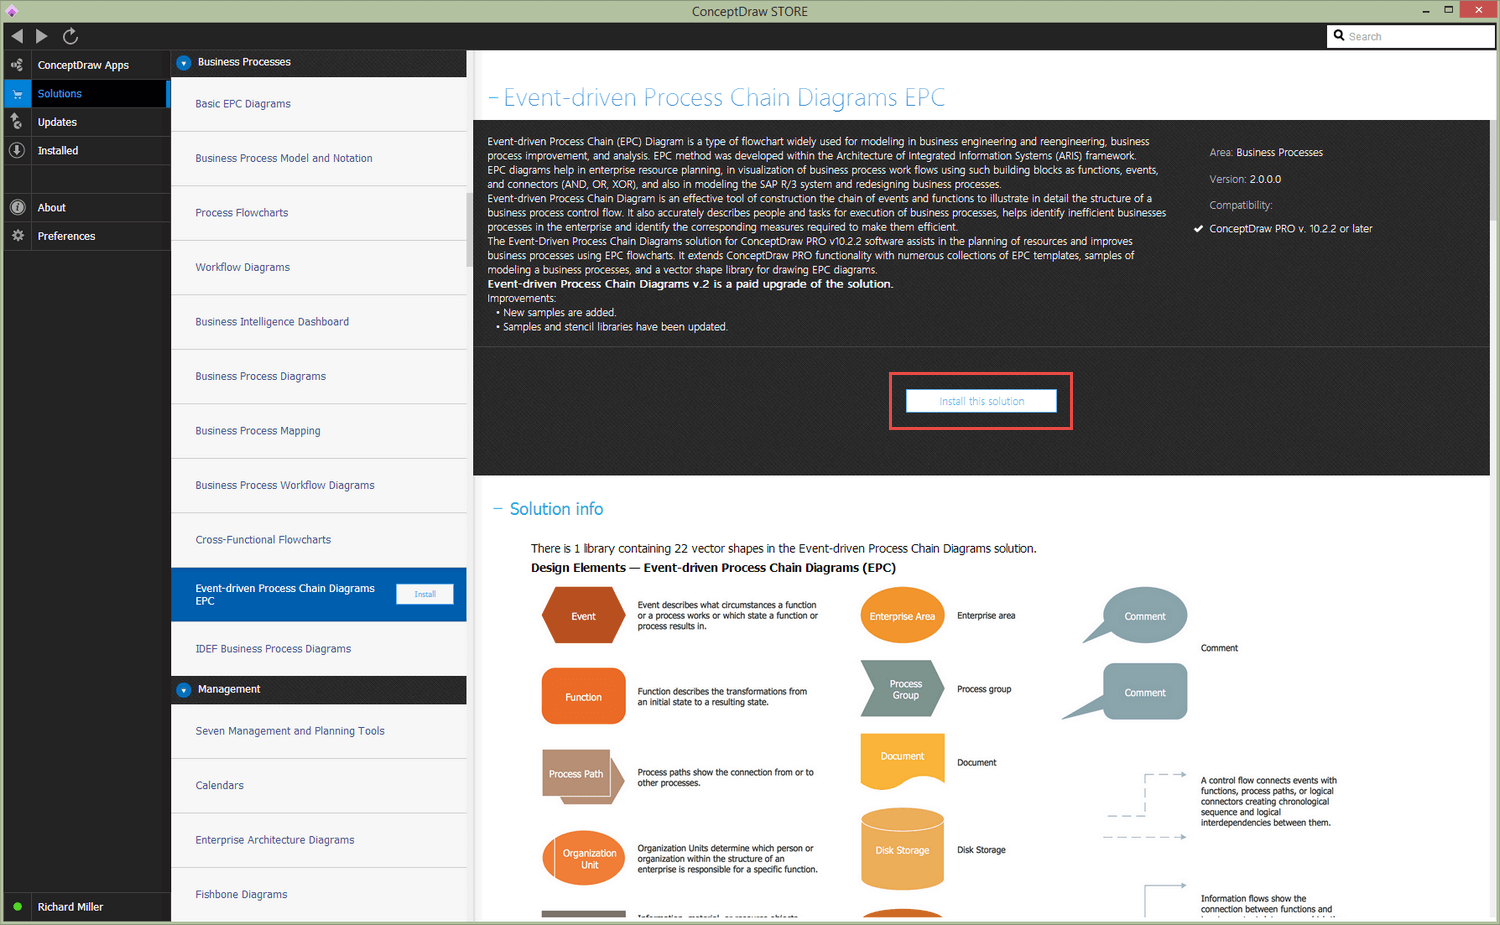
Both ConceptDraw DIAGRAM diagramming and drawing software and the Event-driven Process Chain Diagrams solution can help creating the business processes diagrams you need. The Event-driven Process Chain Diagrams solution can be found in the Business Processes area of ConceptDraw STORE application that can be downloaded from this site. Make sure that both ConceptDraw DIAGRAM and ConceptDraw STORE applications are installed on your computer before you get started.
How to install
After ConceptDraw STORE and ConceptDraw DIAGRAM are downloaded and installed, you can install the Event-driven Process Chain Diagrams solution from the ConceptDraw STORE.
Start using
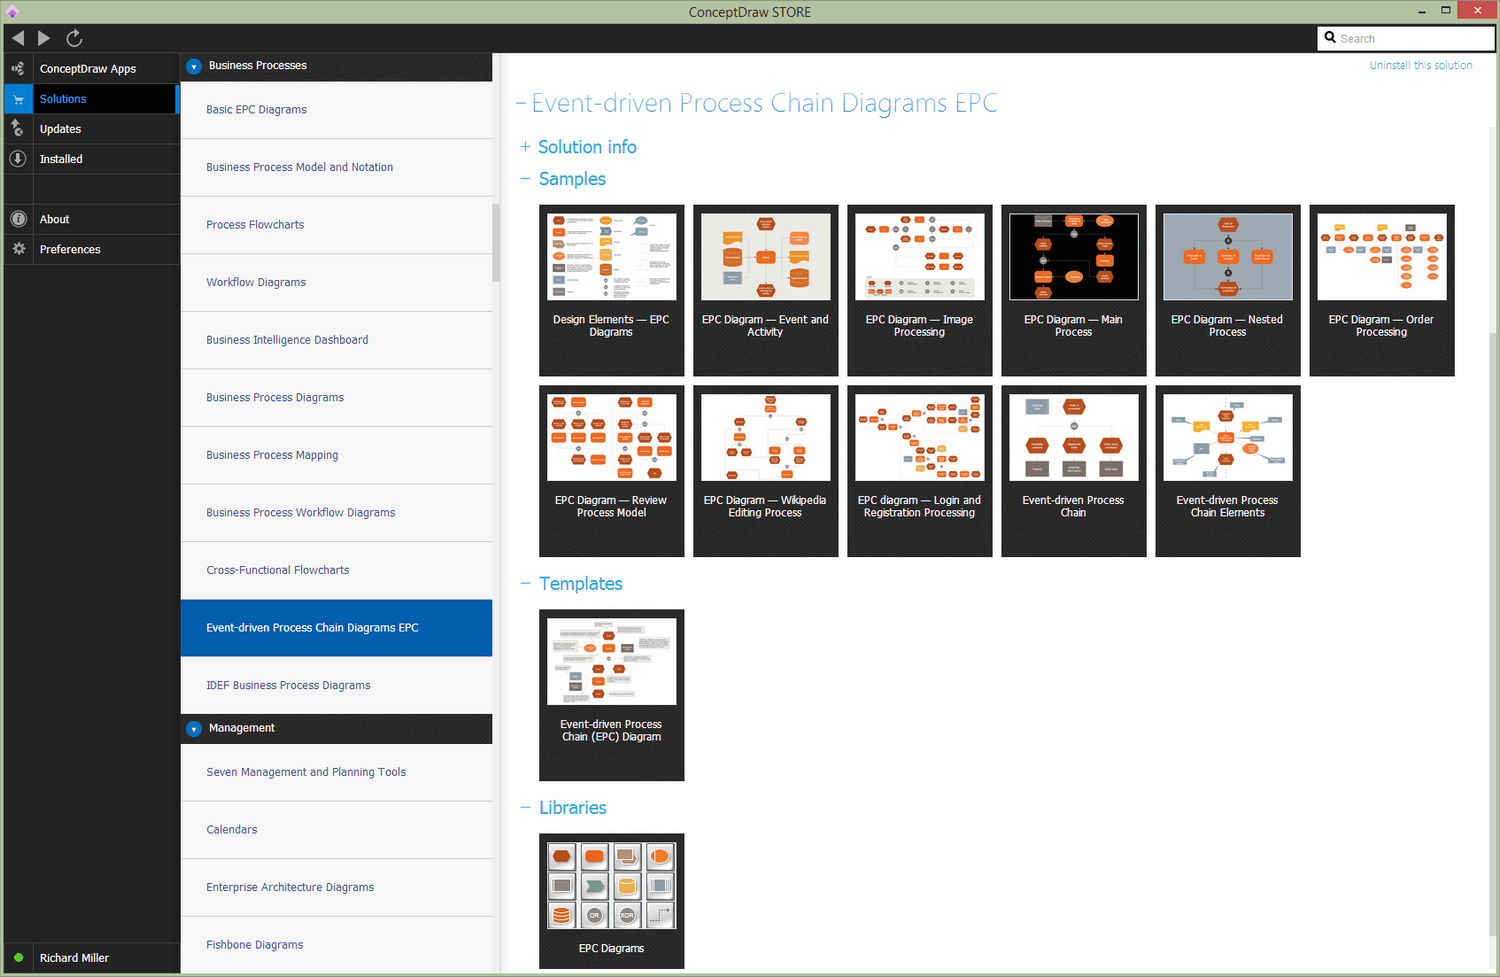
To make sure that you are doing it all right, use the pre-designed symbols from the stencil libraries from the solution to make your drawings look smart and professional. Also, the pre-made examples from this solution can be used as drafts so your own drawings can be based on them. Using the samples, you can always change their structures, colors and data.
Event-Driven Process Chain Diagram
An event-driven process chain diagram is a flowchart used in business process analysis. It evolved from Architecture of Integrated Information Systems (ARIS) and utilised in the business process improvement and analysis. It is also used to facilitate enterprise resource planning.
An EPC diagram is a complex flowchart that shows different business processes through various workflows. The workflows are seen as functions and events that are connected by different teams or people, as well as tasks that allow business processes to be executed.
The best thing about this type of enterprise modelling is that creating an EPC diagram is quick and simple as long as you have the proper tool.
There are several ways in which organisations use EPC diagrams. One of the main usages of the tool is in the modelling, analysing and reengineering of business processes. With the use of the flowchart, businesses are able to see inefficiencies in the processes and modify to make them more productive.
Event-driven process chain diagrams are also used to configure an enterprise resource planning system. For instance, EPC diagrams were used by SAP to document the processes utilised by their SAP R/3 software.
EPC method was developed within the ARIS framework. It is a dynamic model that utilises all the static resources of the business and organises them to show the activities and tasks that bring value to the business.
An EPC diagram is a multifaceted method of analysing business processes. It makes sure that all the elements are indicated and business owners or managers are able to pinpoint duplication or inefficiencies of tasks and inputs. Just like any ARIS business process modelling method, EPC diagram is an indispensable tool to help businesses analyse and improve their processes.
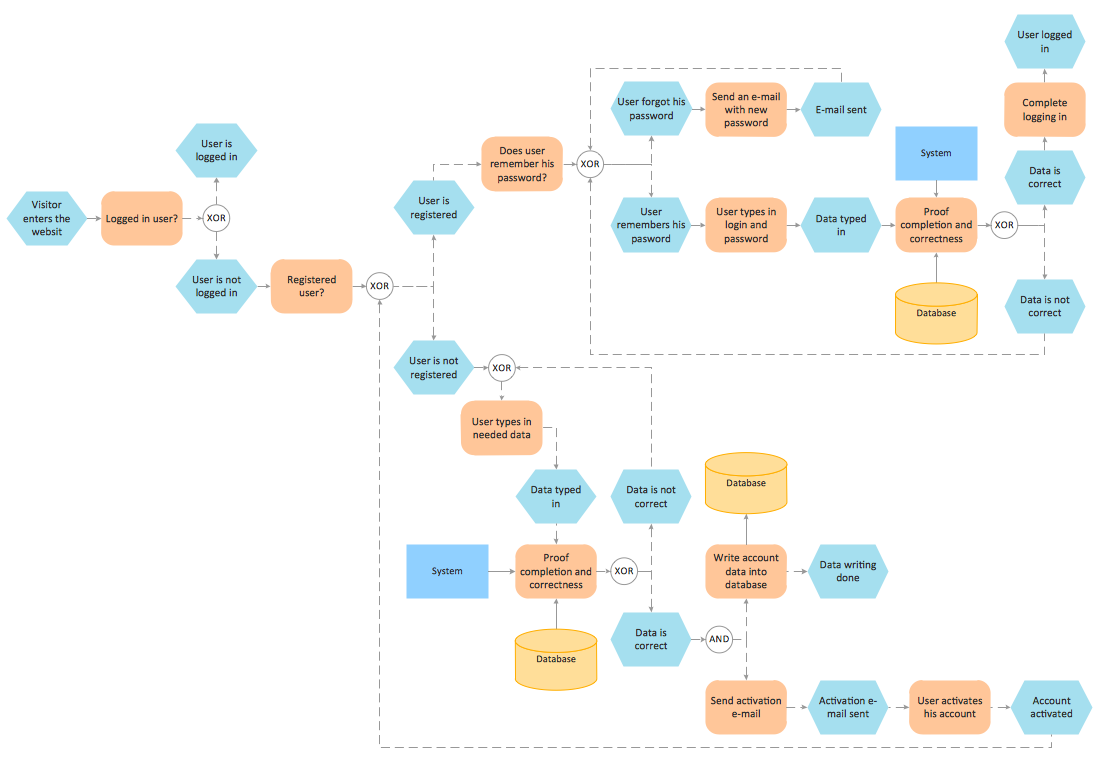
Figure 1. EPC diagram — Login and registration processing Sample
Different shapes represent the elements of the flowchart. That’s why it is an effective visual diagram for business process modelling that displays detailed information in a straightforward manner. One look and you can easily find out what there is to know about the business process.
Events — These are found at the beginning and end of the EPC diagram. Events are often passive and they don’t require any actions. They are represented by hexagons.
Functions — Functions are the tasks and duties that the company does. Only the more active tasks are included in the EPC diagram. They describe the activities of the company, which is often depicted by rectangles with rounded corners.
Resources, Information and Materials – These are represented by rectangles of different colours. They are real objects and items that feed towards the functions.
Control Flows — Control flows are the dashed arrows in an EPC diagram that shows how the elements are interdependent with each other.
Logical Connector — This element shows the logical relationship between the functions and events. They show the various forks or branches in the control flow of the business process.
Organisation Units — These are seen as ellipses with a vertical line. They represent individuals or teams that are responsible for a specific function.
There are other symbols used in an EPC diagram that represents the process path, information flows, and other stuff to provide an in-depth business process analysis. Look at the illustration below to learn more about the other design elements of an EPC diagram.
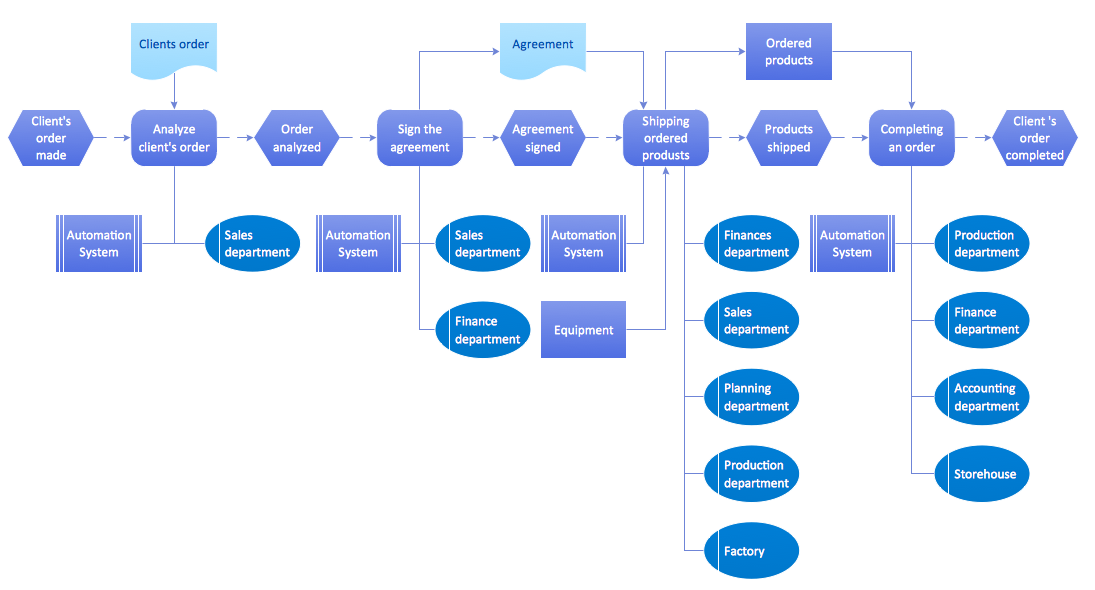
Figure 2. EPC diagram — Order processing Sample
ConceptDraw DIAGRAM is a diagramming software that allows users to create event-process chain diagrams. Before one can draw EPC diagrams with the software, the user must first download Event-process Chain Diagrams solution from the Business Processes area of the ConceptDraw Solution Park. It includes EPC diagram samples; vector stencils libraries, and templates.
With the use of the Event-process Chain Diagrams solution, organisations can effortlessly plan their resources and improve business processes through flowcharts. The ConceptDraw Solution Park also provides various learning media for beginner and advanced users. The easy-to-follow tutorials allow users to create EPC diagrams in no time.
ConceptDraw DIAGRAM with the Event-Driven Process Chain Diagrams solution is an indispensible tool for companies that want to use EPC diagrams in organising and improving their business processes.