- Electric and Telecom Plans Free
- Fire and Emergency Plans Free
- Floor Plans Free
- Plant Layout Plans Free
- School and Training Plans Free
- Seating Plans Free
- Security and Access Plans Free
- Site Plans Free
- Sport Field Plans Free
- Business Process Diagrams Free
- Business Process Mapping Free
- Classic Business Process Modeling Free
- Cross-Functional Flowcharts Free
- Event-driven Process Chain Diagrams Free
- IDEF Business Process Diagrams Free
- Logistics Flow Charts Free
- Workflow Diagrams Free
- ConceptDraw Dashboard for Facebook Free
- Mind Map Exchange Free
- MindTweet Free
- Note Exchange Free
- Project Exchange Free
- Social Media Response Free
- Active Directory Diagrams Free
- AWS Architecture Diagrams Free
- Azure Architecture Free
- Cisco Network Diagrams Free
- Cisco Networking Free
- Cloud Computing Diagrams Free
- Computer Network Diagrams Free
- Google Cloud Platform Free
- Interactive Voice Response Diagrams Free
- Network Layout Floor Plans Free
- Network Security Diagrams Free
- Rack Diagrams Free
- Telecommunication Network Diagrams Free
- Vehicular Networking Free
- Wireless Networks Free
- Comparison Dashboard Free
- Composition Dashboard Free
- Correlation Dashboard Free
- Frequency Distribution Dashboard Free
- Meter Dashboard Free
- Spatial Dashboard Free
- Status Dashboard Free
- Time Series Dashboard Free
- Basic Circle-Spoke Diagrams Free
- Basic Circular Arrows Diagrams Free
- Basic Venn Diagrams Free
- Block Diagrams Free
- Concept Maps Free
- Family Tree Free
- Flowcharts Free
- Basic Area Charts Free
- Basic Bar Graphs Free
- Basic Divided Bar Diagrams Free
- Basic Histograms Free
- Basic Line Graphs Free
- Basic Picture Graphs Free
- Basic Pie Charts Free
- Basic Scatter Diagrams Free
- Aerospace and Transport Free
- Artwork Free
- Audio, Video, Media Free
- Business and Finance Free
- Computers and Communications Free
- Holiday Free
- Manufacturing and Maintenance Free
- Nature Free
- People Free
- Presentation Clipart Free
- Safety and Security Free
- Analog Electronics Free
- Audio and Video Connectors Free
- Basic Circuit Diagrams Free
- Chemical and Process Engineering Free
- Digital Electronics Free
- Electrical Engineering Free
- Electron Tube Circuits Free
- Electronic Block Diagrams Free
- Fault Tree Analysis Diagrams Free
- GHS Hazard Pictograms Free
- Home Automation and Wiring Free
- Mechanical Engineering Free
- One-line Diagrams Free
- Power Сircuits Free
- Specification and Description Language (SDL) Free
- Telecom and AV Circuits Free
- Transport Hazard Pictograms Free
- Data-driven Infographics Free
- Pictorial Infographics Free
- Spatial Infographics Free
- Typography Infographics Free
- Calendars Free
- Decision Making Free
- Enterprise Architecture Diagrams Free
- Fishbone Diagrams Free
- Organizational Charts Free
- Plan-Do-Check-Act (PDCA) Free
- Seven Management and Planning Tools Free
- SWOT and TOWS Matrix Diagrams Free
- Timeline Diagrams Free
- Australia Map Free
- Continent Maps Free
- Directional Maps Free
- Germany Map Free
- Metro Map Free
- UK Map Free
- USA Maps Free
- Customer Journey Mapping Free
- Marketing Diagrams Free
- Matrices Free
- Pyramid Diagrams Free
- Sales Dashboard Free
- Sales Flowcharts Free
- Target and Circular Diagrams Free
- Cash Flow Reports Free
- Current Activities Reports Free
- Custom Excel Report Free
- Knowledge Reports Free
- MINDMAP Reports Free
- Overview Reports Free
- PM Agile Free
- PM Dashboards Free
- PM Docs Free
- PM Easy Free
- PM Meetings Free
- PM Planning Free
- PM Presentations Free
- PM Response Free
- Resource Usage Reports Free
- Visual Reports Free
- House of Quality Free
- Quality Mind Map Free
- Total Quality Management TQM Diagrams Free
- Value Stream Mapping Free
- Astronomy Free
- Biology Free
- Chemistry Free
- Language Learning Free
- Mathematics Free
- Physics Free
- Piano Sheet Music Free
- Android User Interface Free
- Class Hierarchy Tree Free
- Data Flow Diagrams (DFD) Free
- DOM Tree Free
- Entity-Relationship Diagram (ERD) Free
- EXPRESS-G data Modeling Diagram Free
- IDEF0 Diagrams Free
- iPhone User Interface Free
- Jackson Structured Programming (JSP) Diagrams Free
- macOS User Interface Free
- Object-Role Modeling (ORM) Diagrams Free
- Rapid UML Free
- SYSML Free
- Website Wireframe Free
- Windows 10 User Interface Free
Family Tree
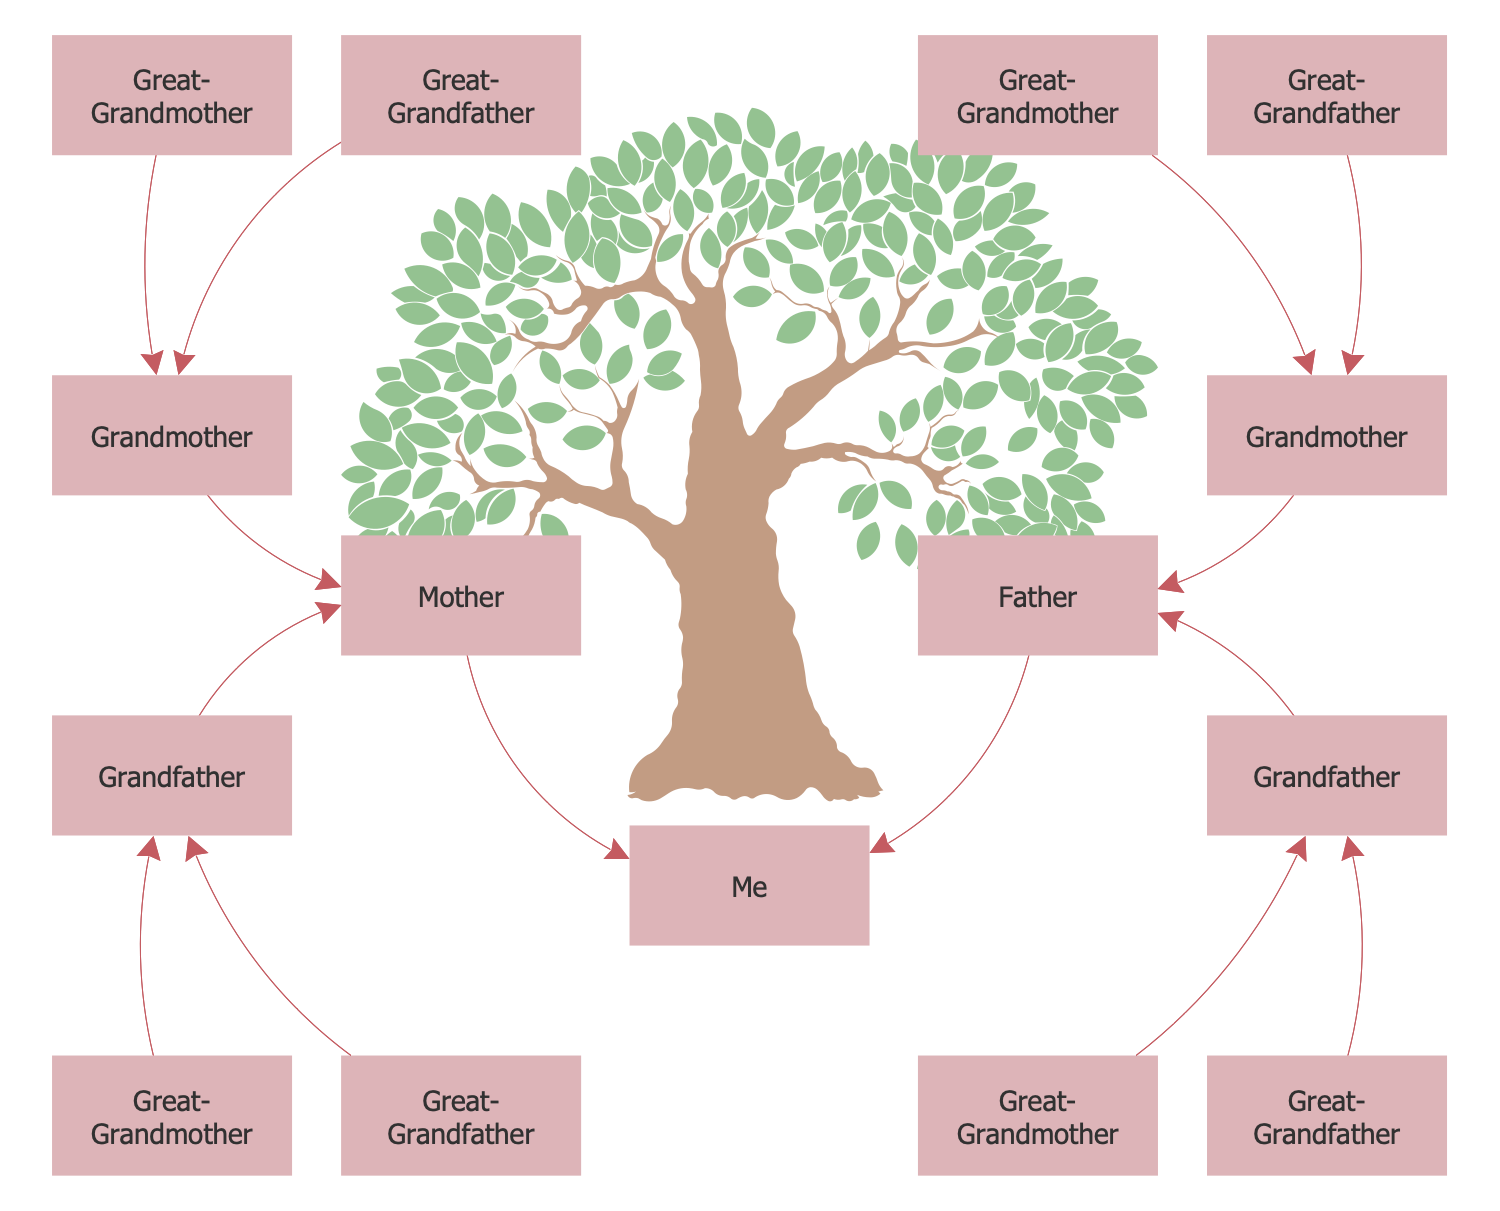
The family tree, also named pedigree tree, ancestry chart, or descendants chart — is a schematic representation of family relationships and links between generations built in a form of a symbolic "tree" on the base of genealogical data. Typically, the family tree is designed from the bottom to top, the older generations are the roots, then on the trunk, branches and leaves generation after generation descendants are represented. However, there are also alternatives of constructing a scheme of the family tree in an inverted form, when the ancestor is located at the diagram’s top and new generations are at the bottom. The variants when an individual appears on the left and his ancestors lie at the right are also met.
The construction of the family tree allows exploring own roots, never forgetting own kinship, remembering the ancestors, keeping the culture and family traditions, finding the now living distant relatives. However, the composing of the accurate family tree requires hard work, the ability of searching and analyzing the discovered information, data clarity and thorough checking of facts.
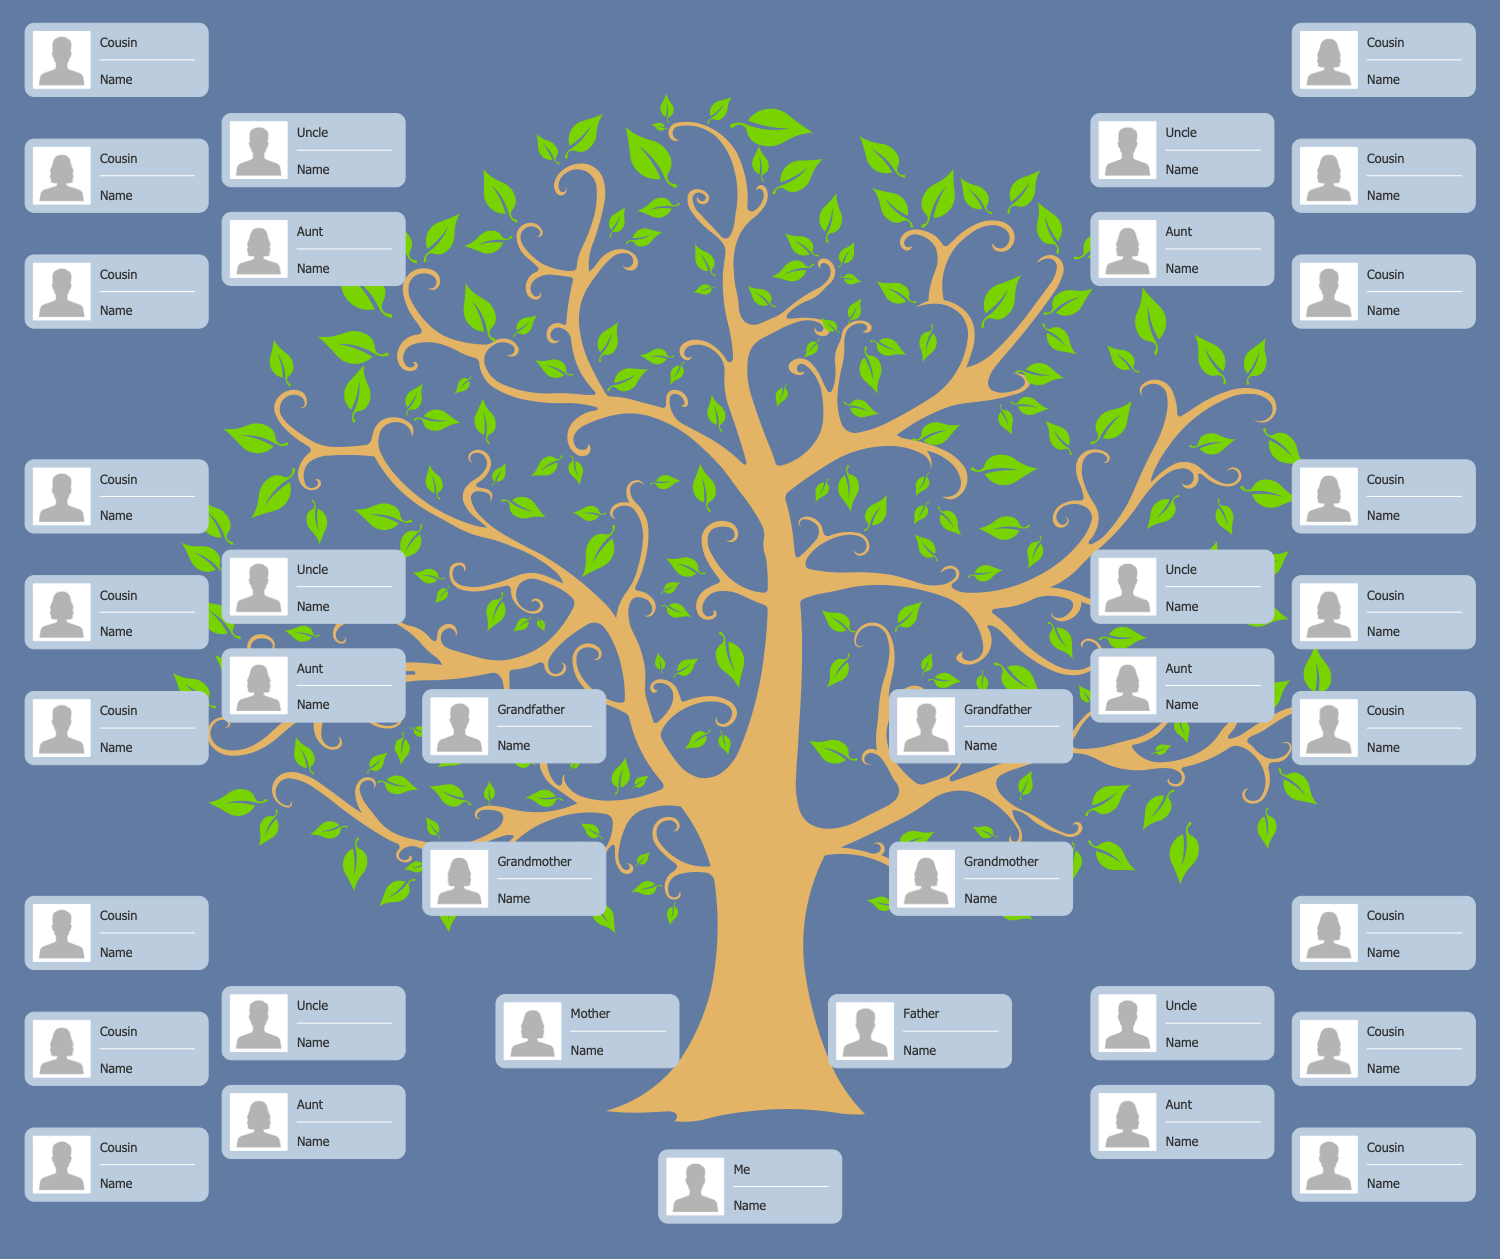
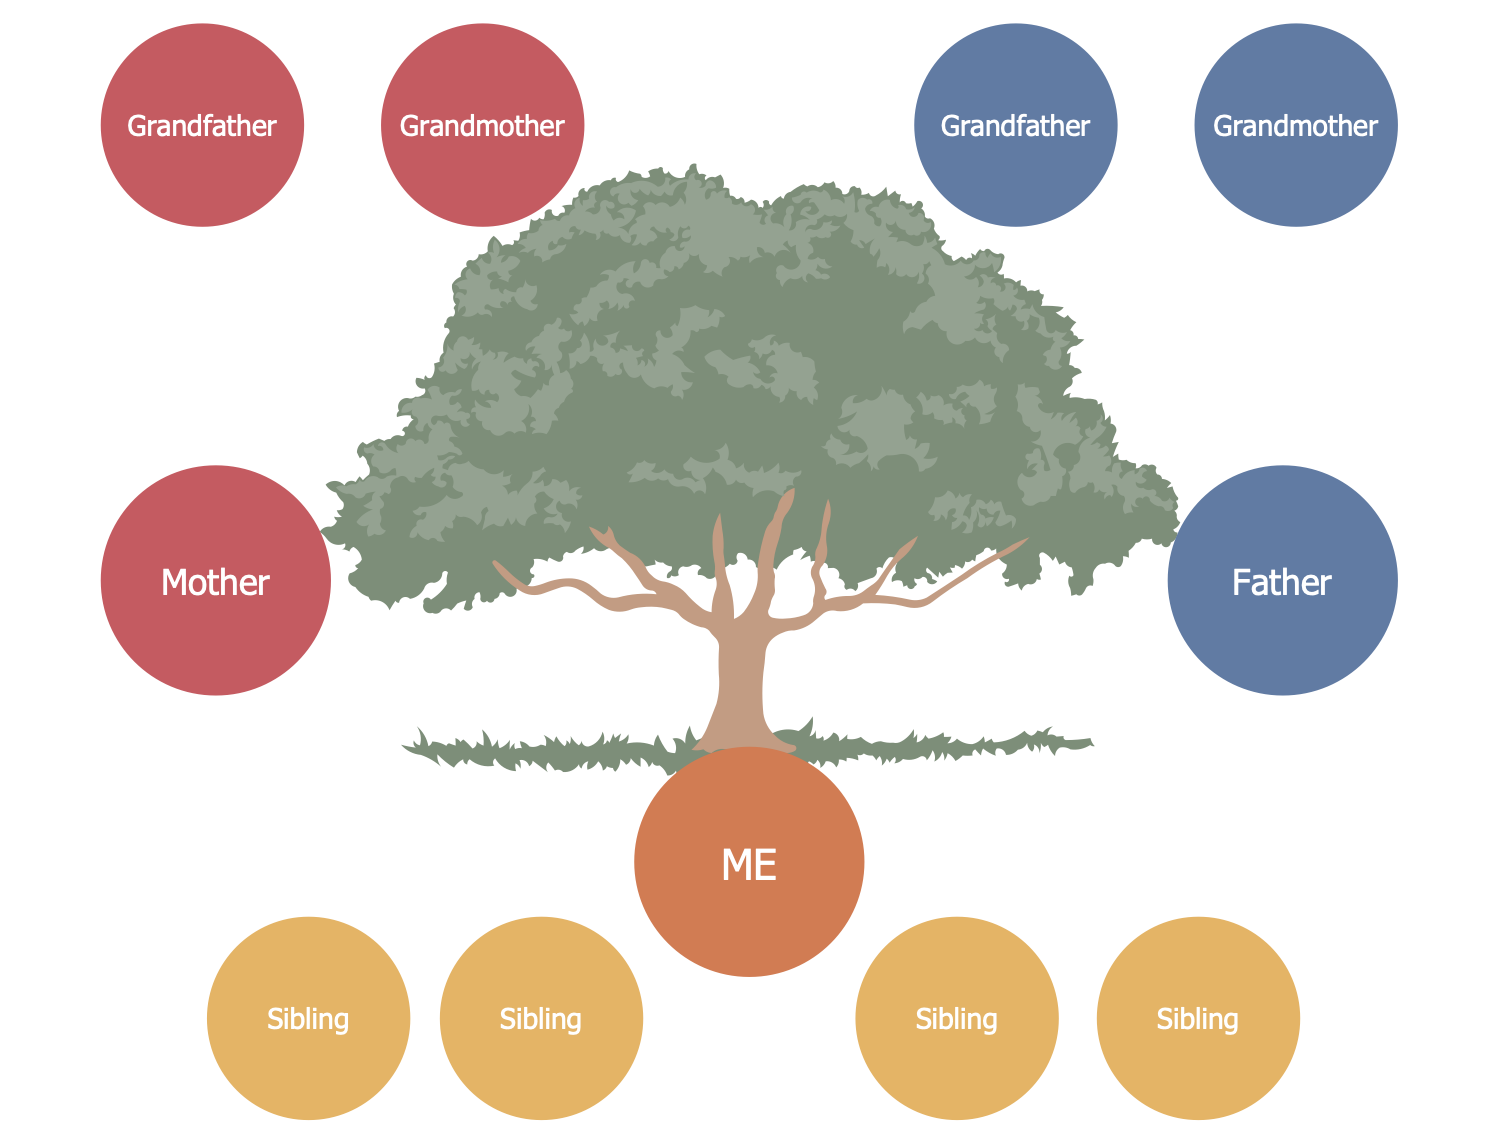
The family trees are really diverse, and if we talk about their design, they can be created on paper, on computer screen and then printed, as well as there can be made incredible masterpieces of art, painted in oil on canvas or carved on the wood, which are very durable and can be handed from generation to generation. In addition to the differences in appearance, the genealogical trees may also differ in the depth of filling. They can cover either all known ancestors of one person, all his direct descendants, several generations of one kinship, or include descendants only by one line of mother or father, sometimes the tree covers all family members with a specific family name, and a huge number of other options is also possible.
To improve the visuality and detailing of the diagram, next to the names of relatives are often marked the date of birth, place of birth, date of death for relatives of previous generations, date of marriage, and other important information.
Family Tree solution extends the functionality of ConceptDraw DIAGRAM software making it the best family tree maker and easy-to-use ancestry trees designer program for researchers, scientists, historians, genetics, medics, archeologists, and other stakeholders. This solution includes a wide range of high-quality vector design shapes for drawing family trees, pedigree chart symbols, photo blocks of different detailing and wide set of professionally designed samples. Use it to design informative and colorful genealogy trees, simple family tree or extensive ancestry tree of any depth, genealogy schematics and illustrations with family trees.
-
Install this solution Free -
What I need to get started -
Solution Requirements - This solution requires the following products to be installed:
ConceptDraw DIAGRAM v18 - This solution requires the following products to be installed:
-
Compatibility - Sonoma (14), Sonoma (15)
MS Windows 10, 11 - Sonoma (14), Sonoma (15)
-
Support for this Solution -
Helpdesk
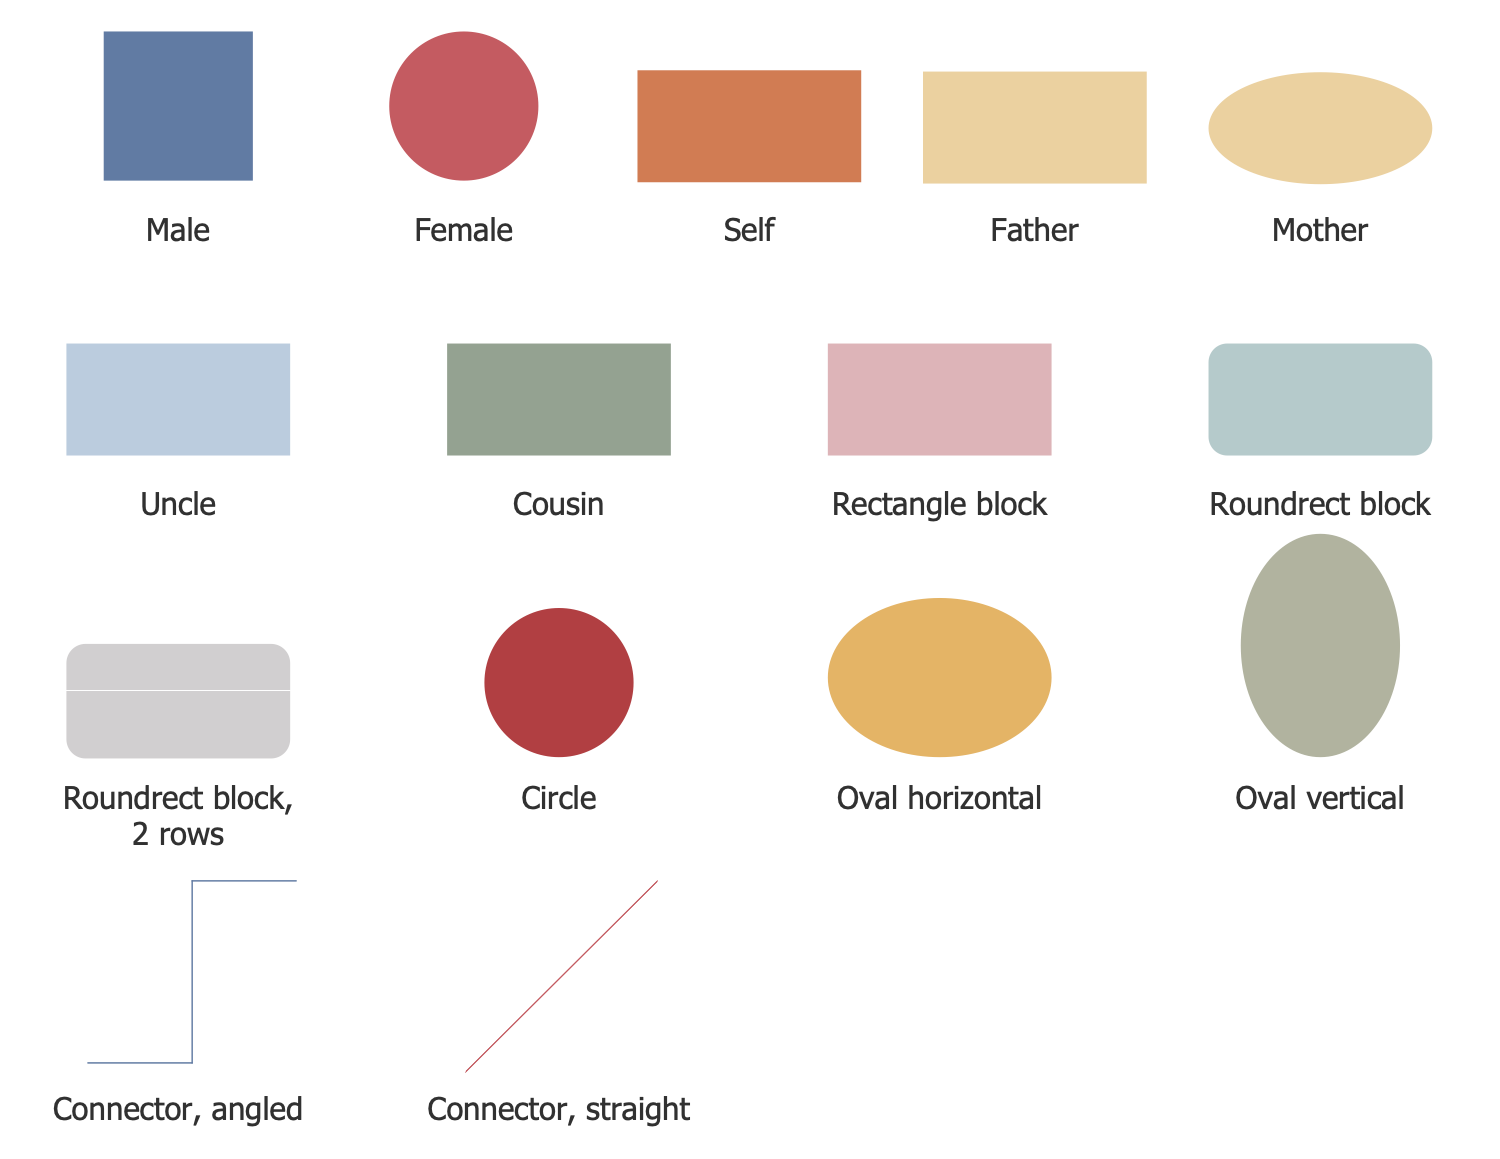
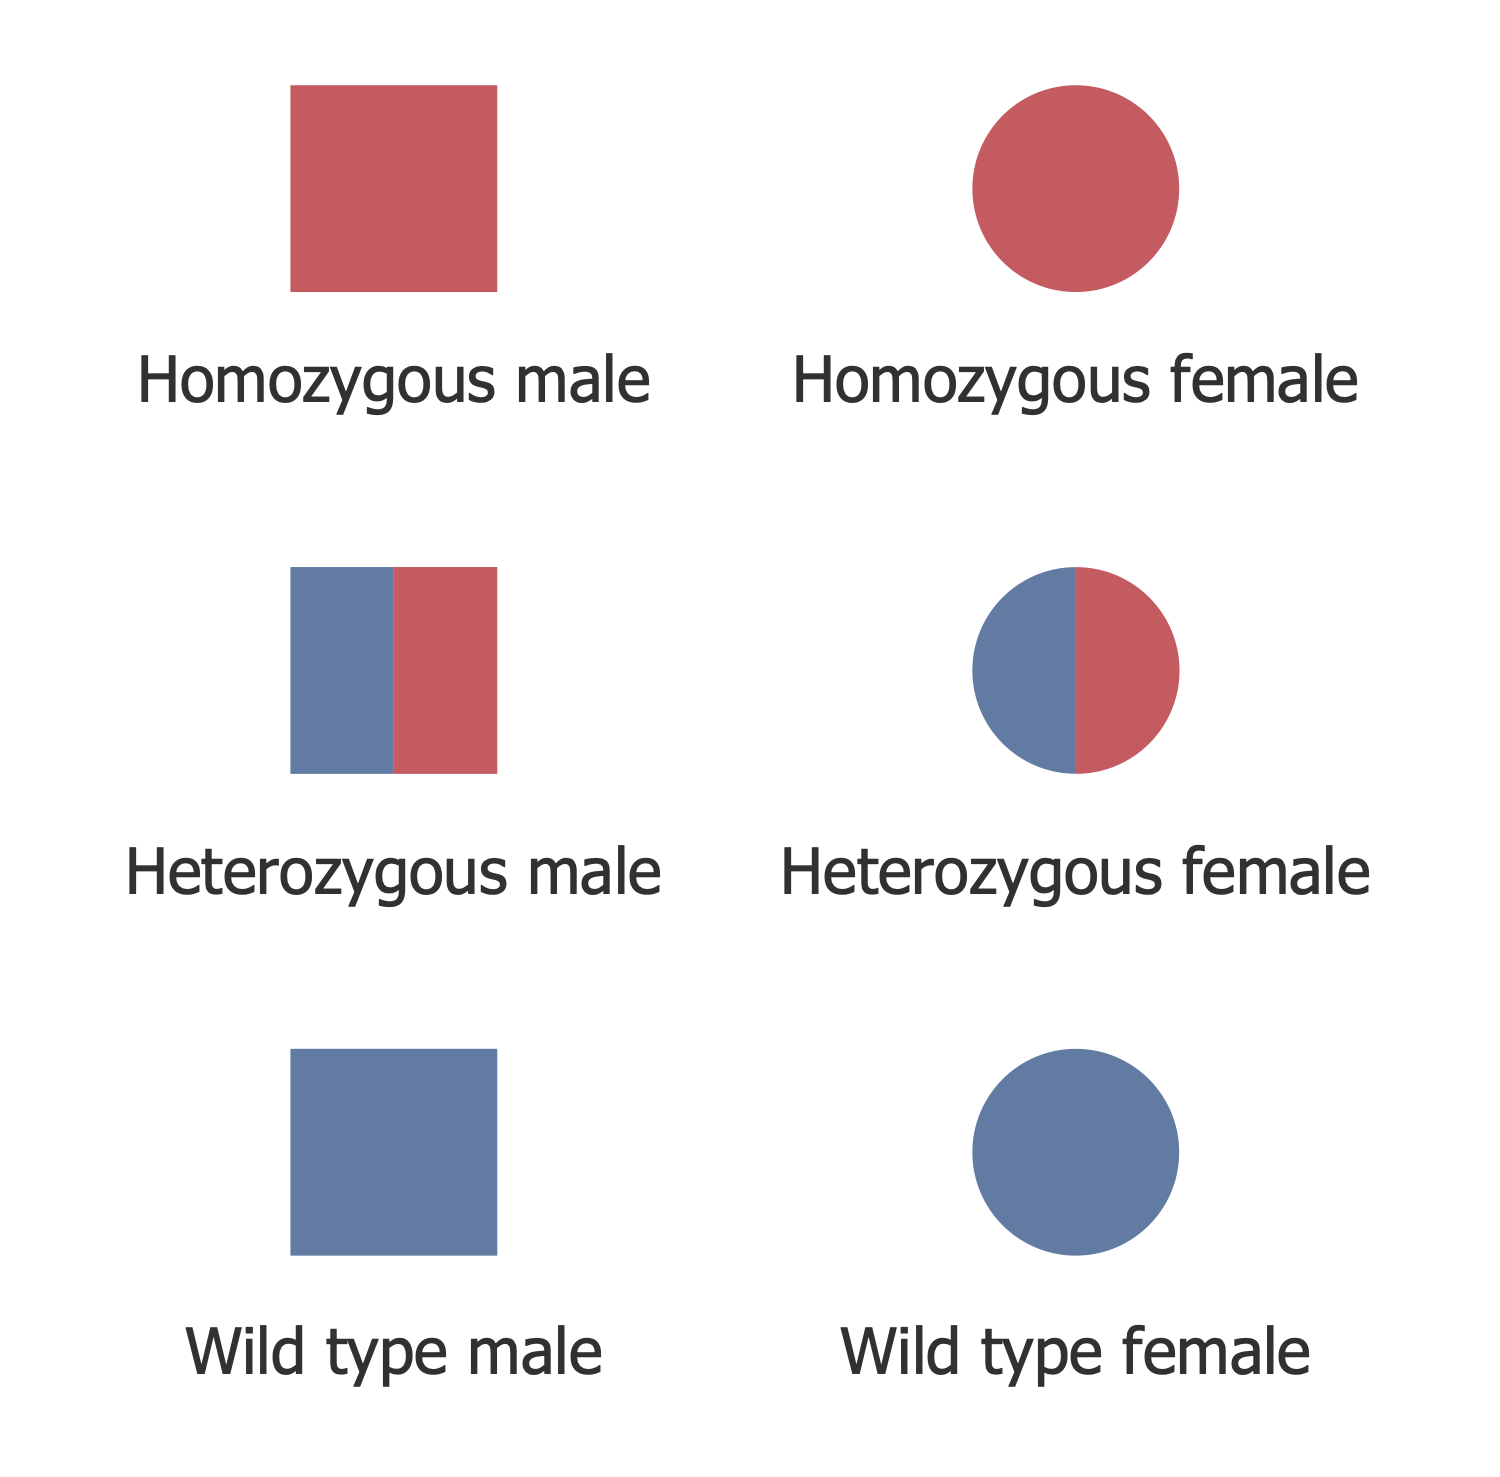
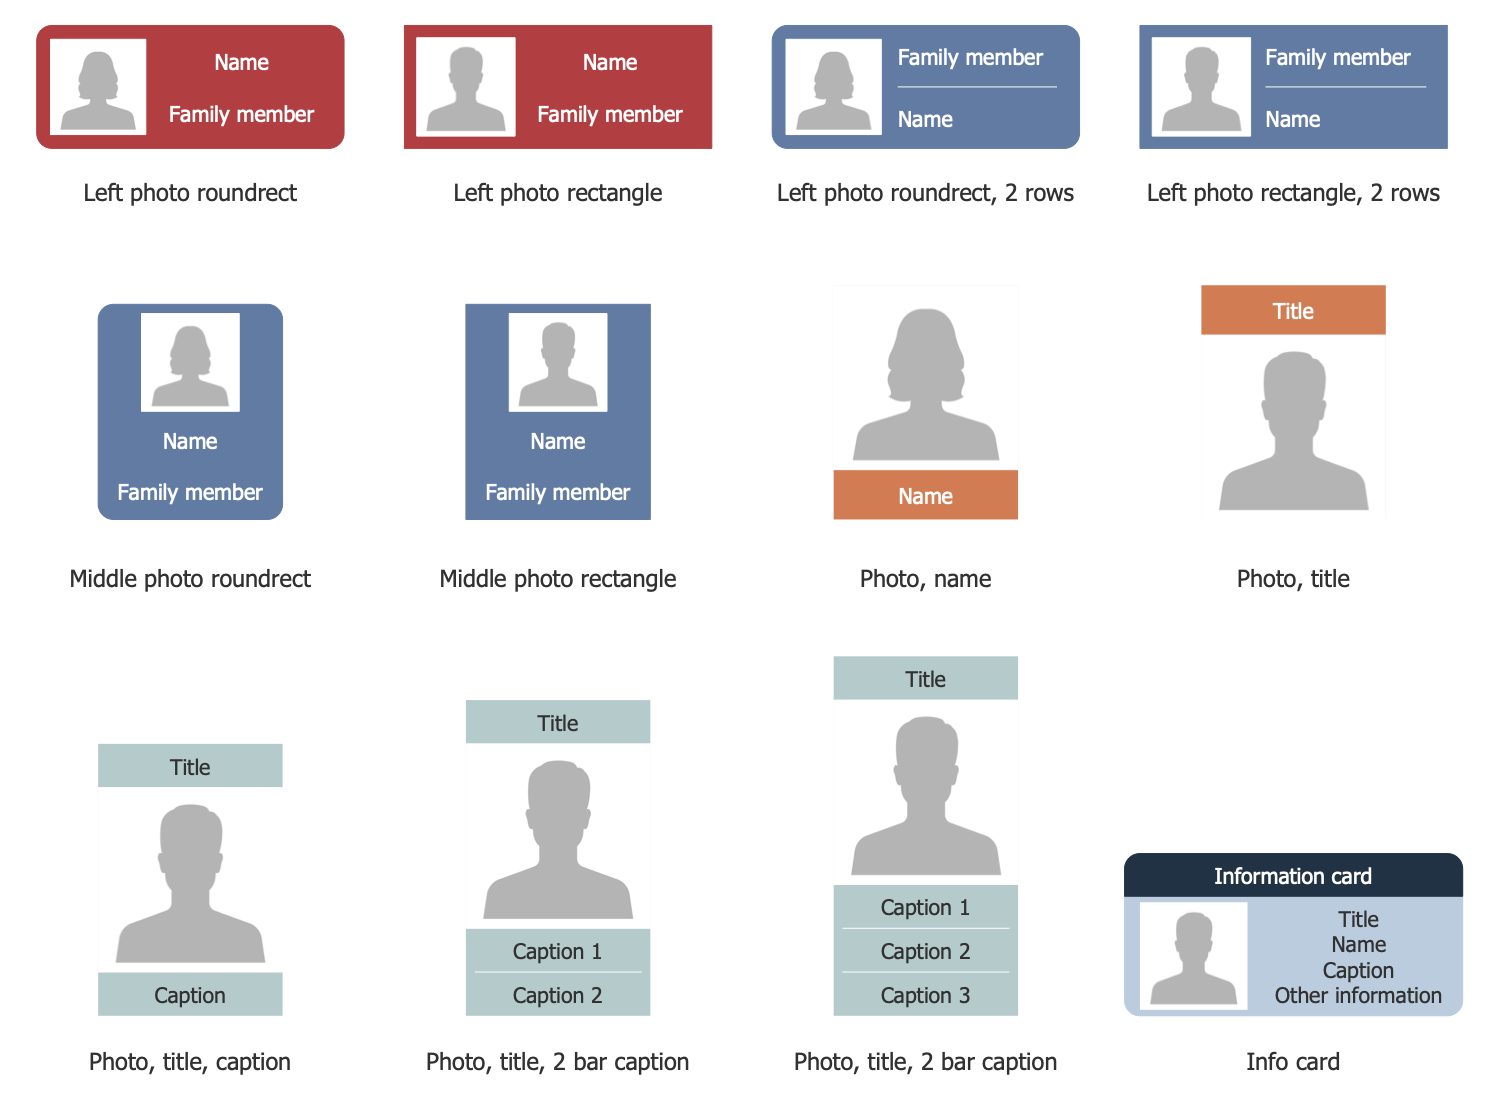
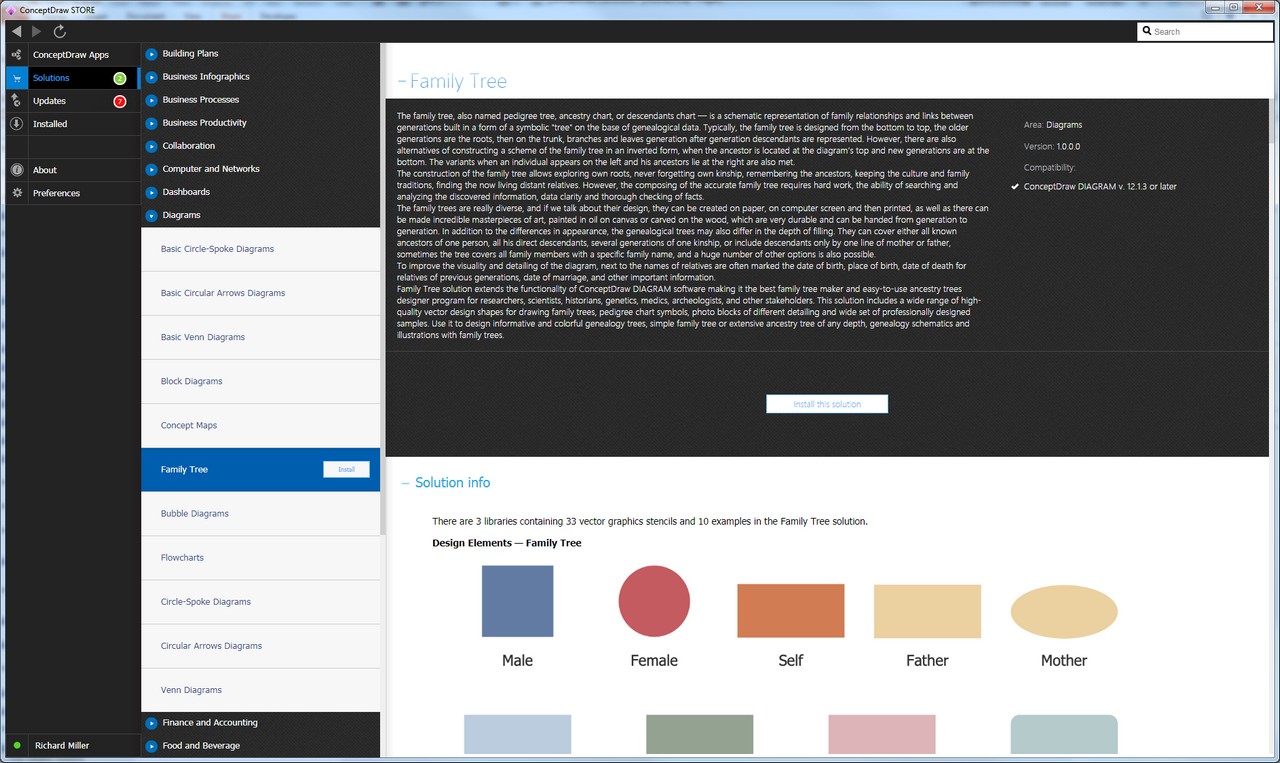
There are 3 libraries containing 33 vector graphics stencils and 10 examples in the Family Tree solution.
Design Elements — Family Tree
Design Elements — Pedigree Chart
Design Elements — Photo Blocks
Related News:
Examples
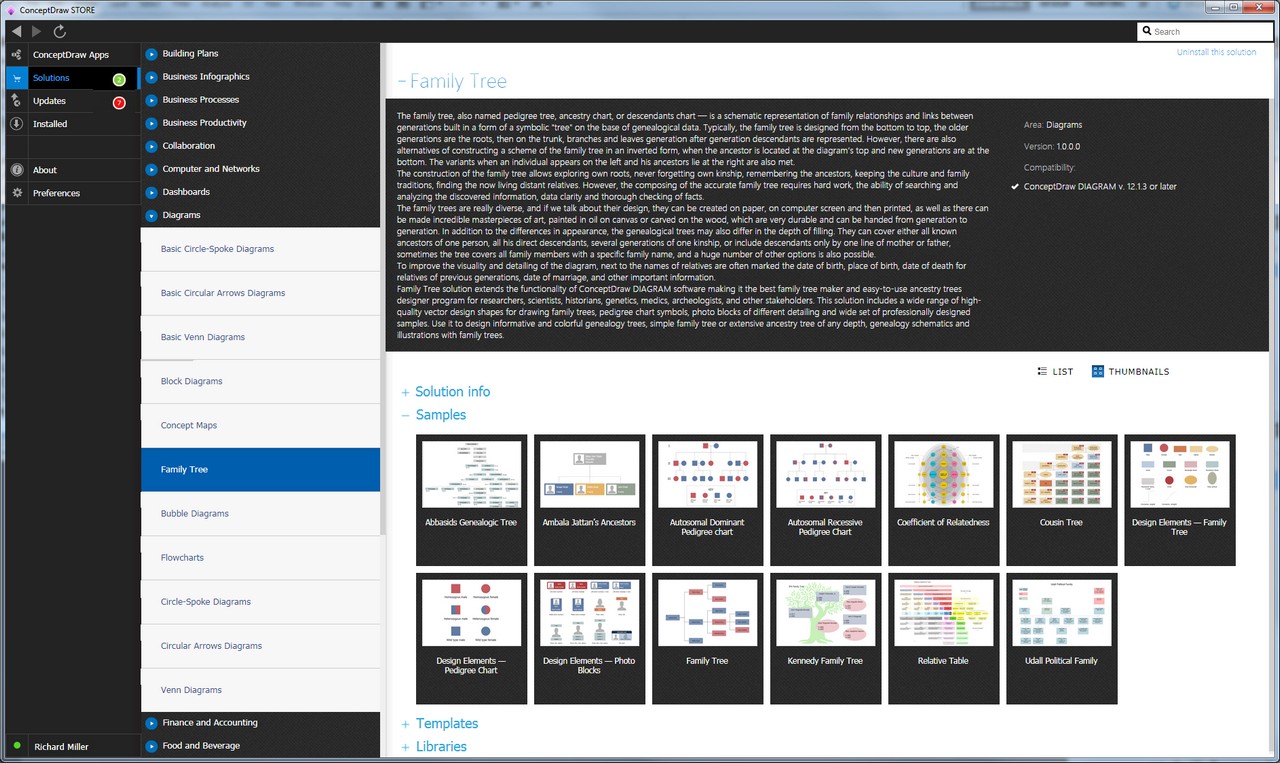
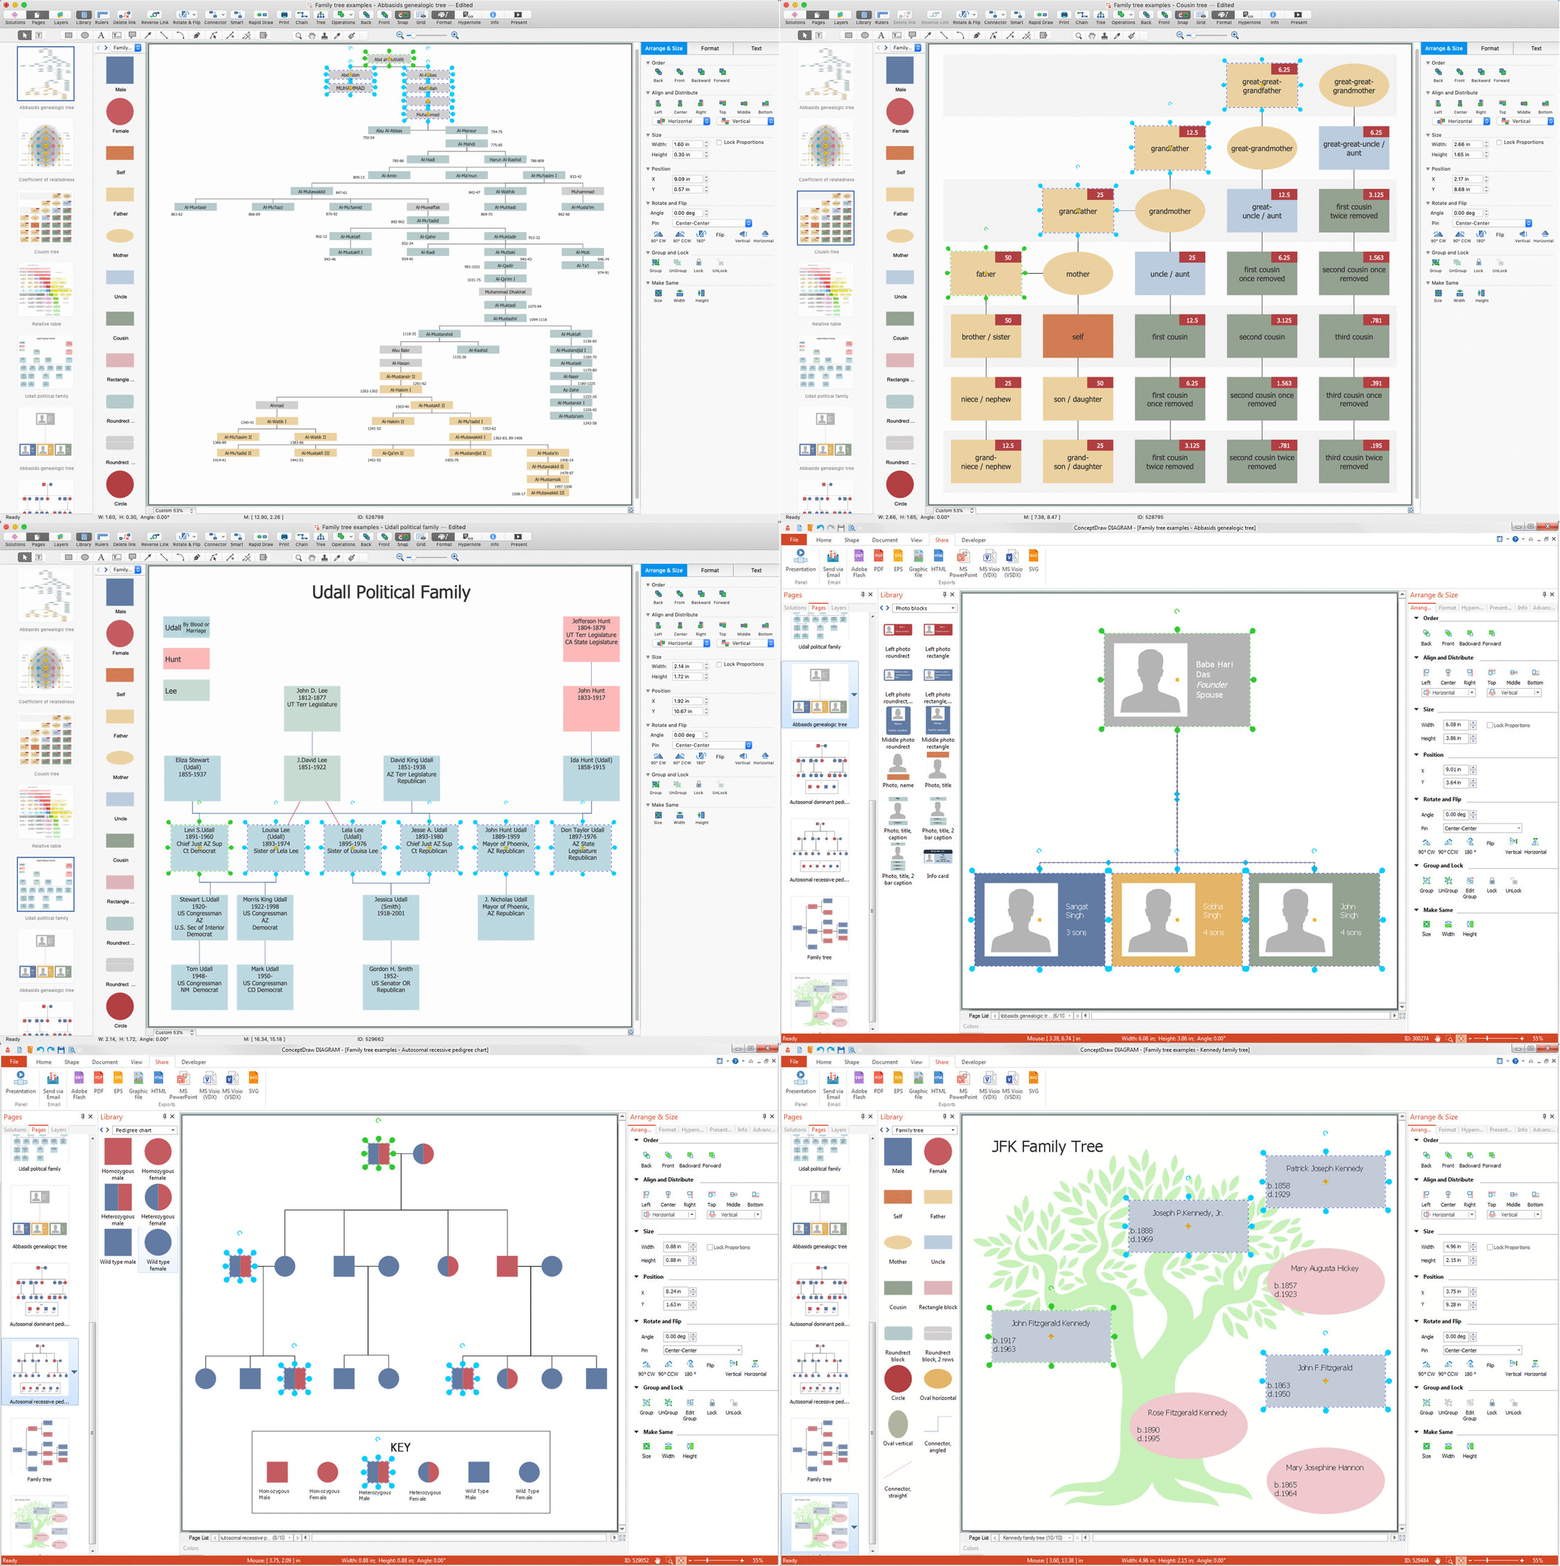
There are a few samples that you see on this page which were created in the ConceptDraw DIAGRAM application by using the Family Tree solution. Some of the solution's capabilities as well as the professional results which you can achieve are all demonstrated here on this page.
All source documents are vector graphic documents which are always available for modifying, reviewing and/or converting to many different formats, such as MS PowerPoint, PDF file, MS Visio, and many other graphic ones from the ConceptDraw Solution Park or ConceptDraw STORE. The Family Tree solution is available to all ConceptDraw DIAGRAM users to get installed and used while working in the ConceptDraw DIAGRAM diagramming and drawing software.
Example 1: Abbasids Genealogic Tree
This diagram was created in ConceptDraw DIAGRAM using the combination of libraries from the Family Tree Solution. An experienced user spent 20 minutes creating this sample.
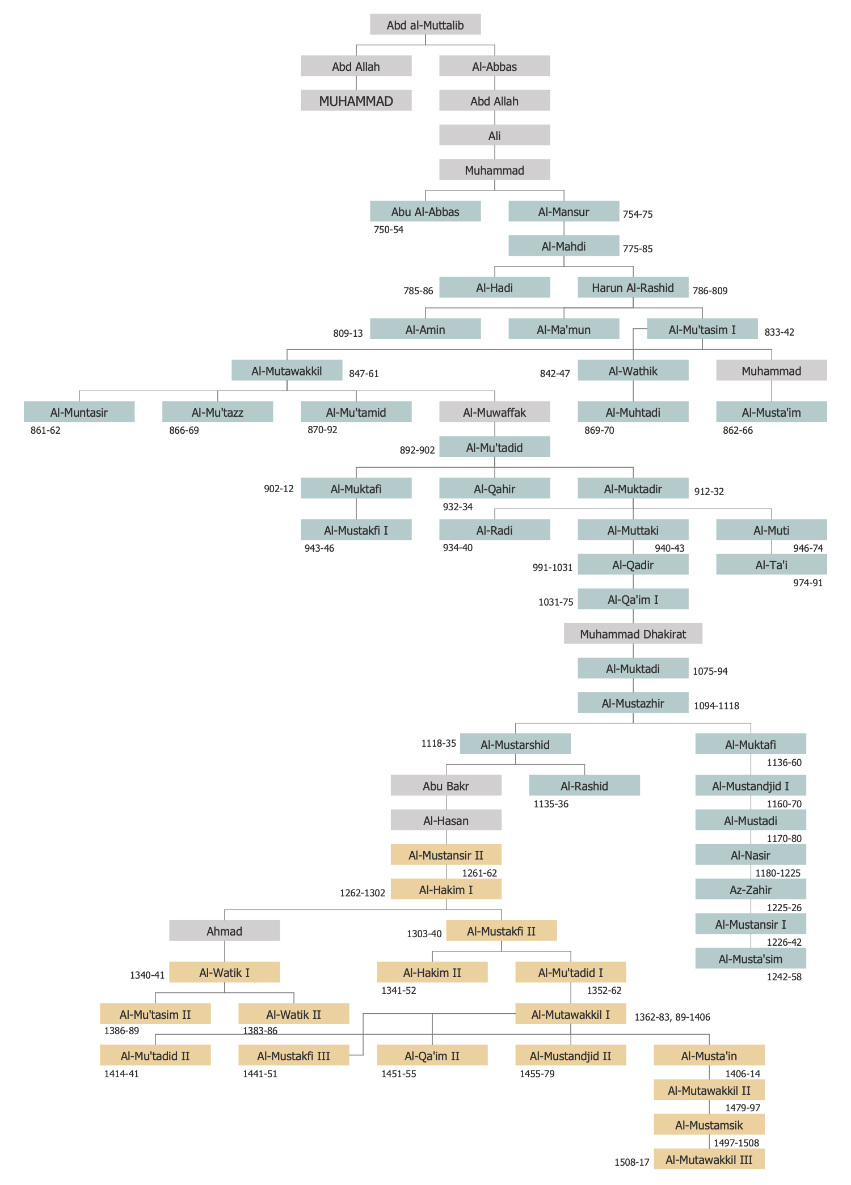
This sample represents the genealogic tree that was designed on the base of Wikimedia Commons file "Abbasids.png". The Abbasid caliphs were the third holders of the Islamic title of caliph. The Abbasid Caliphate replaced the Islamic prophet Muhammad. The state of the Abbasid Caliphate led by the Abbasids existed from 750 to 945 and from 1124 to 1258. It contained the territories of the modern Arab countries of Asia, part of Central Asia, Egypt, Iran, North Africa, and India. As for the family roots, the Abbasid dynasty is a branch of the Quraysh tribe that originates from al-Abbas ibn Abd al-Muttalib — the uncle of the Islamic prophet Muhammad. All chain of this family from VI to XVI century you can observe in this diagram. The dynasty begins from Abd al-Muttalib at the top of the tree (the dynasty's name also originates from its name), splits into two branches and expands by the line of Al-Abbas on many and many generations.
Example 2: Ambala Jattan's Ancestors
This diagram was created in ConceptDraw DIAGRAM using the combination of libraries from the Family Tree Solution. An experienced user spent 5 minutes creating this sample.
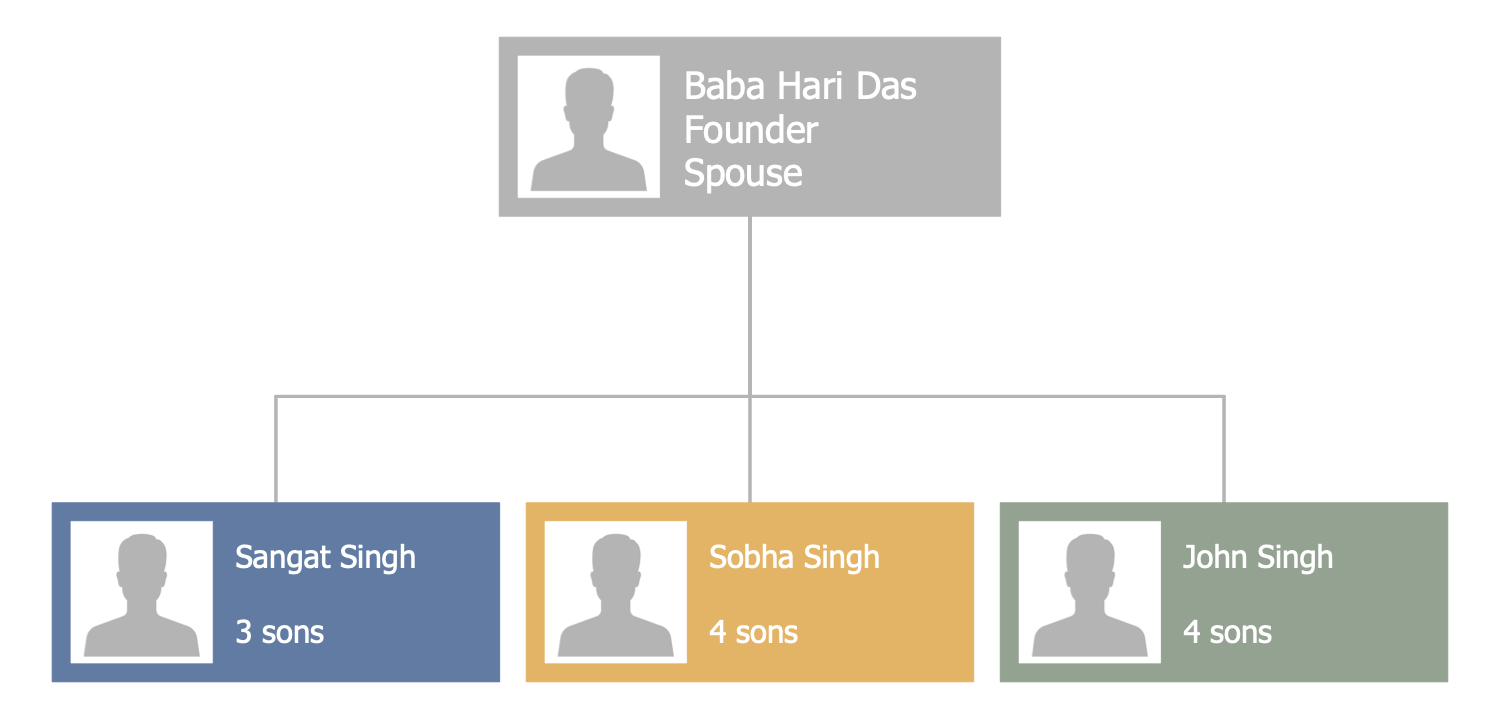
This descendants chart sample created in ConceptDraw DIAGRAM on the base of Wikimedia Commons file "Ambala Jattan — Founders.jpg" represents the Ambala Jattan's ancestors. The Ambala Jattan is a village located in India, in Punjab, District Hoshiarpur. It was founded in 1717 by Baba Hari Das that is at the center of this diagram. You can see from the diagram that this person had three sons: Sangat Singh, Sobha Singh, and John Singh. They were the first Singh generation who established the ascendancy and called this town 'Ambala Jattan'. It is also known that families currently residing in Ambala Jattan are their direct descendants. On your desire, the diagram can be easily extended because each of these three brothers had several sons, who in their turn had children, and so on until our times. The photos of all listed people can be also added to the topics along with additional information.
Example 3: Autosomal Dominant Pedigree Chart
This diagram was created in ConceptDraw DIAGRAM using the combination of libraries from the Family Tree Solution. An experienced user spent 5 minutes creating this sample.
This sample illustrates the autosomal dominant pedigree chart based on the same named file from the Wikimedia Commons. The autosomal dominance means that a chance of receiving and expressing some particular gene is 50%, and this fact is irrespective from the sex of a child and parent. Besides, even one copy of an abnormal gene from only one parent can cause serious disease or disorder. In most cases, the autosomal dominant condition is inherited from the affected parent, that's why it is useful to construct a similar tree to predict this risk and the ConceptDraw DIAGRAM with Family Tree solution will be useful for you. But, there are cases when it can be the result of a mutation in the gene, which can occur in people who never had this disease in previous generations. Such disorders as Marfan syndrome, Huntington’s disease, neurofibromatosis type 1 are typical examples of the autosomal dominant genetic disorders.
Example 4: Autosomal Recessive Pedigree Chart
This diagram was created in ConceptDraw DIAGRAM using the combination of libraries from the Family Tree Solution. An experienced user spent 5 minutes creating this sample.
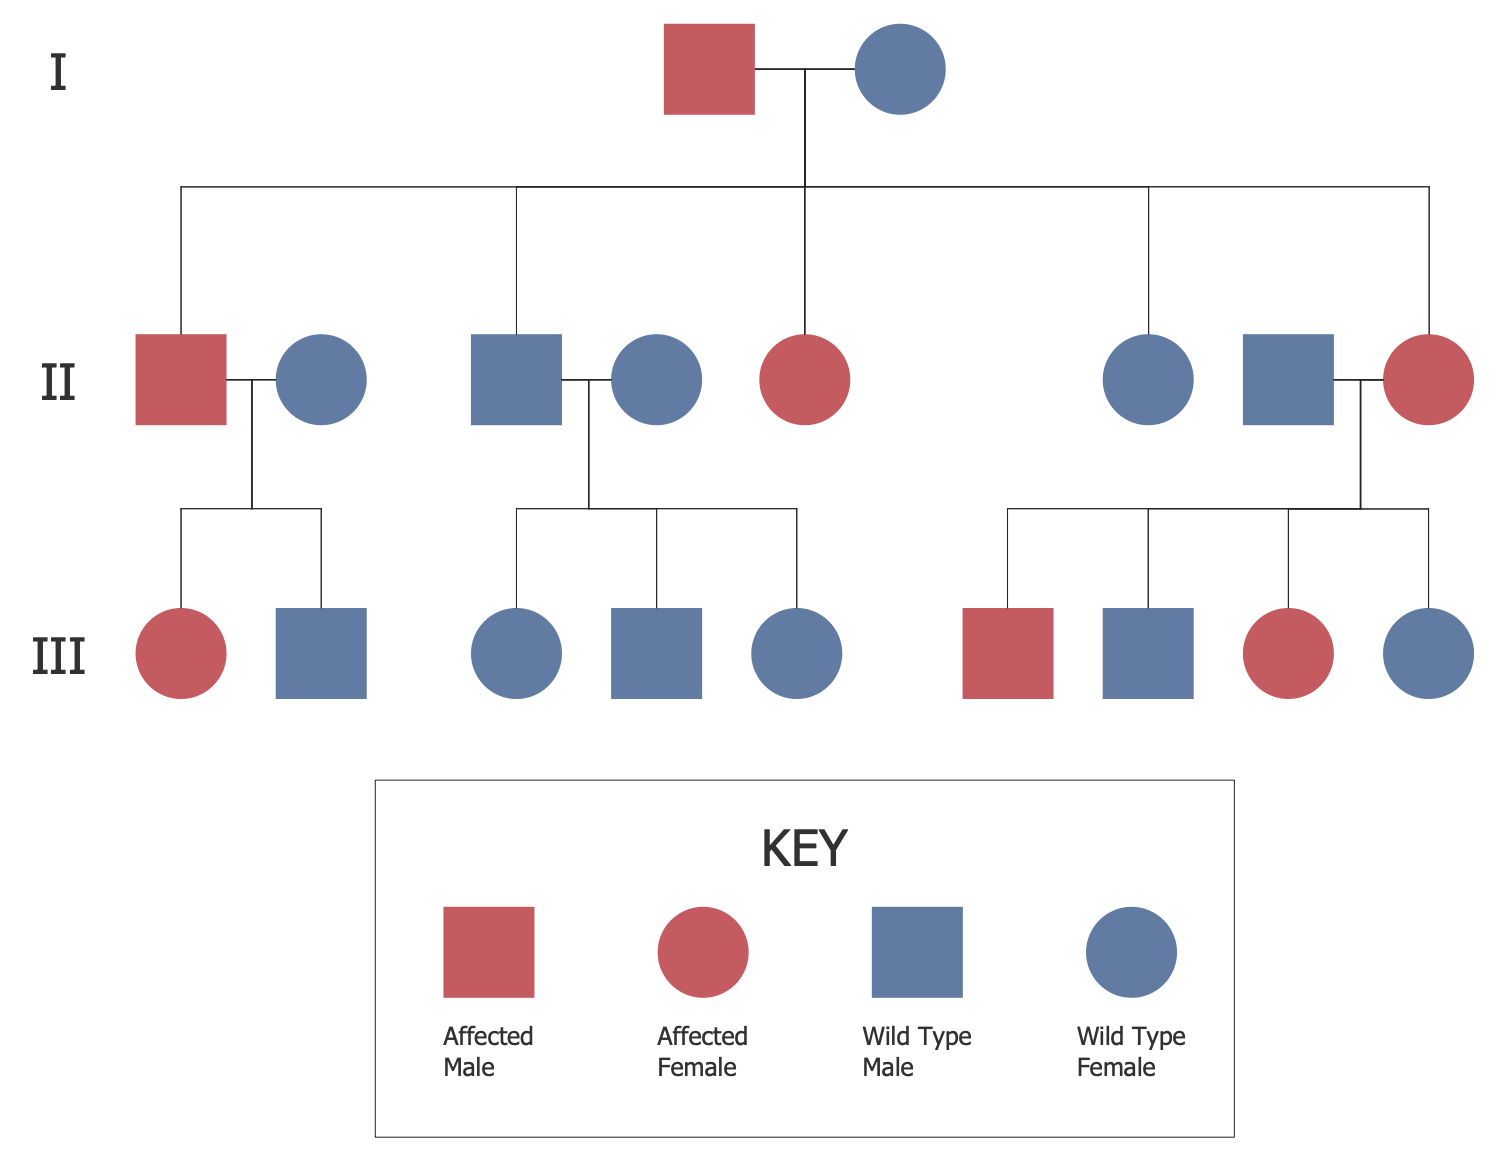
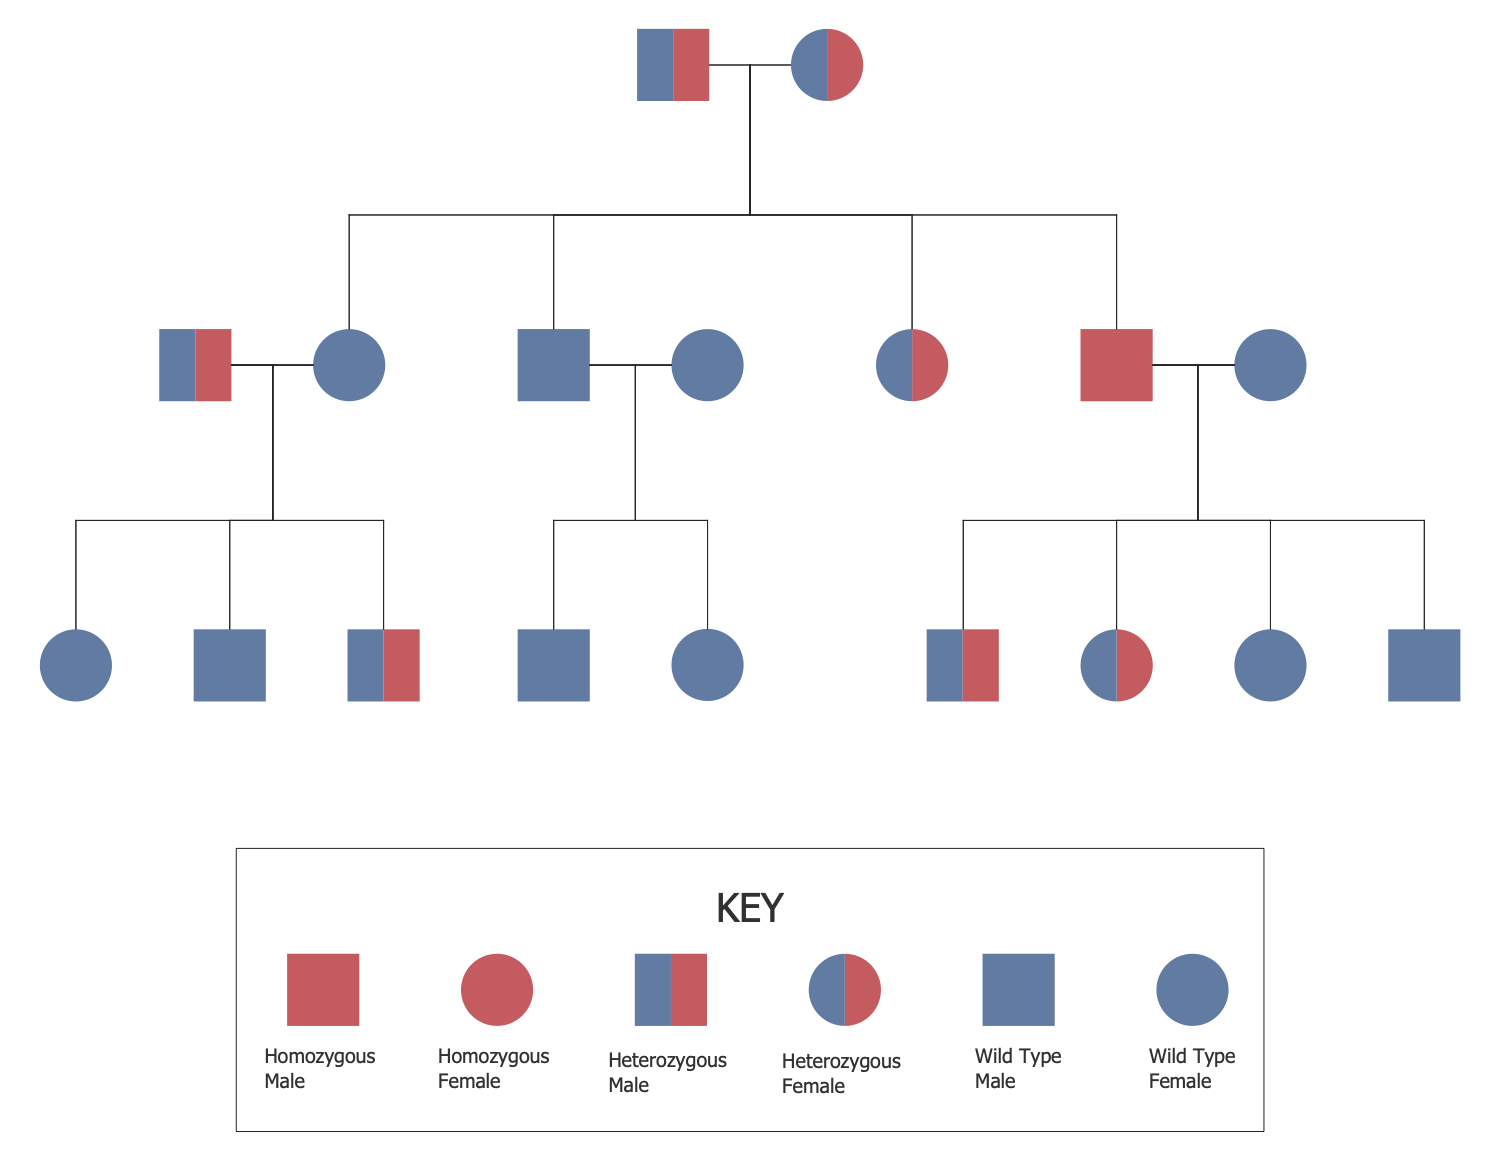
This pedigree chart example is dedicated to the autosomal recessive disorders in persons and their inheritance in a family. It is based on the “Autosomal Recessive Pedigree Chart.svg” file from the Wikimedia Commons. The autosomal recessive means the state when we have two copies of the abnormal gene that cause the disorder or disease, one mutated gene from each parent. Typically, these genes don't manifest themselves in parents’ organisms, there are no signs or symptoms, but parents are the carriers of the genes that can be inherited by their children. Besides, the autosomal recessive disorders don't appear in each generation of an affected family. It is the 'autosomal' because we are talking about changes in one of the first 22 chromosomes called the 'autosomes'. The sickle cell anemia and Cystic fibrosis are common examples of these genetic disorders. The key legend helps correctly understand and identify all kinds of symbols used in the diagram.
Example 5: Coefficient of Relatedness
This diagram was created in ConceptDraw DIAGRAM using the combination of libraries from the Family Tree Solution. An experienced user spent 15 minutes creating this sample.
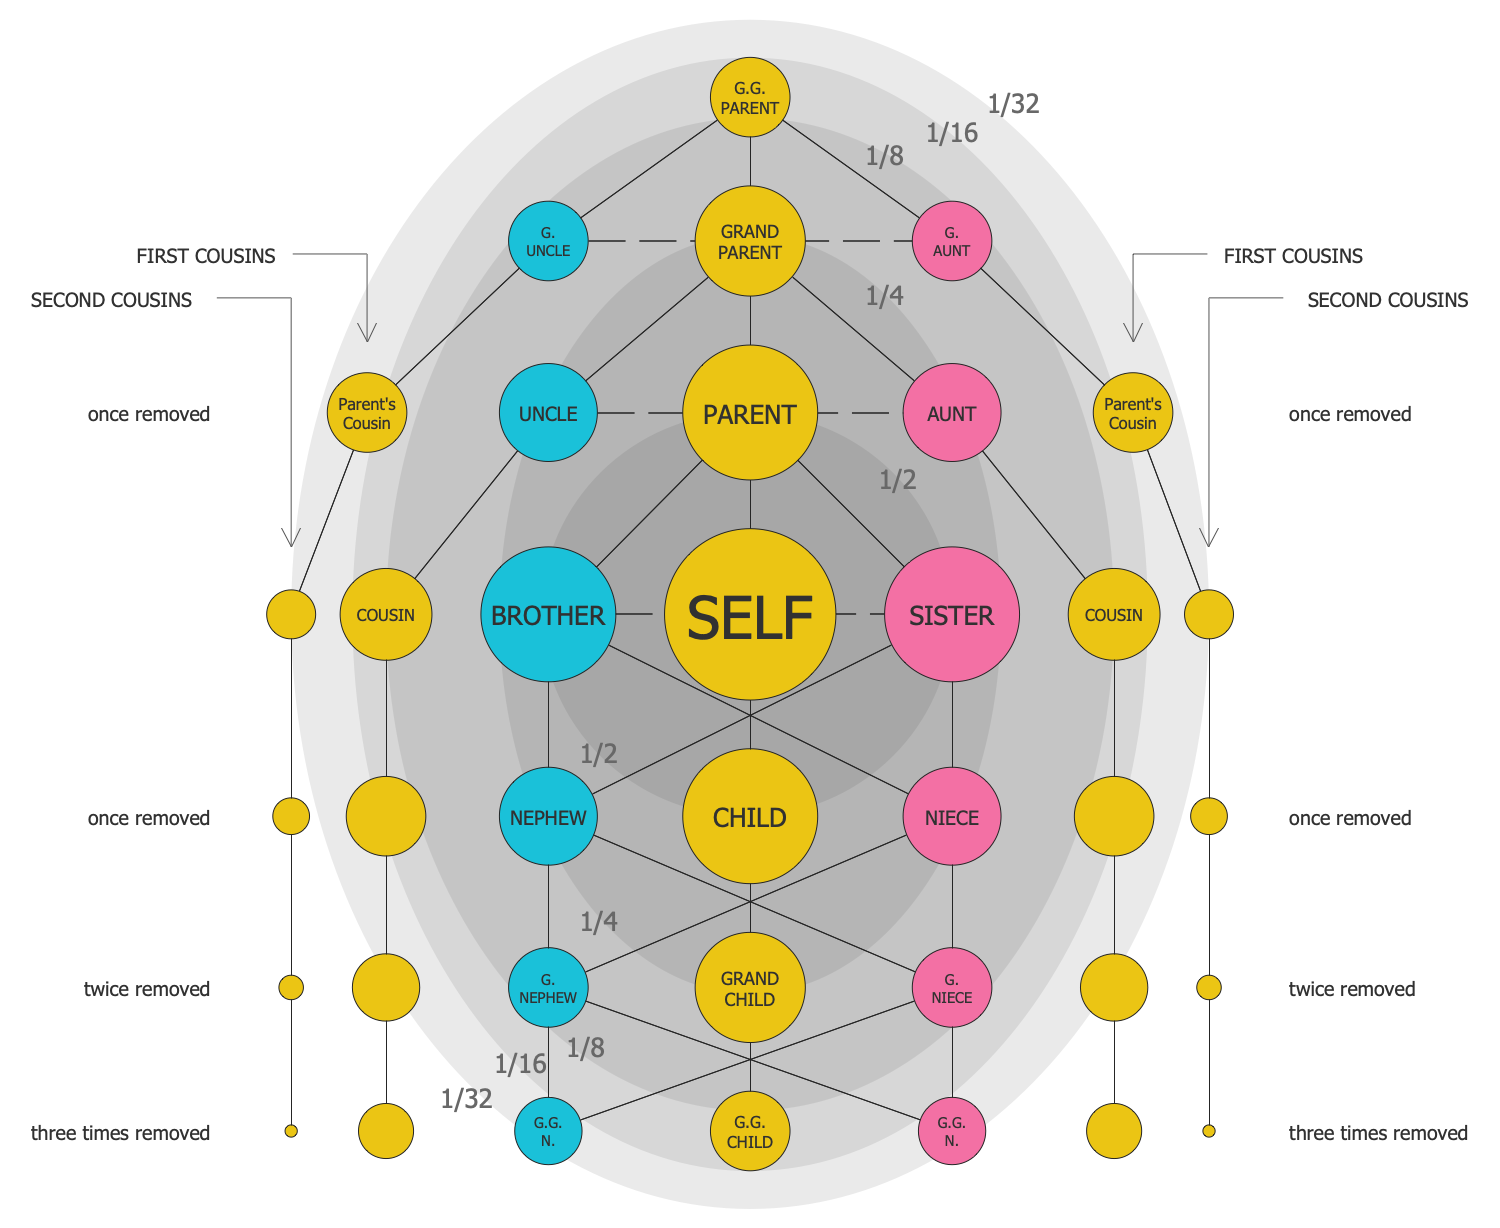
This diagram of family relationships demonstrates the calculation of coefficients of the relatedness between the relatives using a visual graphical representation. It is based on the Wikimedia Commons file “Coefficient of relatedness.png”. The relatives are represented in circles and the area of each one is scaled according to the coefficient of relatedness. The relatives of the male sex are highlighted in blue and female sex — in pink. The background coloring also has value — each grey circle or ellipse unites the relatives of the same relatedness. You can observe that with each new ellipse the coefficient of relatedness decreases. Thus, for example, the coefficient of relatedness between sister and nephew equals 1/2, and its value for niece and grandnephew is 1/4, and so on. The same trend is also observed in other direction — for parent and sister, grandparent and aunt, etc. The diagram includes several generations and extends up to the coefficient of relatedness 1/32.
Example 6: Cousin Tree
This diagram was created in ConceptDraw DIAGRAM using the combination of libraries from the Family Tree Solution. An experienced user spent 10 minutes creating this sample.
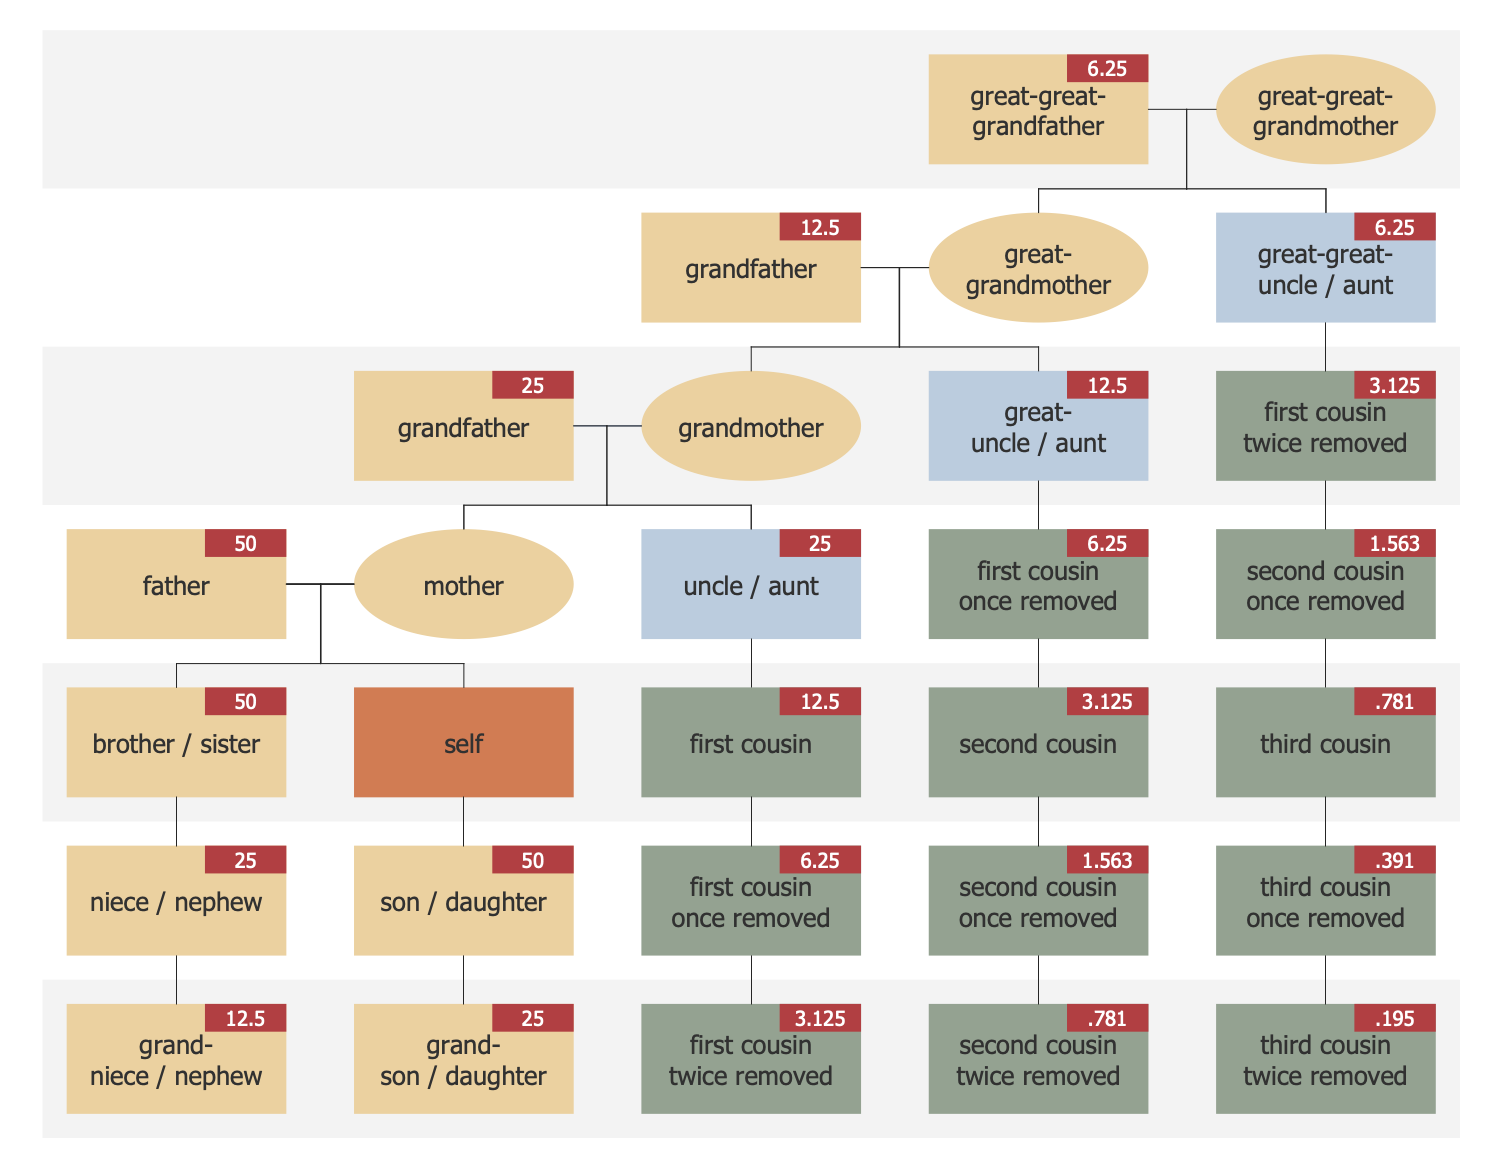
This family tree diagram sample represents the cousin tree based on the "CousinTree kinship.svg" file from the Wikimedia Commons. It strictly describes the kinship and the different types of cousins. The cousins are people whose most recent common ancestors are the grandparent. Typically, we know our first cousins, the second cousins rarer, but deeper it is a large rarity now. The similar genealogy diagrams help not forget our kinship, clearly identify the relationships of generations, and trace the cousins for many generations back. The maternity line relatives from the great-great-grandmother to mother are represented by the ellipse shapes, the rest relatives are depicted in rectangular shapes. The shapes are differentiated by colors. The "self" rectangle is the main for which this diagram is constructed, it is highlighted with orange. The coefficients of genetic kinship (gene share with "self" in percentage) are marked in small red boxes on the shapes.
Example 7: Family Tree
This diagram was created in ConceptDraw DIAGRAM using the combination of libraries from the Family Tree Solution. An experienced user spent 5 minutes creating this sample.
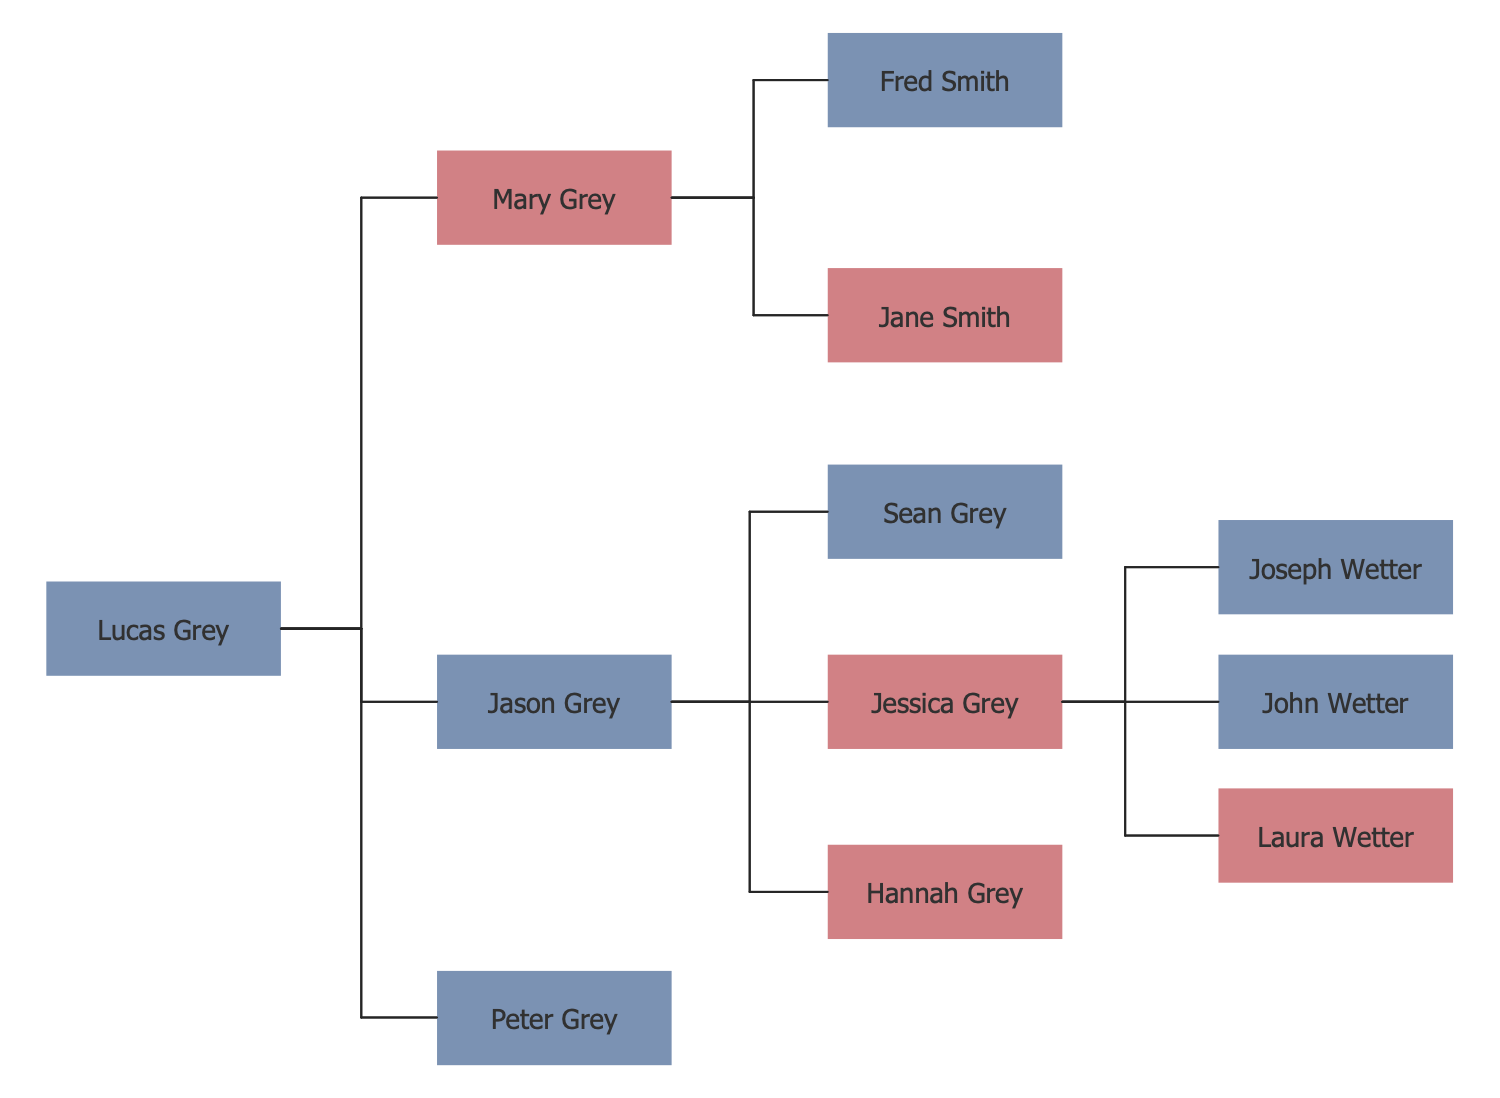
This diagram sample demonstrates a traditional family tree based on the “Family tree.svg” file proposed in the Wikimedia Commons. This family tree hasn't vertical structure, it is placed horizontally and needs to be read from left to right. The father Lucas Grey has three children — one daughter and two sons. Its daughter Mary Grey has two children, and one of his sons Jason Grey is a father of three sons, another son Peter Grey has no children. So, Lucas Grey is the father, the grandfather of five grandchildren, and also the great-grandfather of three great-grandchildren, because Jessica Grey (Jason's daughter) is a mother of three siblings — Joseph, John, and Laura. The children of Mary and Jessica have their fathers' surnames, Smith and Wetter correspondingly. The female persons are represented in red boxes and male persons in blue. When this family will extend, the diagram can be easily proceeded in ConceptDraw DIAGRAM family tree maker.
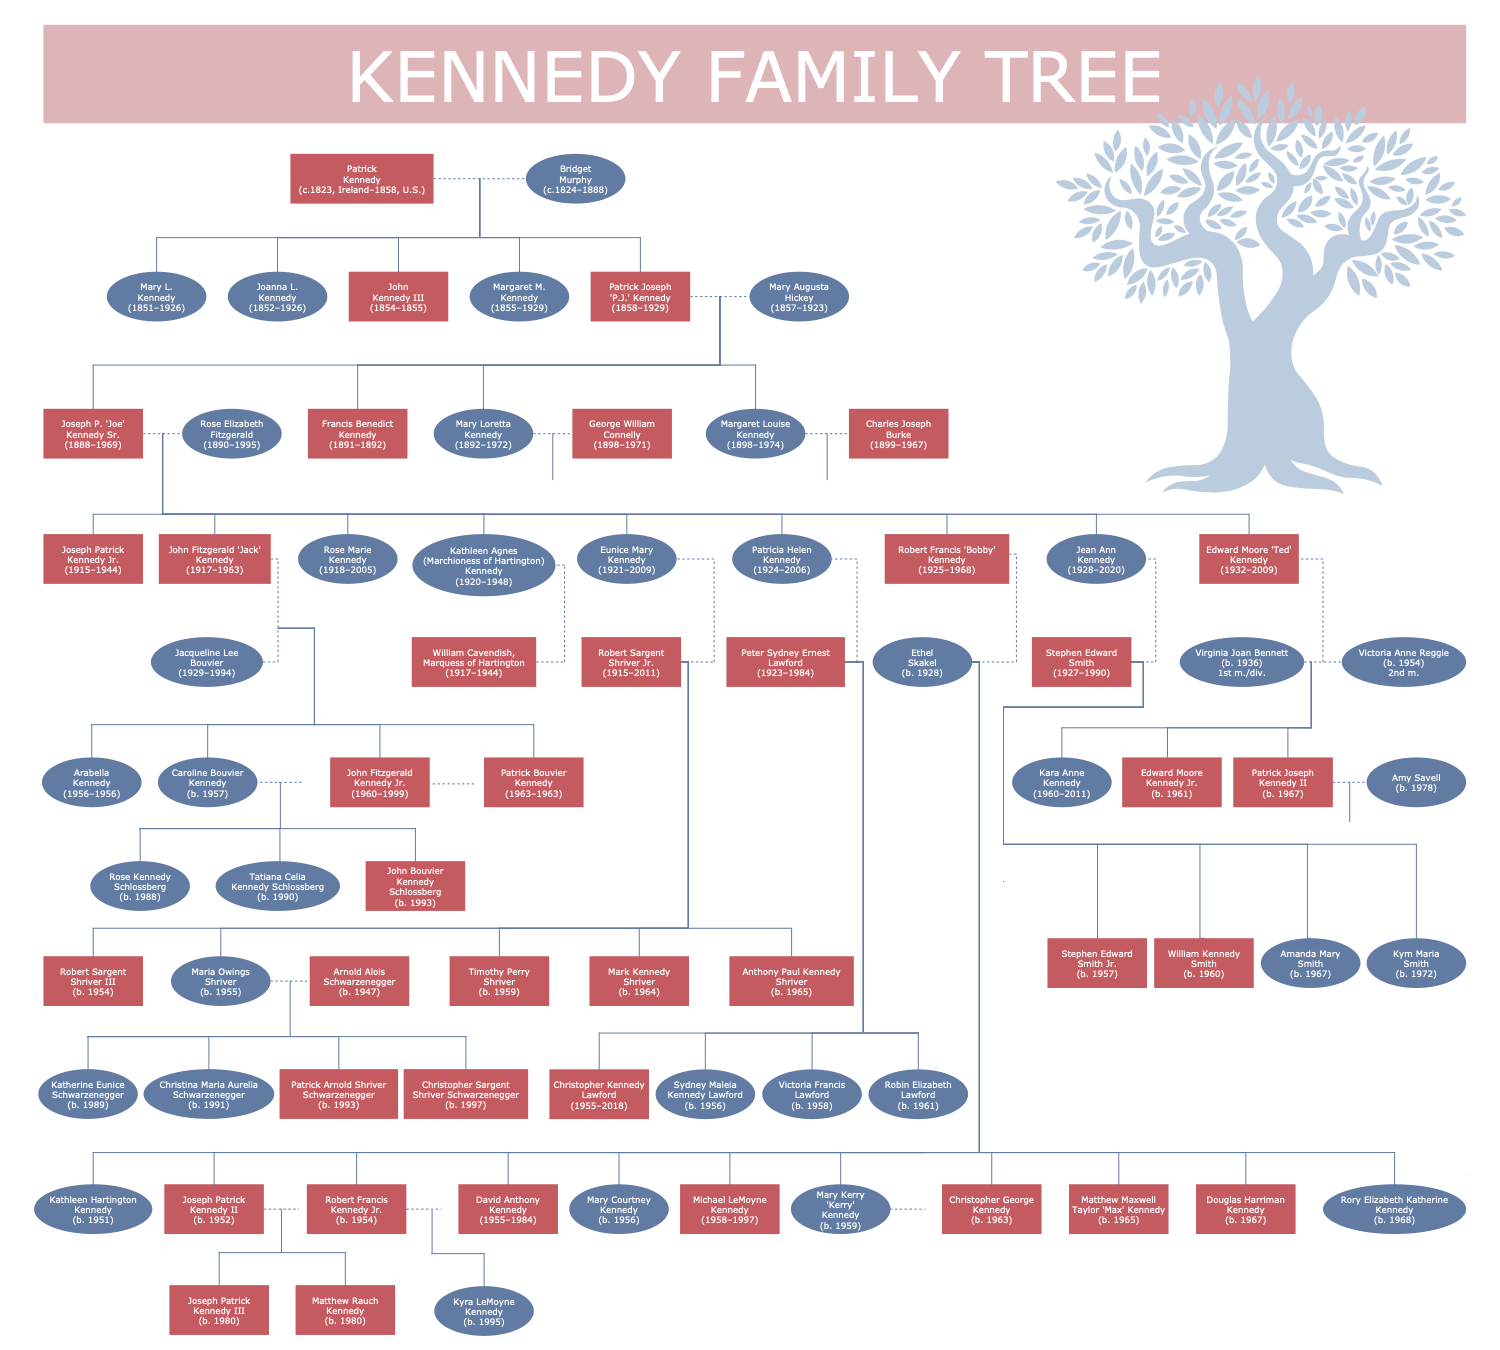
Example 8: Kennedy Family Tree
This diagram was created in ConceptDraw DIAGRAM using the combination of libraries from the Family Tree Solution. An experienced user spent 10 minutes creating this sample.
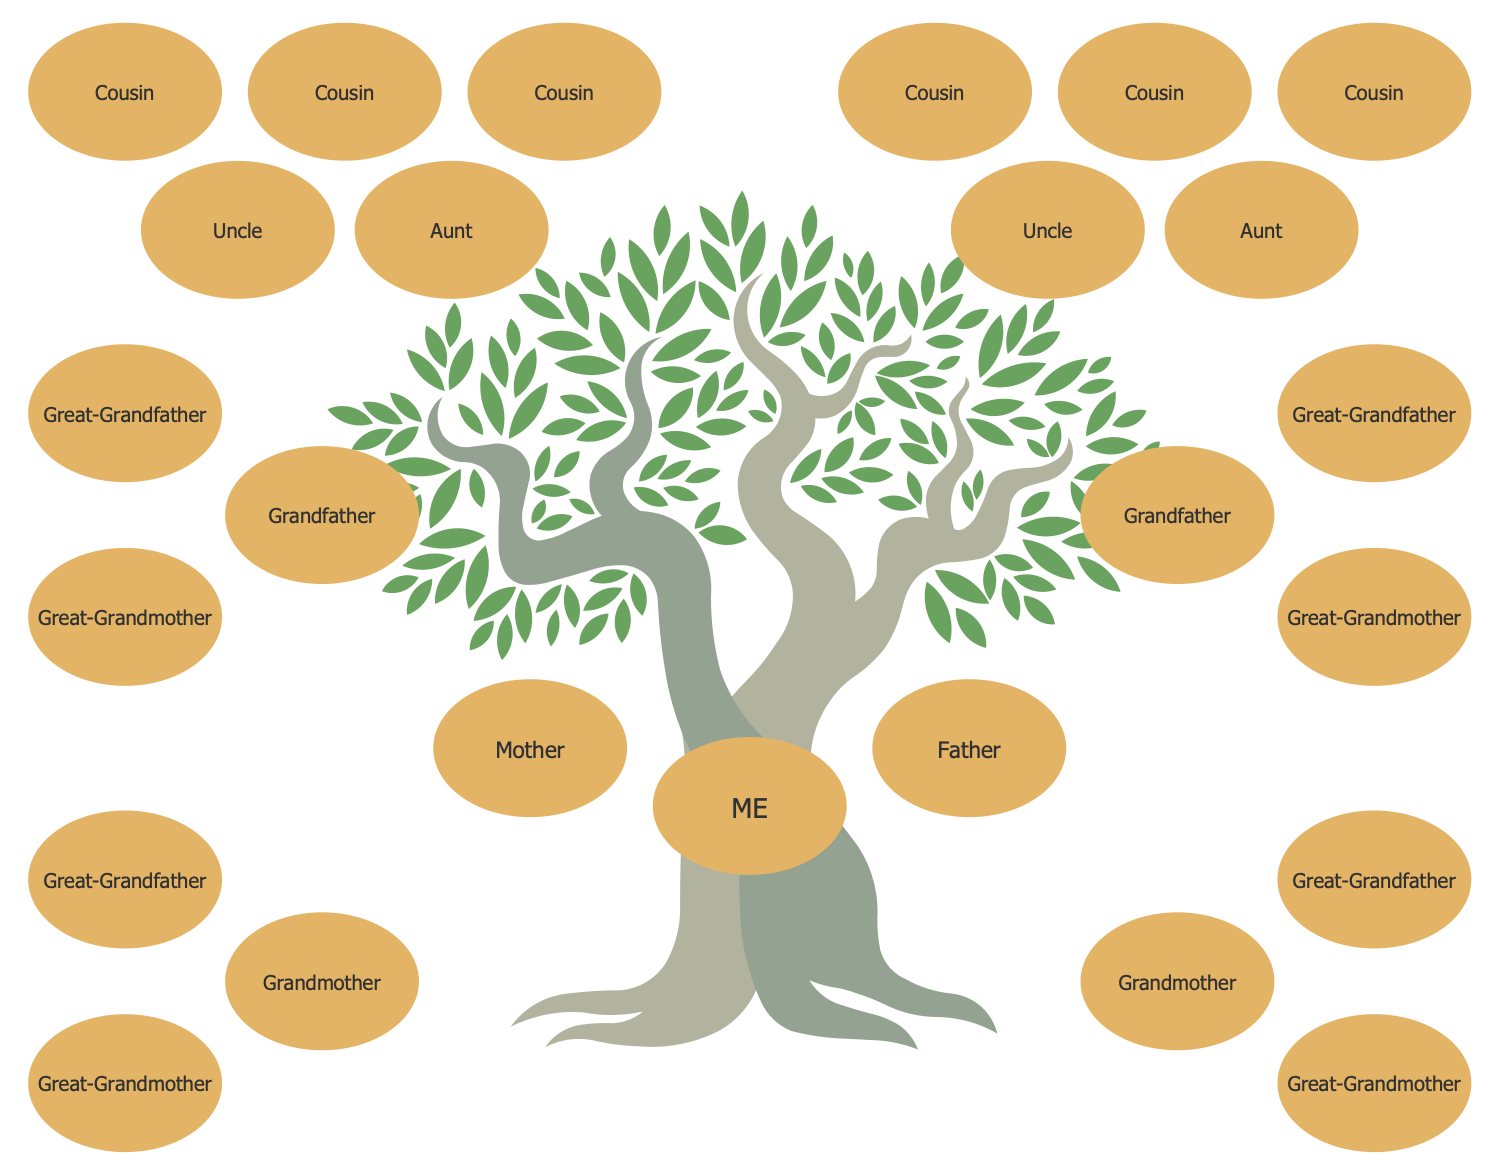
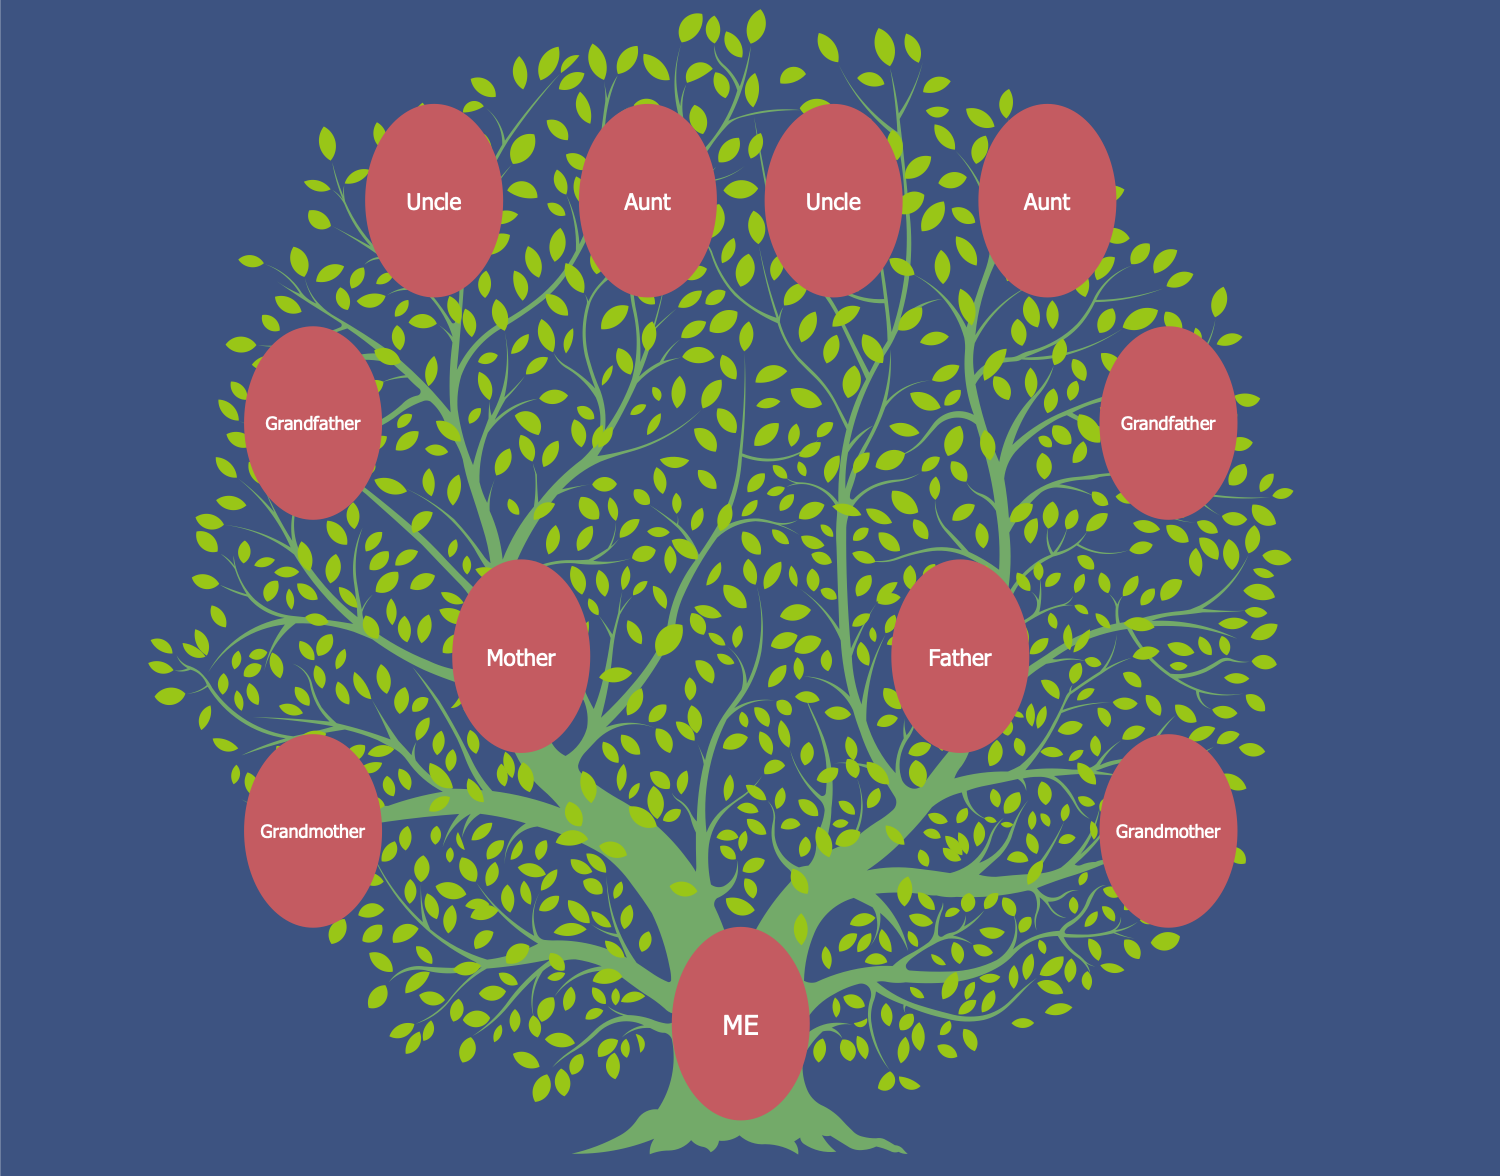
This ahnentafel family tree example represents the famous US family — the family of Kennedy. The diagram was made on the base of Wikimedia Commons file “Family_Tree_Sample.jpg”. The term 'ahnentafel' means the genealogical numbering system that lists all direct ancestors of a specific person in a fixed sequence, delving to the roots: person — its father / mother — paternal grandfather / grandmother and maternal grandfather / grandmother, and so on. The illustration of a tree as the background of this diagram is really symbolic, because our ancestry when it is depicted as a scheme on paper or screen really resembles a huge tree, hence the name of such diagrams — "family trees". For each of the represented persons are indicated the dates of their birth and death. The color differences are immediately noticeable, so without difficulty, you can determine who is male or female from the presented Kennedy's relatives.
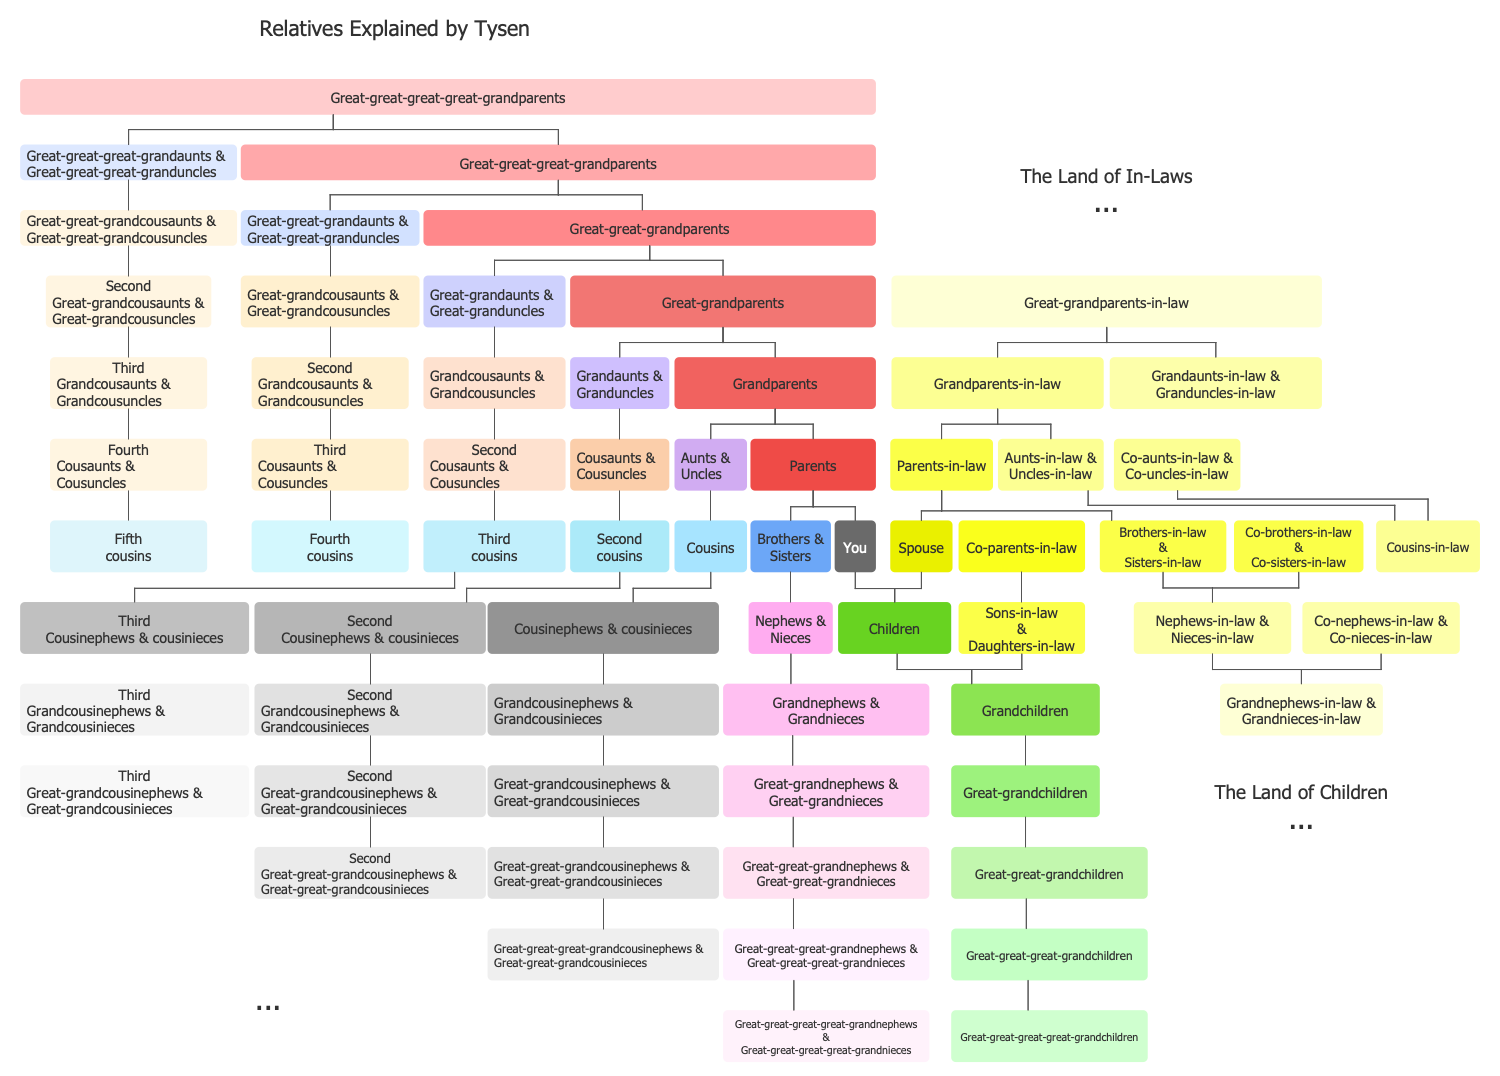
Example 9: Relative Table
This diagram was created in ConceptDraw DIAGRAM using the combination of libraries from the Family Tree Solution. An experienced user spent 20 minutes creating this sample.
This sample diagram represents the relative table at the form of a family tree. It was constructed on the base of Wikimedia Commons file “Relative Table.png” and depicts the relations of a lot of people to “you” that is presented as the black square. From ancient times, each degree of kinship has its own name for both relatives. Now, all these names are collected and can be observed in one diagram. It is an excellent illustrative tree that has a strict order and lets identifying the name of any from your relatives right now. Many generations are represented in this ancestry tree. It is a perfect presentation and educational material. Design with ease the family trees of any depth in ConceptDraw DIAGRAM and make them so colorful as this family tree in a few seconds. Pay attention that the color's intensity decreases as you move away from "you", what is observed for each color.
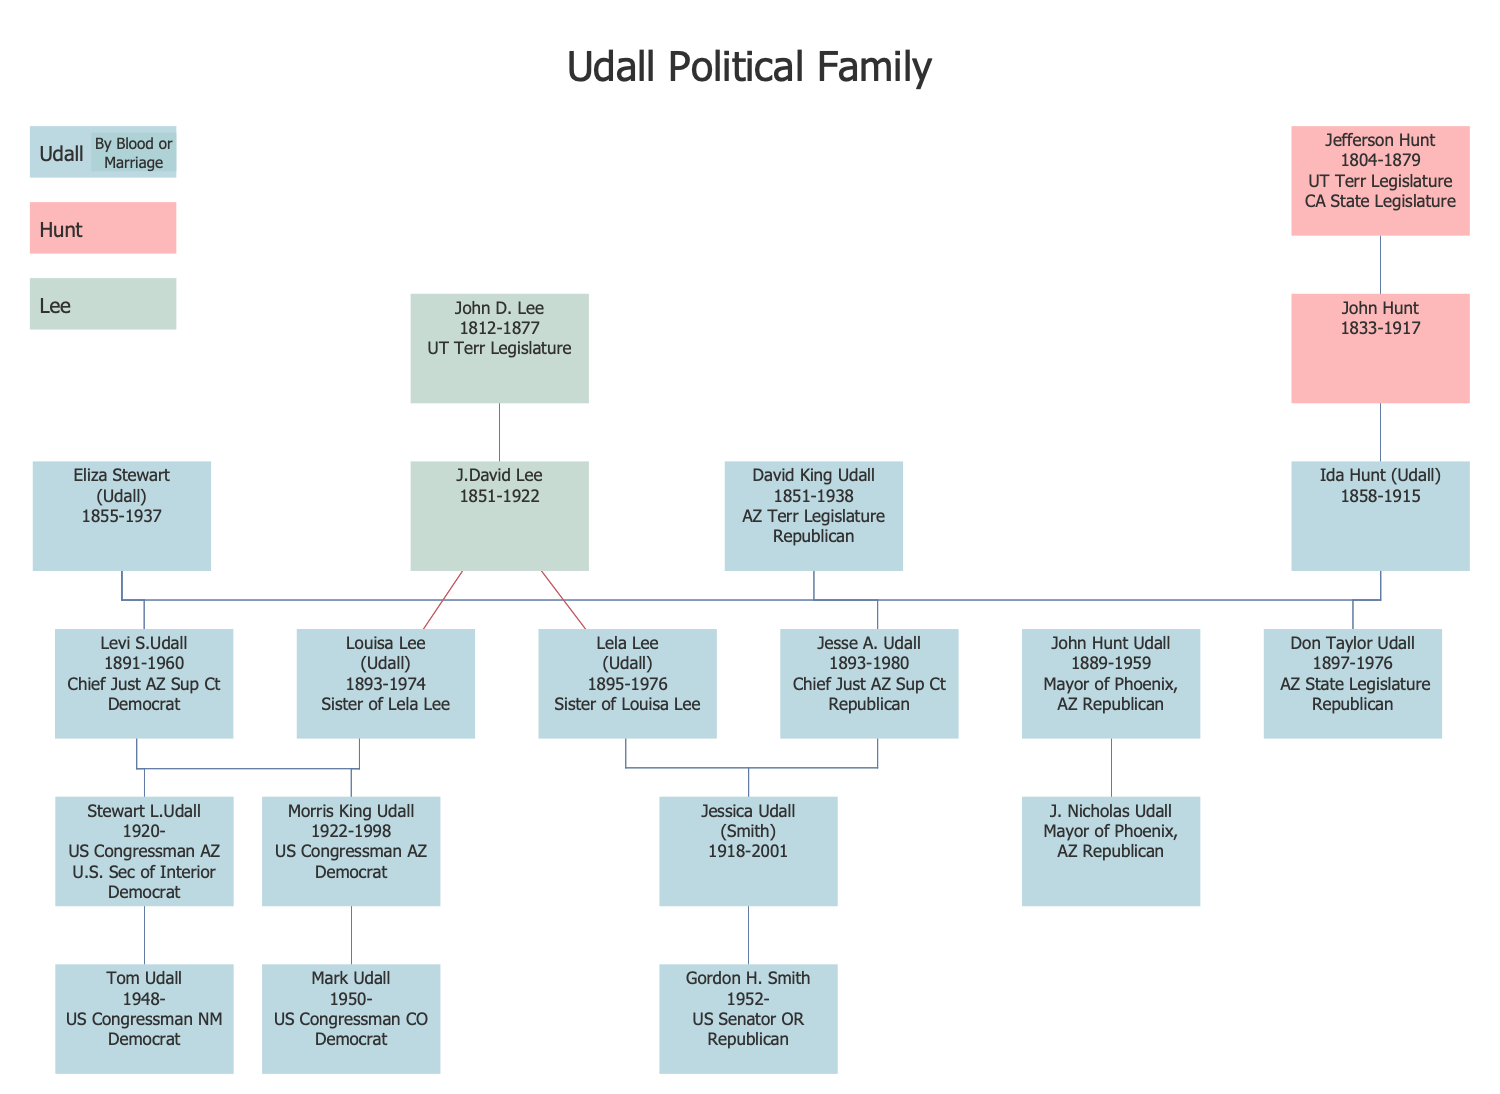
Example 10: Udall Political Family
This diagram was created in ConceptDraw DIAGRAM using the combination of libraries from the Family Tree Solution. An experienced user spent 10 minutes creating this sample.
This family tree diagram sample was designed on the base of Wikipedia file "Udall Political Family.jpg" by means of ConceptDraw's Family Tree solution. It illustrates the family of well-known politician David King Udall, who was a representative to the Arizona Territorial Legislature. In 1887, David King Udall became a Stake president and held this position for 35 years. It is known that Udall's family has close bonds with Hunt and Lee families, these links are clearly represented in the diagram. Moreover, the representatives of all three families have the different coloring of the boxes, the correspondence of colors is adduced at the legend. His great-grandson Tom Udall also presented on this diagram is currently the senior United States Senator from New Mexico. This family tree is an example of a large tree made for the family with a great history and roots, the known few generations back and ahead from David King.
Inside
What I Need to Get Started
Both ConceptDraw DIAGRAM diagramming and drawing software and the Family Tree solution can help creating the diagrams you need. The Family Tree solution can be found in the Diagrams area of ConceptDraw STORE application that can be downloaded from this site. Make sure that both ConceptDraw DIAGRAM and ConceptDraw STORE applications are installed on your computer before you get started.
How to install
After ConceptDraw STORE and ConceptDraw DIAGRAM are downloaded and installed, you can install the Family Tree solution from the ConceptDraw STORE.
Start using
To make sure that you are doing it all right, use the pre-designed symbols from the stencil libraries from the solution to make your drawings look smart and professional. Also, the pre-made examples from this solution can be used as drafts so your own drawings can be based on them. Using the samples, you can always change their structures, colors and data.
